Original Article – DOI: 10.33594/000000870
CPB (60): 270 - 279
Accepted: 11.05.2026 - Published: 15.05.2026
Exploring the Influence of Schisandrin B on Mice with Multiple Myeloma
Keywords
Abstract
Background/Aims: The management of multiple myeloma (MM), a formidable hematological malignancy, continues to pose substantial challenges in the medical realm. Schisandrin B (Sch B), a compound derived from Traditional Chinese Medicine, has demonstrated potent anti-tumorigenic properties, providing a promising avenue for therapeutic intervention in this disease. However, the impact of Sch B on MM in vivo remains unexplored. Methods: The impact of Sch B on tumor growth was evaluated through precise measurements of body weight, tumor volume and cell proliferation. The progression of the cell cycle and the induction of apoptosis were examined utilizing flow cytometry. ELISA was conducted to quantify the levels of interleukin-6 (IL-6) and vascular endothelial growth factor (VEGF). Immunofluorescence assays was employed to check the concentration of reactive oxygen species (ROS). Finally, western blot technique was employed to determine the expression levels of IL-6, JAK2, phosphorylated JAK2 (p-JAK2), STAT3, and phosphorylated STAT3 (p-STAT3) in order to gain insights into their relative abundance and activation status. Results: Our findings demonstrated that Sch B exhibited a profound inhibitory effect on the proliferation of transplanted tumors, effectively arresting them at the S phase of the cell cycle and triggering cell apoptosis. Furthermore, it was observed that Sch B exerted a down-regulatory influence on the expression of IL-6, VEGF, p-JAK2, and p-STAT3, while concurrently upregulating the levels of ROS in mice afflicted with MM. Importantly, a synergistic effect was noted when Sch B was administered in combination with bortezomib. Conclusion: Sch B emerges as a promising agent for the treatment of MM, and its efficacy is significantly enhanced when coupled with bortezomib.
Introduction
Multiple myeloma (MM) is a type of incurable hematological neoplasm characterized by an excessive proliferation of uncontrolled plasma cells within the bone marrow and the presence of monoclonal immunoglobulin proteins in the peripheral blood [1]. It occupies nearly 1% of new cancer cases in the world, exceeding 10% of hematological malignancies [2]. According to the report of American Cancer Society, 35, 730 new patients with MM were diagnosed in the United States in 2023, and 12, 590 patients died from it [3]. There are advancements in treatment with novel agents such as monoclonal antibodies and chimeric antigen receptor T cells [4, 5], but over 10% of patients remain unresponsive to current therapies. Therefore, additional therapeutic strategies are needed for MM patients. Schisandrin B (Sch B), a traditional Chinese medicine, exhibits diverse pharmacological effects including antioxidant, antineoplastic, neuroprotective, cardioprotective, and hepatorenal protective activities [6]. SchB effectively inhibits cells proliferation, invasion and migration of colorectal cancer cell lines by CXCL2/ERK/DUSP11 axis [7]. Our previous study has demonstrated that Sch B inhibited the proliferation of MM cell lines [8]. However, its impact on MM in mice and its synergistic effect with bortezomib have not been further confirmed in vivo. This study is to investigate MM mice treated with Sch B or in combination with bortezomib, examining its impact on proliferation, cell cycle, cell apoptosis, IL-6, VEGF, ROS, JAK2, p-JAK2, STAT3 and p-STAT3. Our findings are expected to yield innovative perspectives on the potential therapeutic advantages of Sch B as a standalone agent or in combination with bortezomib for the treatment of MM.
Materials and Methods
Preparation of tissue cell suspension
To prepare the tissue cell suspension, the tumor tissue is subjected to digestion using 0.25% Trypsin. Gentle pipetting is employed to disintegrate the tissue clumps. Cells are filtered through cell strainer to remove remaining debris. The filtered cells are centrifuged at 250 × g for 5 minutes and subsequently resuspended in a culture medium.
Cell proliferation assay
The tissue cell suspensions from each group are collected and subsequently suspended in RPMI-1640 medium fortified with 10% fetal bovine serum (FBS). Once the desired cell concentration of 4×10^3 cells per well has been achieved, the cells are carefully seeded into a 96-well plate. 10 μL of CCK-8 reagent is then dispensed into each well and incubate for 2-4 hours. Subsequently, the absorbance at a wavelength of 450 nm is measured to quantitatively assess cell proliferation.
Cell cycle analysis
The tissue cell suspensions from each group are collected, washed, and subsequently fixed. A mixture containing propidium iodide (PI) and ribonuclease (Rnase) is introduced. Flow cytometry is employed for detection, with a general count of 2-30, 000 cells. Results are subsequently analyzed using dedicated software for cell cycle simulations.
Cell apoptosis
In this phase, the tissue cell suspensions from each group are collected and washed twice with chilled PBS. A volume of 100 μL of binding buffer is added to each group, followed by 5 μL of Annexin V-phycoerythrin (Annexin V-PE), ensuring thorough mixing. The mixture is then incubated at room temperature in the dark for 30 minutes. Subsequently, 5 μL of 7-aminoactinomycin D is added. This is followed by a further 15-minute incubation. The volume is brought up to 500 μL with binding buffer, and flow cytometry is utilized within one hour to detect apoptotic cells.
ROS detection
To initiate ROS detection, tissue cell suspensions from each group are collected and suspended in serum-free culture medium, with the cell count adjusted to 1-5×10^6/mL. A 1:5000 ratio of DCFH-DA is added. Subsequent to this incubation period, the cells are washed to effectively remove any unincorporated DCFH-DA. Ultimately, intracellular fluorescence is examed under a fluorescent microscope.
Enzyme-linked immunosorbent assay (ELISA) assay
The tissue cell suspensions from each group are collected. The concentrations of IL-6 and VEGF are determined using a purchased ELISA kit, according to the manufacturer's protocol provided in the kit's instructions.
Western blotting assay
The tissue cell suspensions from each group are collected and lysed by RIPA (Beyotime) on ice for 30 min. The BCA protein quantification kit (Thermo Scientific) was employed to determine protein concentration. Subsequently, the protein samples were subjected to separation by SDS-PAGE (Epizyme) and subsequently transferred onto PVDF membranes (Millipore). The membranes were then blocked using 5% skim milk and subsequently incubated with primary antibodies. The membranes were incubated with the secondary antibody and exposed to ECL Reagent (Sangon) for chemiluminescent detection. ACTIN served as an internal control throughout the process. Antibodies against IL-6, JAK2, p-JAK2, STAT3, p-STAT3, and ACTIN all were obtained from Cell Signaling Technology.
The establishment of an MM model in mice
A total of 18 female BALB/c mice (6-8 weeks old) were procured from the Model Animal Research Center at Nanchang University and housed under specific pathogen-free conditions. Each mouse received a subcutaneous injection of 2 x 10^7 RPMI 8226 or U266 cells on the right flank. Once the tumor volume was 50 mm³, Mice were administrated with Sch B (20 mg/kg) or Sch B and bortezomib (0.75 mg/kg) via intraperitoneal injection every other day.
Statistical analysis
The data were expressed as mean ± standard deviation (x̄ ± SD). GraphPad Prism version 7 was utilized for statistical analysis, with a one-way ANOVA and unpaired t-test employed for the assessment. The significance level of p < 0.05 was set.
Results
SchB suppressed the tumor growth of MM mice
Our study examined the impact of Sch B on mice harboring RPMI8226 or U266 cells. As illustrated in Fig. 1A-B, the control group's body weights were 21.67±0.46 and 21.3±0.38, respectively. In contrast, the body weights of MM mice treated with either Sch B or in combination with bortezomib exhibited an increasing trend (Sch B: 23.4±1.46, 25.07±0.27; Sch B + bortezomib: 24.33±0.47, 25.4±0.21). Furthermore, we observed a significant inhibitory effect on both tumor volume and MM cell proliferation (Fig. 1C-D). Tumor weights in control group were 2.56±0.2 and 2.4±0.06, whereas those in MM mice treated with either Sch B or in combination with bortezomib were 1.63±0.094, 0.77±0.091, 1.4±0.06, and 0.93±0.03, respectively. Additionally, the cell viability of MM mice with RPMI8226 or U266 cells in the three groups were 1.17±0.086, 0.63±0.09, 0.5±0.06, 1.23±0.089, 0.6±0.06 and 0.5±0.06, respectively (Fig. 1E-F). These findings collectively suggest that Sch B, when used alone or in combination with bortezomib, effectively inhibits tumor growth in MM mice.

Fig. 1: Sch B suppressed the tumor growth of MM mice. (A-B) body weight;(C-D) tumor weight;(E-F) cell viability. ∗𝑃 < 0.05, ∗∗𝑃 < 0.01, ∗∗∗𝑃 < 0.001, ∗∗∗∗𝑃 < 0.0001.
Sch B induced cells cycle in S phase of MM mice
The distribution of various cell cycle phases in MM mice was investigated; we employed flow cytometry and obtained the results depicted in Fig. 2. In the control group with RPMI8226-bearing MM mice, the respective proportions of the G1, S, and G2 phases were 37.54 ± 1.12%, 29.41 ± 0.42%, and 14.86 ± 0.31%. However, when considering the Sch B or combined with bortezomib treatment, the S phase proportion was found to be elevated compared to the control group, standing at 38.46 ± 0.63% and 41.48 ± 0.73%, respectively. The corresponding distributions of the G1 and G2 phases were 26.62 ± 0.96% and 9.35 ± 0.53% for Sch B, 24.3 ± 0.23% and 8.51 ± 0.26% for the combined treatment. Regarding U266-bearing MM mice, their cell cycle distribution across three groups was as follows: G1 phase (38.52 ± 0.99%, 26.25 ± 0.29%, and 25.93 ± 0.35%), S phase (28.76 ± 0.21%, 38.38 ± 1.13%, and 41.43 ± 0.21%), and G2 phase (14.85 ± 0.14%, 8.73 ± 0.74%, and 7.4 ± 0.06%). These findings collectively suggest that Sch B, when combined with bortezomib, induces a cell cycle arresting specifically at the S phase in MM mice, thereby modulating the progression of the disease process at the molecular level.
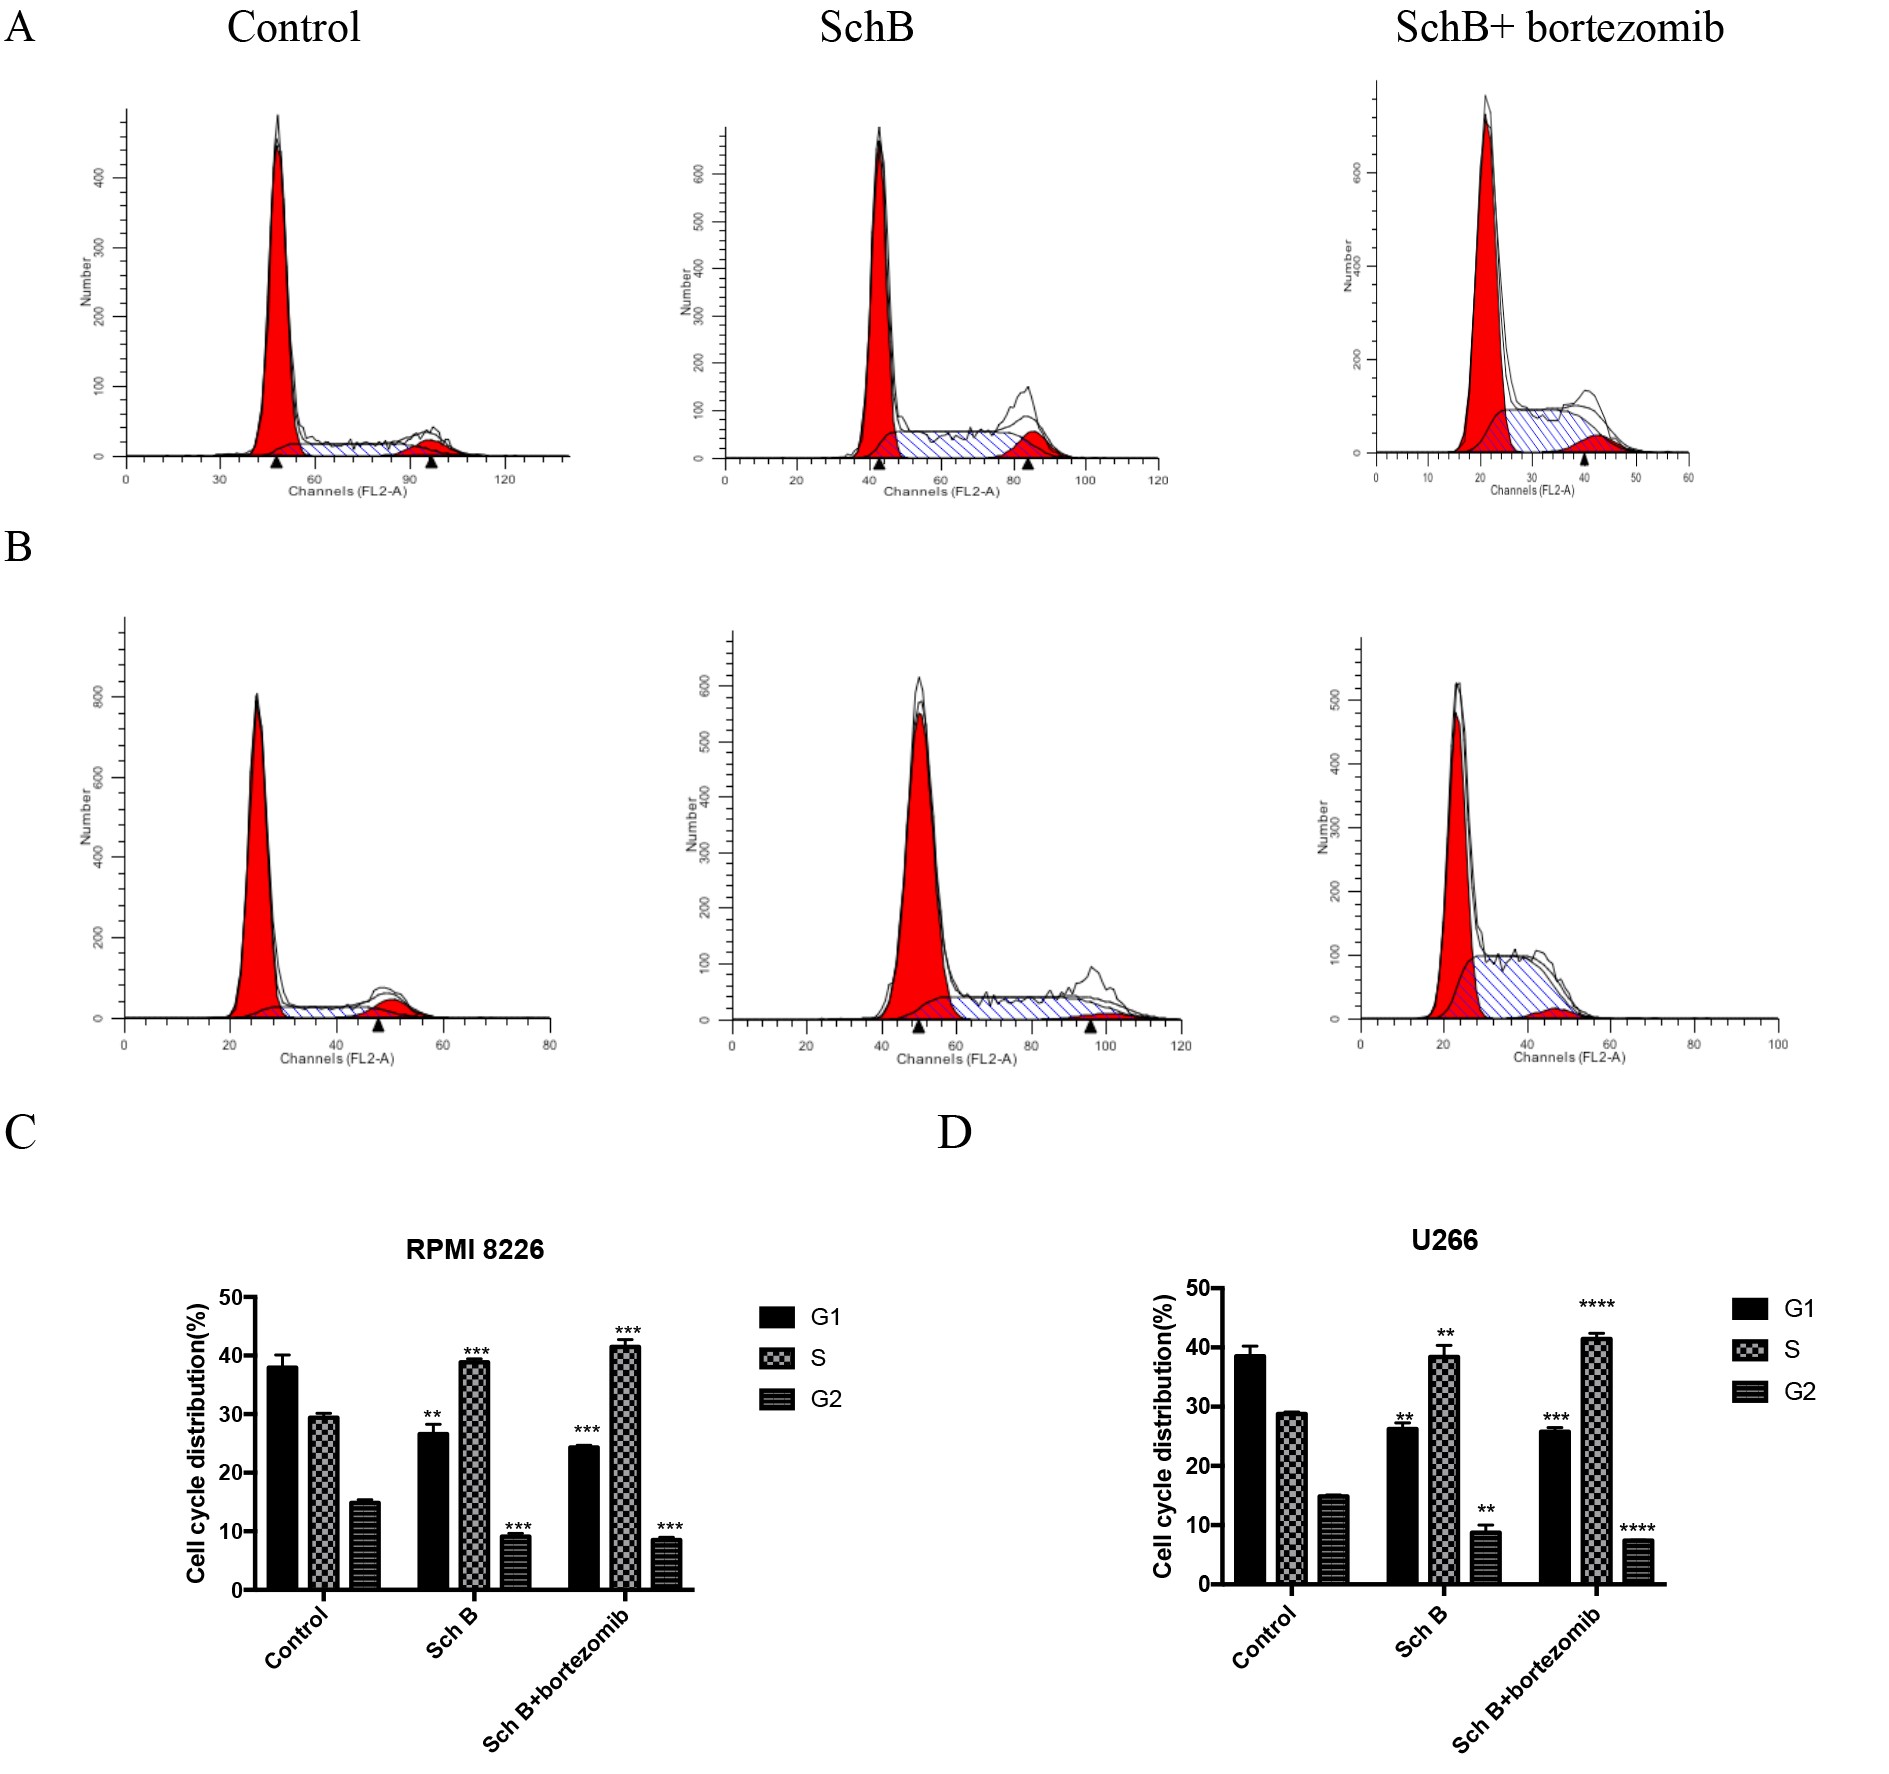
Fig. 2: Sch B induced cells cycle in S phase of MM mice. (A,C) RPMI8226; (B,D) U266; ∗∗𝑃 < 0.01, ∗∗∗𝑃 < 0.001, ∗∗∗∗𝑃 < 0.0001.
Sch B induced the apoptosis of MM mice
The analysis reveals a marked escalation in the apoptosis rate of MM mice subjected to treatment with Sch B or in combination with bortezomib (illustrated in Fig. 3). Notably, the apoptosis rates among MM mice harboring RPMI 8226 cells escalated from 5.32±0.07% to 10.19±0.51% and 17.47±0.7%, respectively. Similarly, for U266 cells, the apoptosis rate rose from a baseline of 3.15±0.22% to 19.47±0.43% and 22.87±0.58% (P <0.0001). These findings unequivocally establish that Sch B is an efficacious agent in augmenting apoptosis within MM mice.
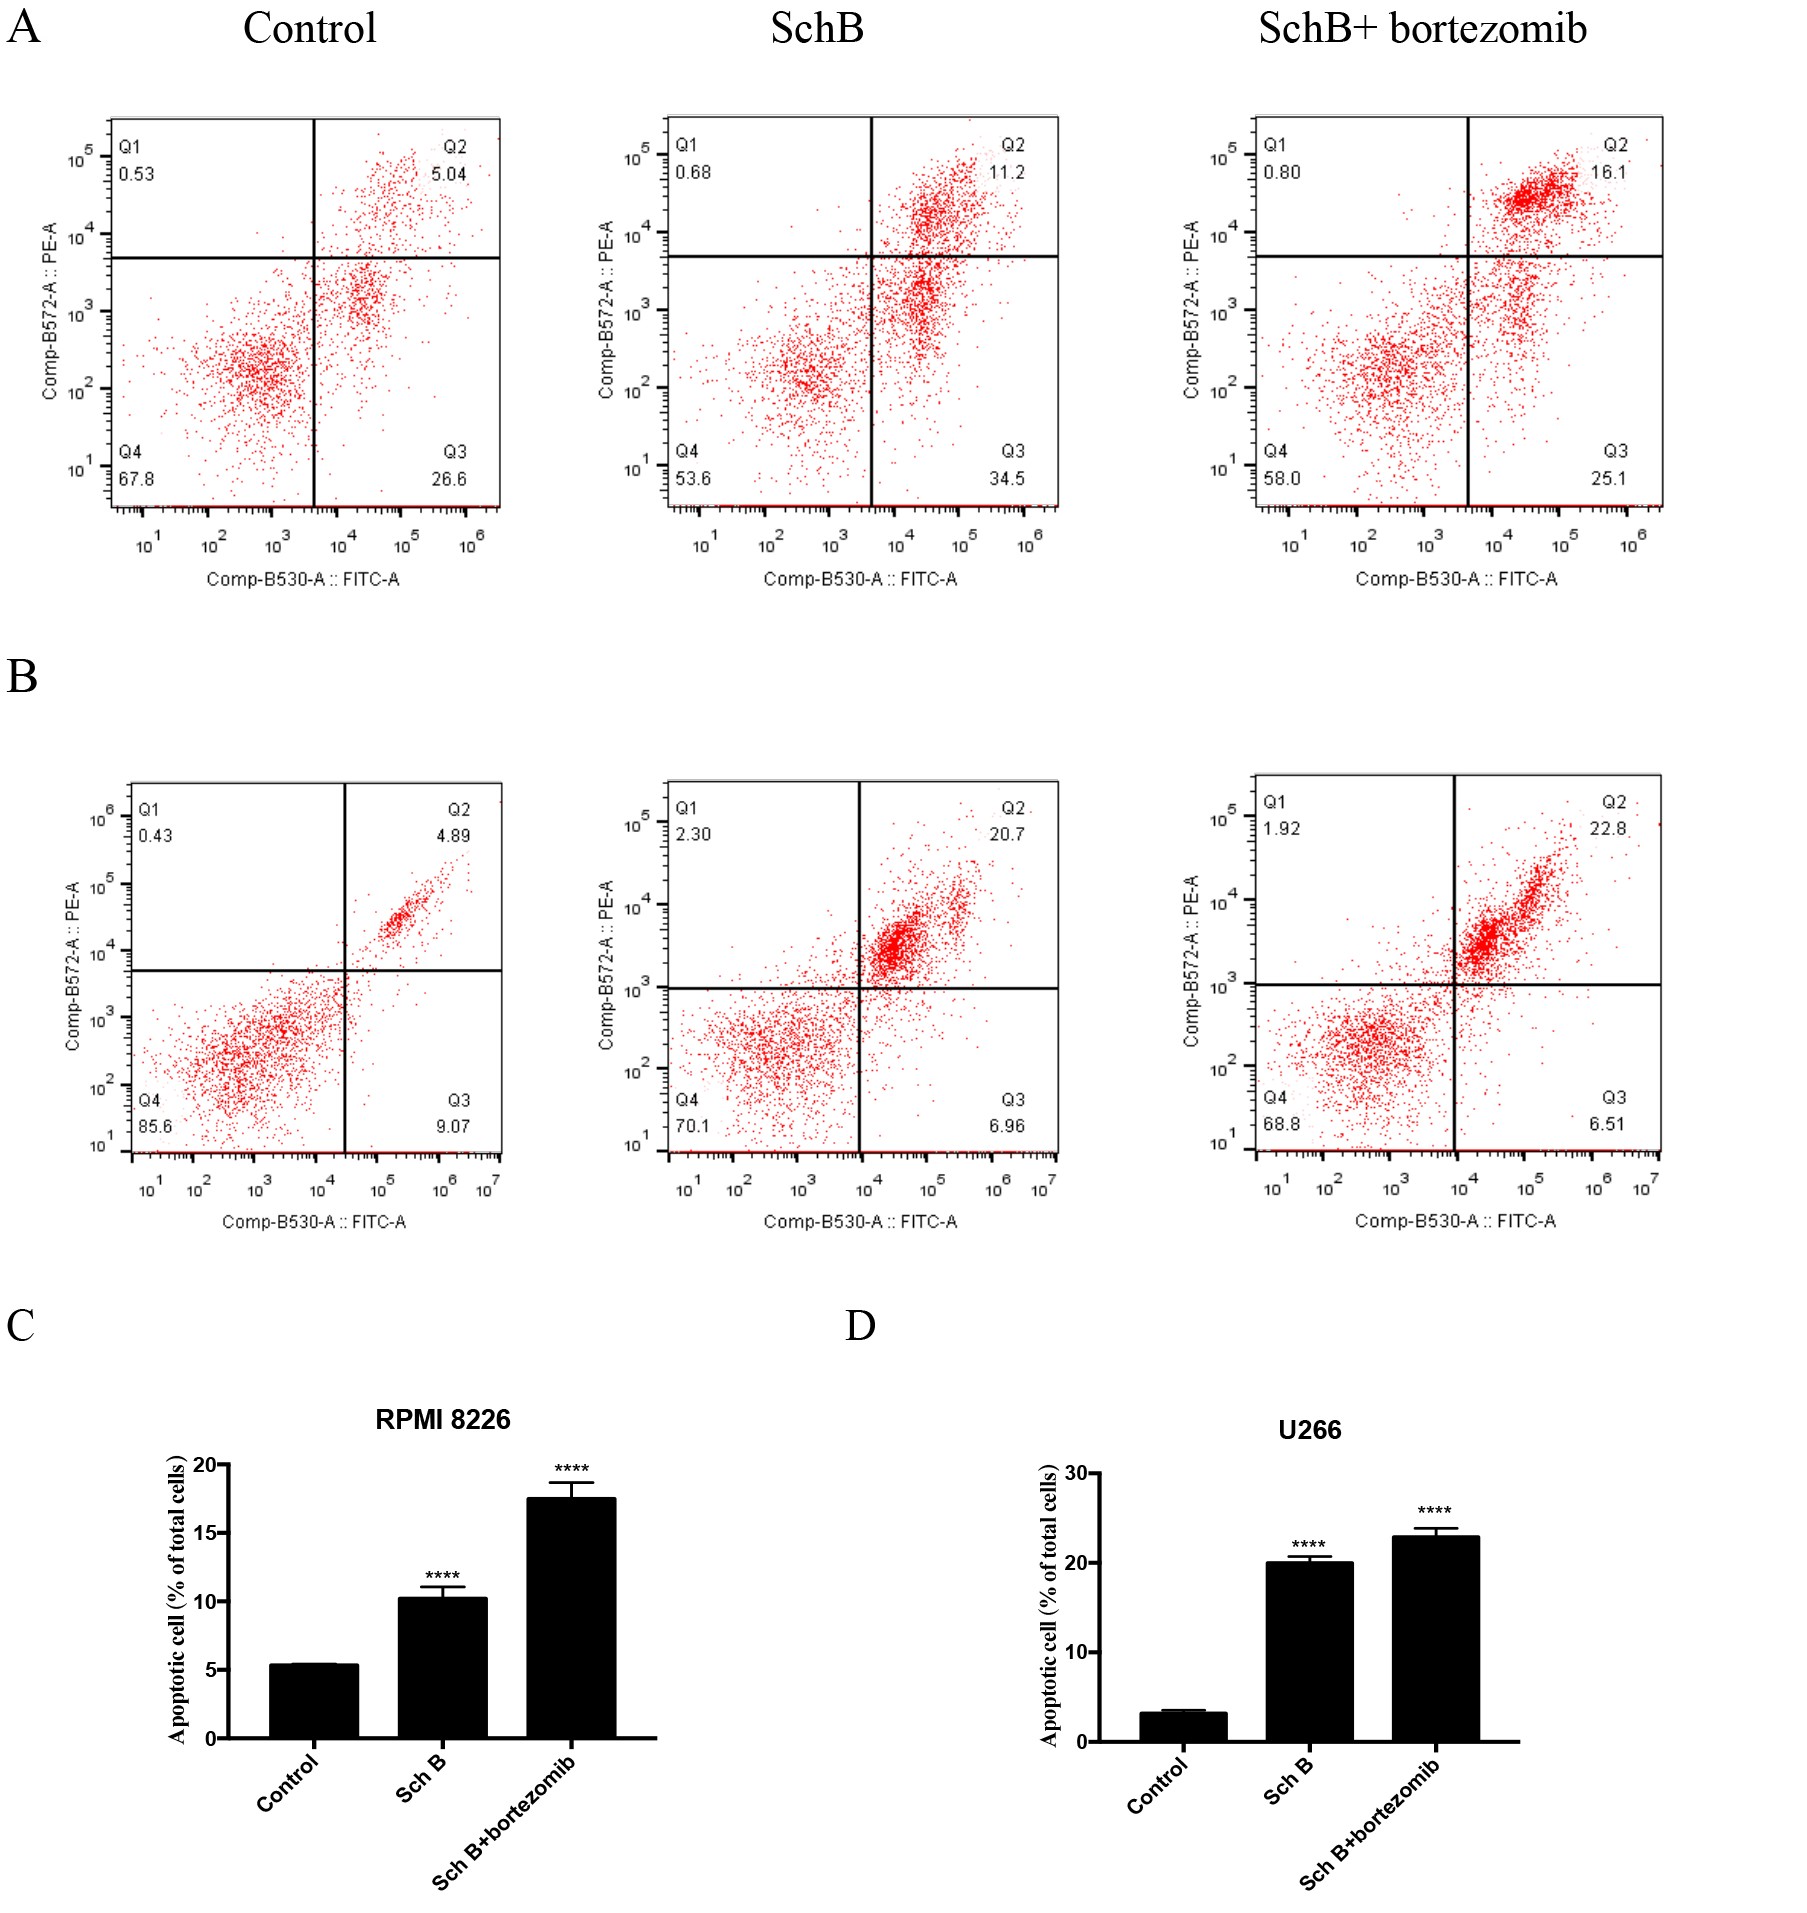
Fig. 3: Sch B induced the apoptosis of MM mice. (A,C) RPMI 8226; (B,D) U266;∗∗∗∗𝑃 < 0.0001.
SchB inhibited the concentrations of IL-6 and VEGF in MM mice
We examined the production of IL-6 and VEGF to assess the impact of Sch B on MM mice. As illustrated in Fig. 4, MM mice harboring RPMI8266 or U266 cells exhibited elevated levels of IL-6 (100.9±3.88, 102.1±4.15) and VEGF (198.9±6.19, 181.4±3.77). However, there were a significant reduction in the concentration of both IL-6 and VEGF when MM mice were treated with Sch B (IL-6: 69.47±1.58, 75.47±1.95; VEGF: 139.7±4.67, 134±3.29) or in combination with bortezomib (IL-6: 64±0.91, 63.97±0.33; VEGF: 118.2±1.62, 117.5±1.32). These findings indicate that Sch B, either alone or in combination with bortezomib, effectively suppressed the production levels of IL-6 and VEGF in MM mice.
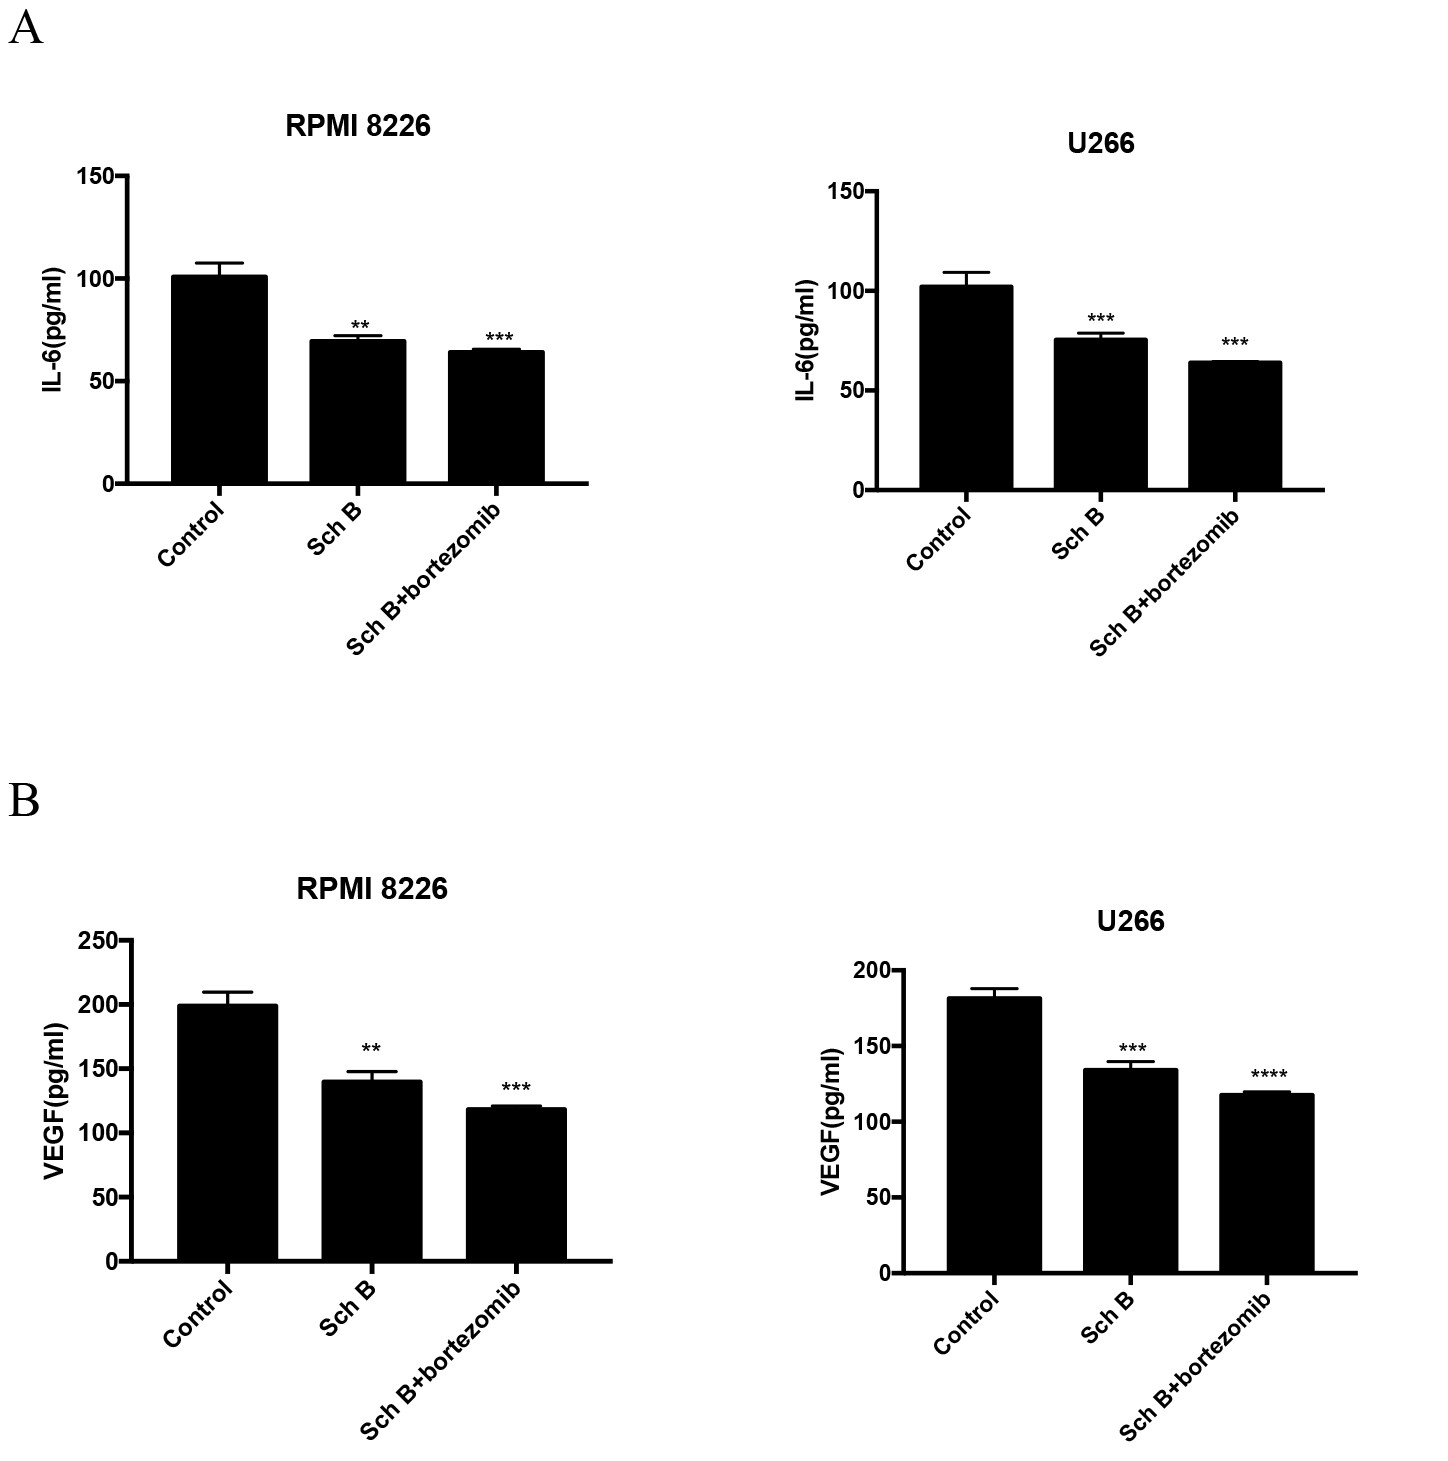
Fig. 4: SchB inhibited the concentrations of IL-6 and VEGF of MM mice. (A)IL-6; (B)VEGF. ∗∗𝑃 < 0.01, ∗∗∗𝑃 < 0.001, ∗∗∗∗𝑃 < 0.0001.
SchB enhanced the ROS levels in MM mice
Observing the administration of Sch B revealed a marked increase in intracellular ROS levels among MM mice models, as quantifiably assessed through advanced immunofluorescence assays. As shown in Fig. 5, mean fluorescent intensity (MFI) of MM mice with RPMI 8226 or U266 cells subjected to Sch B or combined with bortezomib treatment notably rose from 0.43±0.088 to 4.77±0.26 and 5.63±0.087 (P < 0.0001) and from 1.43±0.085 to 8.9 ±0.23 and 11.43±0.4, respectively (P < 0.01). Notably, these results suggested that SchB is a stimulant of ROS levels in MM mice.
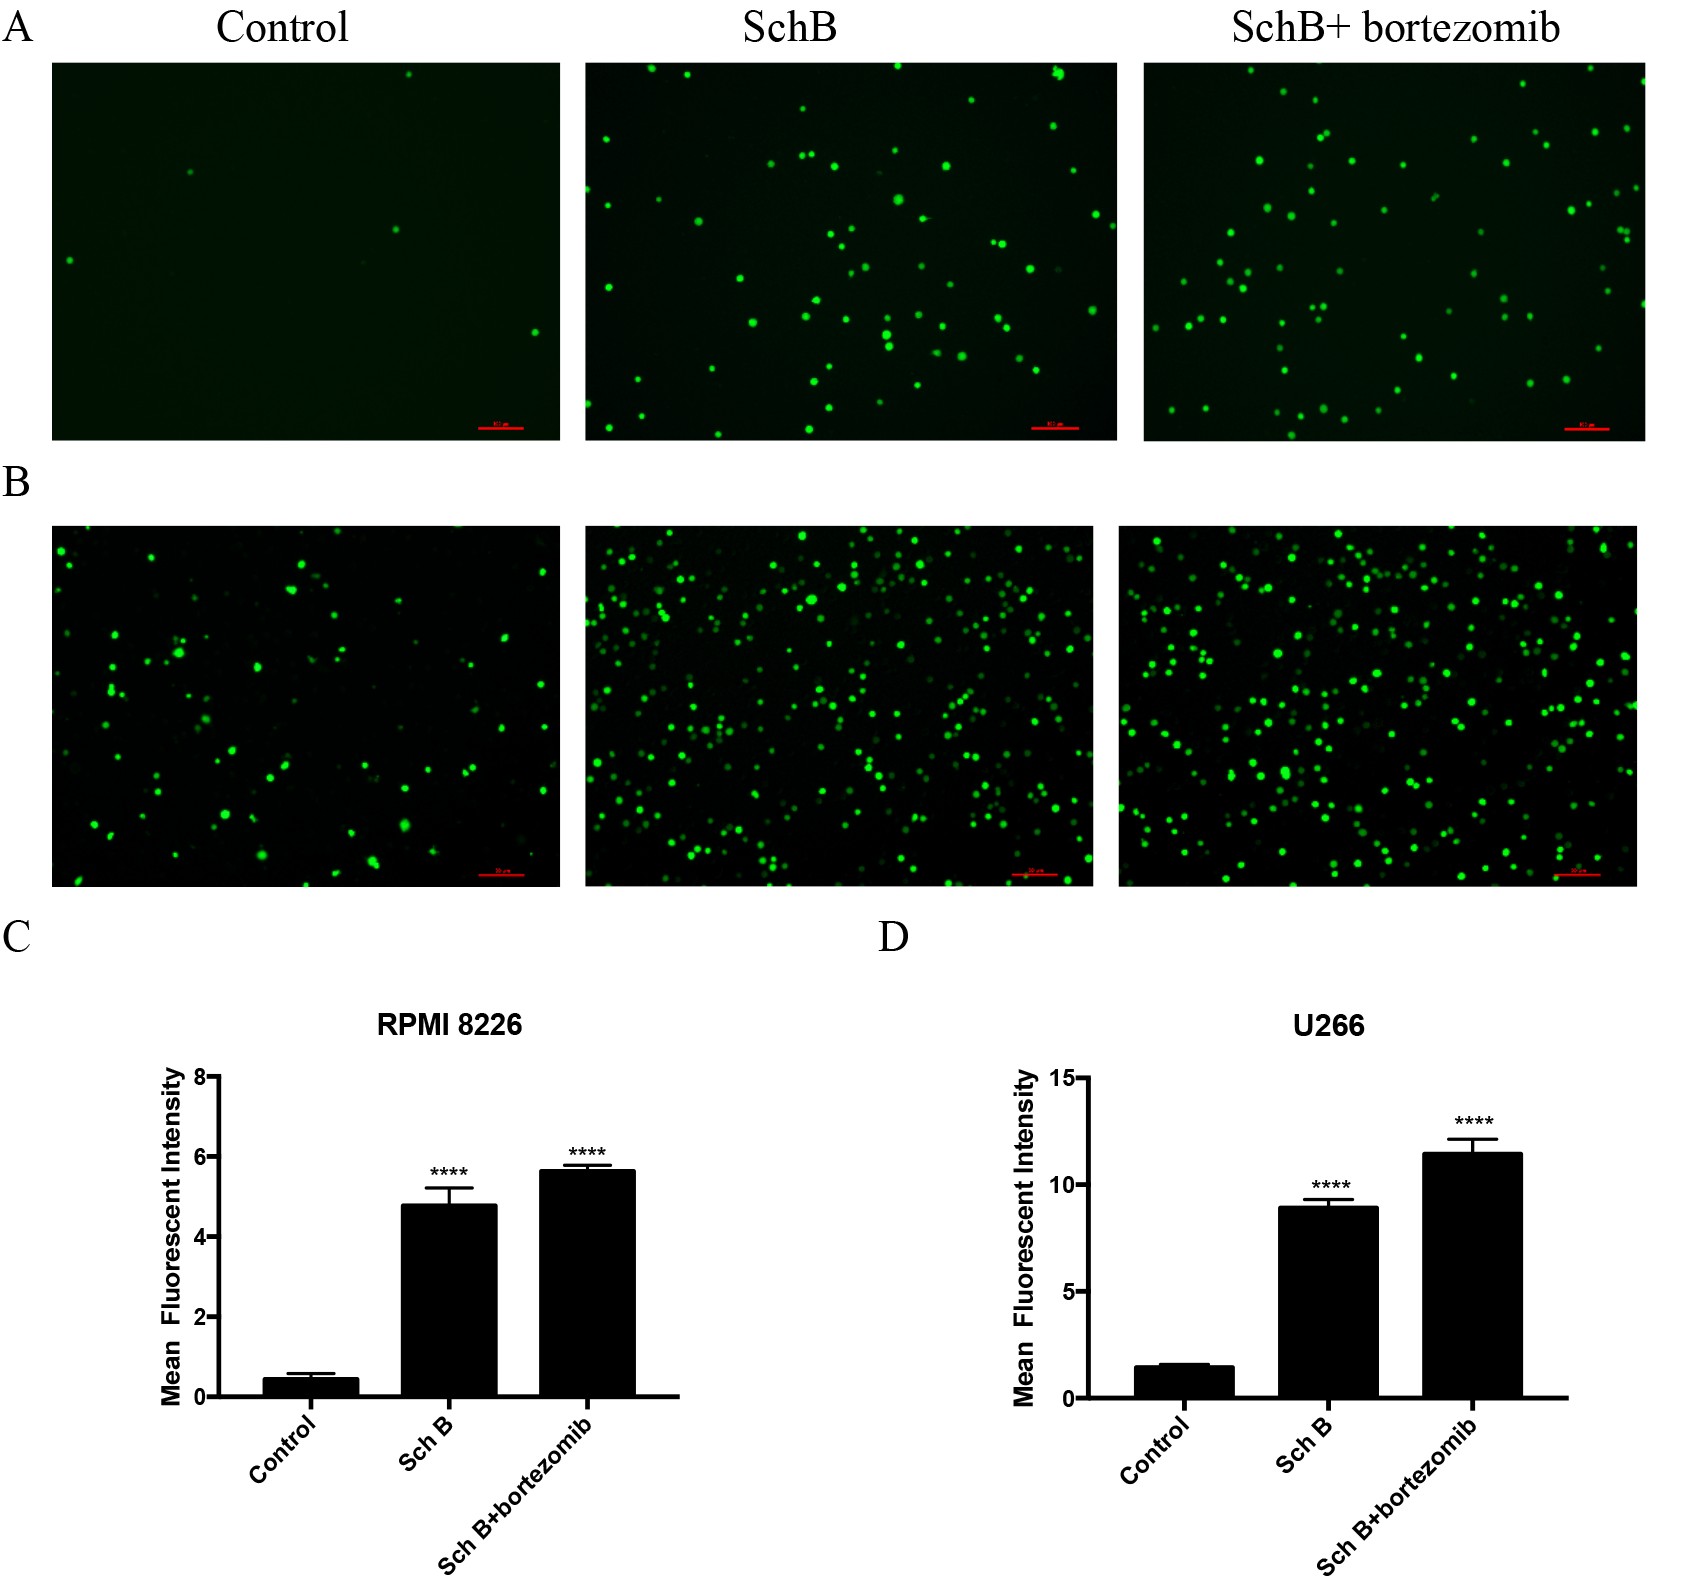
Fig. 5: SchB enhanced the ROS levels in MM mice. (A,C) RPMI 8226;(B,D) U266;∗∗∗∗𝑃 < 0.0001.
Sch B modulated the protein expression of IL-6, JAK2, p-JAK2, STAT3 and p-STAT3 of MM mice
To elucidate the impact of Sch B on MM mice, particularly with respect to IL-6, JAK2, p-JAK2, STAT3, and p-STAT3, western blotting assay was conducted (Fig. 6). In mice bearing RPMI 8226 cells, the control group exhibited the following protein expressions: IL-6 at 0.47±0.013, JAK2 at 0.35±0.018, p-JAK2 at 0.55±0.021, STAT3 at 0.85±0.017, and p-STAT3 at 0.65±0.01. In contrast, the group treated with Sch B showed a reduction in the expression of IL-6 (to 0.27±0.014), p-JAK2 (to 0.37±0.011), and p-STAT3 (to 0.42±0.052). When combined with bortezomib, these protein expressions were further decreased: IL-6 to 0.22±0.015, p-JAK2 to 0.18±0.007, and p-STAT3 to 0.23±0.006. Notably, there were no significant differences observed in the expressions of JAK2 and STAT3 across all three groups.
In the study involving mice with U226 cells, consistent trends were observed across the three experimental groups: the control group (IL-6: 0.56±0.016; JAK2: 0.45±0.022; p-JAK2: 0.57±0.019; STAT3: 0.76±0.005; p-STAT3: 0.68±0.01), the Sch B-treated group (IL-6: 0.37±0.012; JAK2: 0.46±0.023; p-JAK2: 0.38±0.021; STAT3: 0.73±0.009; p-STAT3: 0.36±0.013), and the group treated with a combination of Sch B and bortezomib (IL-6: 0.24±0.042; JAK2: 0.43±0.008; p-JAK2: 0.17±0.018; STAT3: 0.75±0.014; p-STAT3: 0.2±0.01).
These findings collectively indicate that Sch B, when administered either alone or in combination with bortezomib, effectively downregulates the expression of IL-6, p-JAK2, and p-STAT3 in MM mouse models. This observation thus provides additional insight into the molecular mechanisms that underline its potential therapeutic efficacy in the context of this disease.
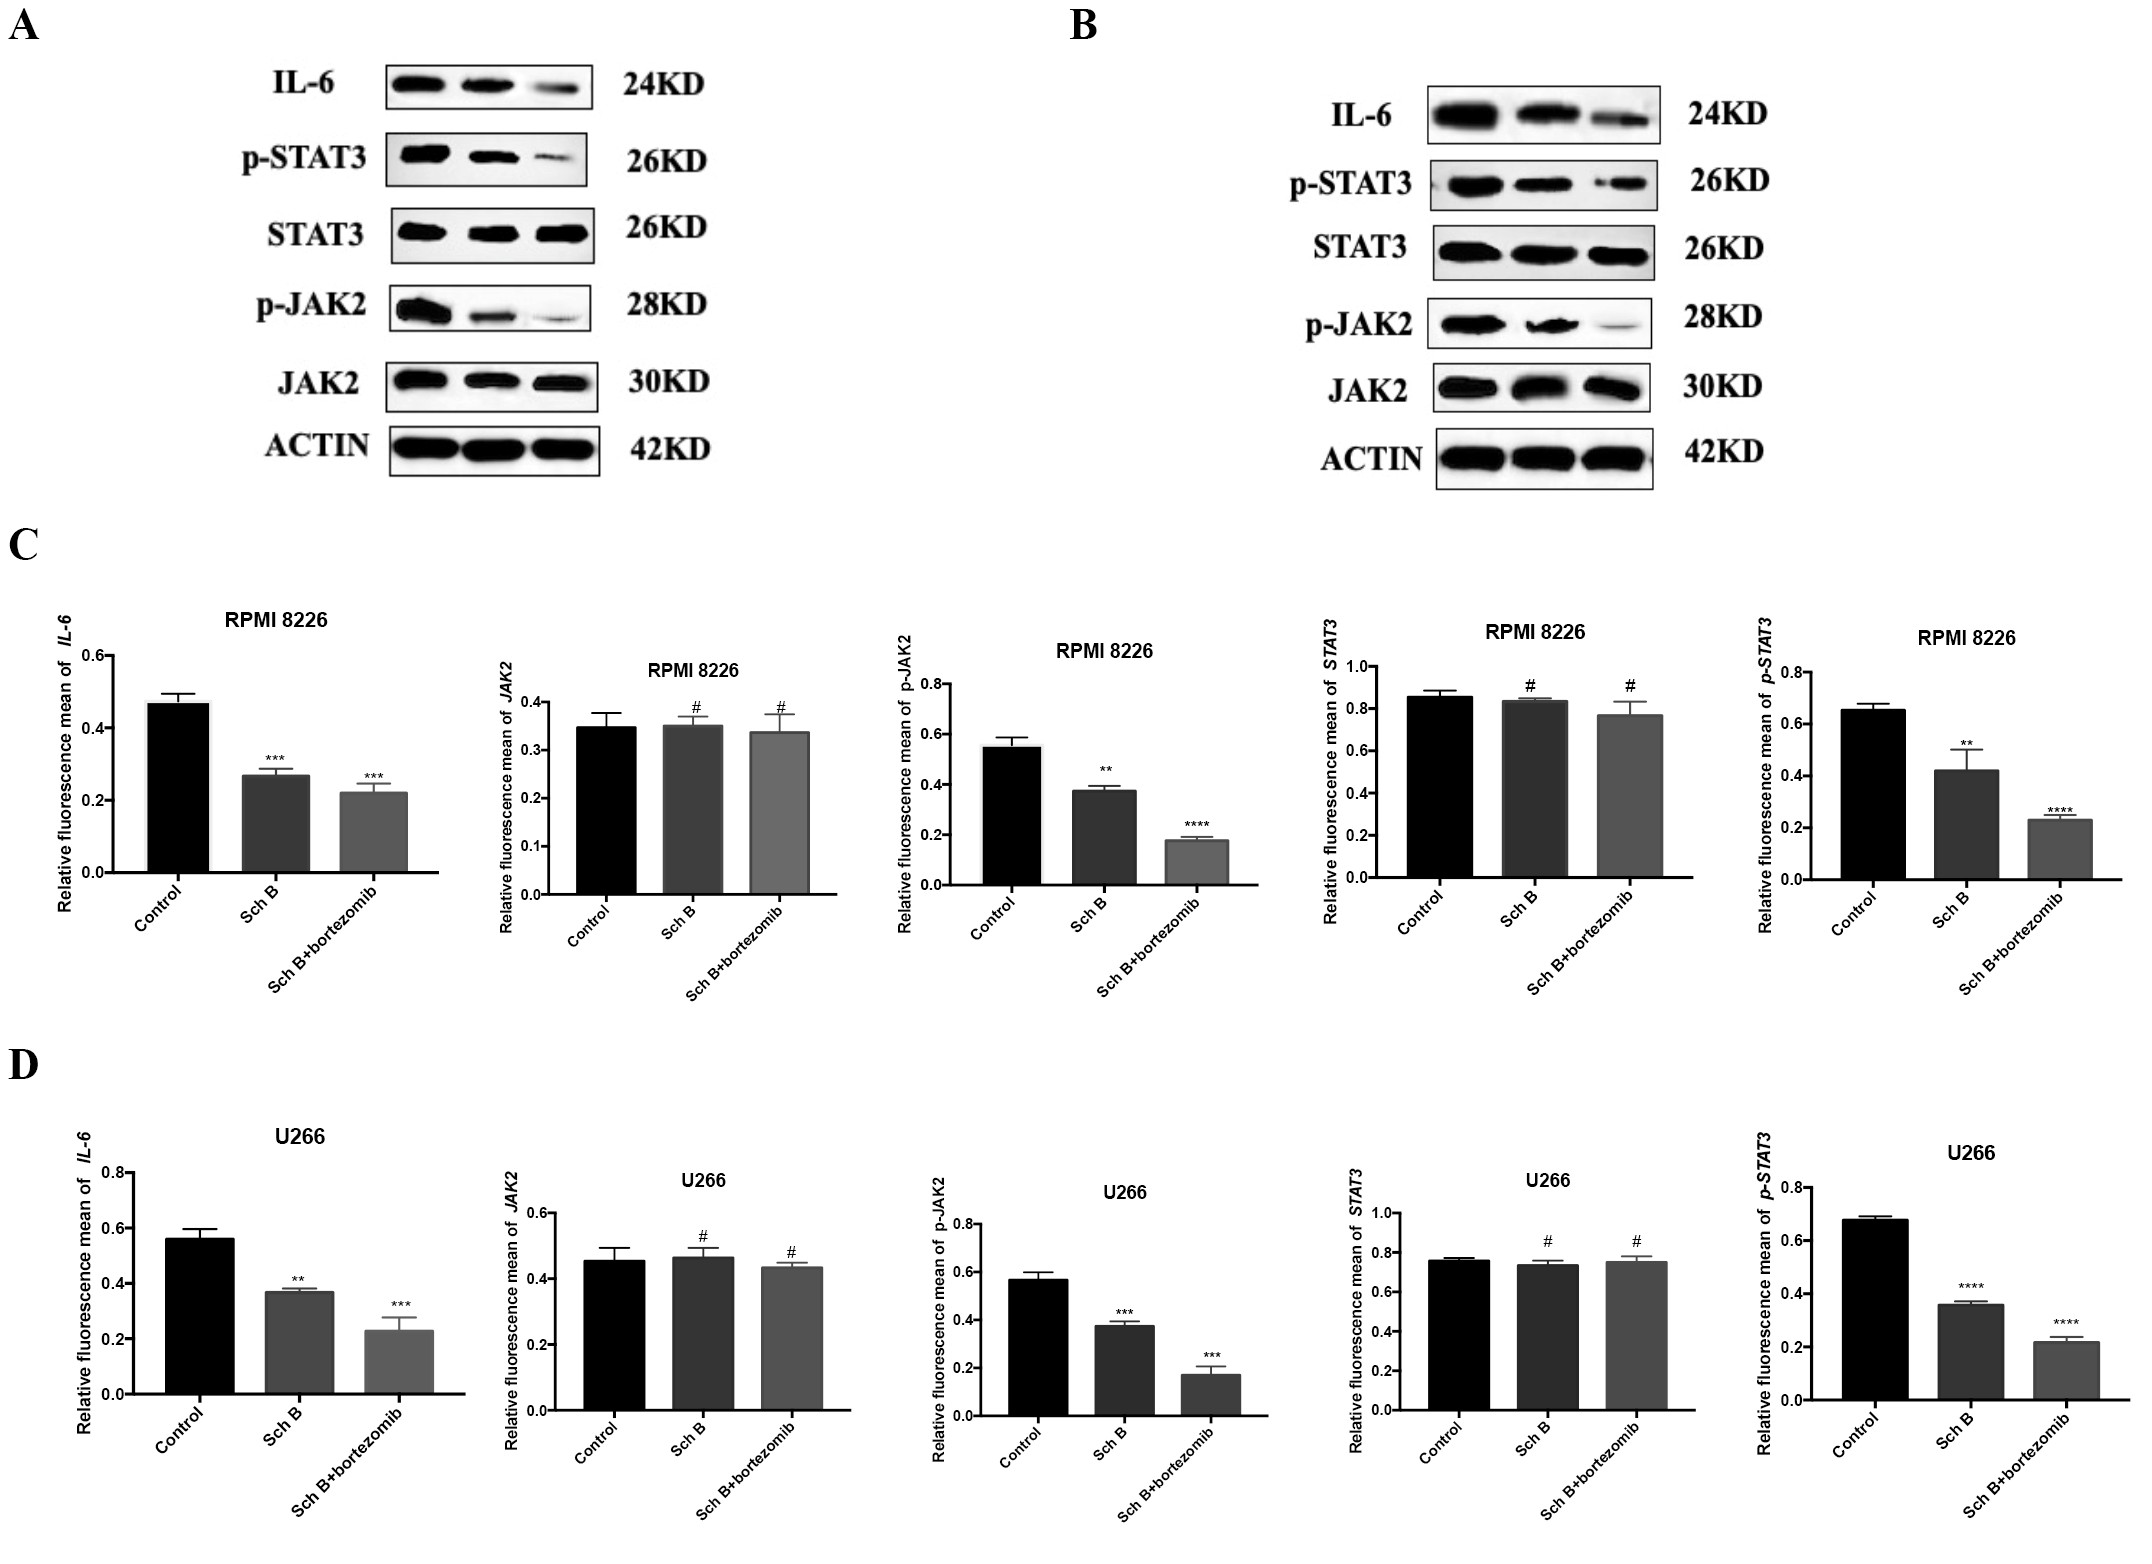
Fig. 6: Sch B modulated the protein expression of IL-6, JAK2, p-JAK2, STAT3 and p-STAT3 of MM mice. (A, C) RPMI 8226;(B,D)U266. # 𝑃 >0.05, ∗𝑃 < 0.05, ∗∗𝑃 < 0.01, ∗∗∗𝑃 < 0.001, ∗∗∗∗𝑃 < 0.0001.
Discussion
The present study stands as the pioneering endeavor in demonstrating that Sch B or in combination with bortezomib exhibits a potent inhibitory effect on the proliferation of transplanted tumors, effectively trapping them in the S phase and triggering apoptosis. Furthermore, Sch B or in combination with bortezomib was observed to diminish the levels of IL-6, VEGF, p-JAK2, and p-STAT3 while concurrently augmenting ROS in mice afflicted with MM. MM is a neoplasm of plasma cells [9]. The exact underlying mechanisms contributing to the pathogenesis of MM remain largely elusive, yet numerous studies have implicated a pivotal role for the tumor microenvironment (TME) [10]and its interplay with cytokines in the initiation and progression of this disease. Schisandra chinensis, a traditional Chinese medicinal herb belonging to the magnoliaceae family [11], boasts a rich array of chemical constituents including lignans, organic acids.Sch B is one member of schisandra chinensis. Most researches pay more attention to Sch B because of its anti-tumorigenic, antioxidant, anti-inflammation and immunomodulatory effects [12-14]. It inhibits the proliferation, induces apoptosis of colon cancer cells [15]and nasopharyngeal carcinoma cell-cycle arresting at G1 phase [16]. In our study, Sch B or in combination with bortezomib effectively inhibited tumor growth, augmented cells apoptosis of MM mice but cell cycle arrested at the S phase which was different from cell cycle in vitro [8]. The survival and proliferation of MM cells are critically dependent on the presence of various cytokines within the bone marrow microenvironment, including IL-6, VEGF, and IL-10. These cytokines foster the proliferation of myeloma cells, promote angiogenesis, and suppress anti-tumor immunity [17]. High IL-6 levels driving anti-apoptotic responses and stimulating the expansion of myeloma clones by inhibiting apoptosis and stimulating growth [18]. VEGF, a pivotal mediator of angiogenesis, has been implicated in the more aggressive variants of MM, and may also modulate the response to novel anti-MM therapies with anti-angiogenic properties [19]. Additionally, the JAK/STAT3 pathway is often constitutively activated in MM [20]. Li reported that matrine increased the levels of ROS in MM cells [21]. Our research findings indicate that Sch B, either administered independently or in conjunction with bortezomib, effectively suppressed the production of IL-6 and VEGF, as well as the expression of IL-6, p-JAK2, and p-STAT3 in MM mouse models. Concurrently, this treatment regimen was observed to significantly enhance the levels of ROS.
Conclusion
In summary, our findings unequivocally establish a previously unreported insight: the potential of Sch B, either alone or in synergistic combination with bortezomib, as a promising therapeutic candidate for the management of MM. This conclusion underscores the compelling efficacy of the proposed treatment strategy in the context of advancing clinical interventions for this disease.
Acknowledgements
Author contributions
M.Wu analyzed data, prepared figures and wrote the manuscript. A.N. Li writed the manuscript, contributed to cell cycle and proliferation. H.C. Sheng cultured cells and prepare figures. Y.Zou feed mice and intraperitoneal injections. T.T. Zhang participated in design and data analysis. Q.Q. Zhu contributed to ROS assay. C.S. Wan conducted Western Blot assay. C.Chen conducted cell proliferation and apoptosis assay
Funding Sources
This work was supported by the Jiangxi Provincial Administration of Traditional Chinese Medicine Science and Technology Plan (Grant No. 2024B0263) and the Science and Technology Research Project of Jiangxi Provincial Department of Education (Grant No. GJJ2403641).
Statement of Ethics
All procedures performed in studies were in accordance with the ethical standards at Jiangxi Provincial People’s Hospital and with the 1964 Helsinki declaration.
Disclosure Statement
The authors declare no conflicts of interest.
References
- Gay F, Marchetti E, Bertuglia G. Multiple Myeloma Unpacked. Hematol Oncol 2025; 43 Suppl 2: e70067. https://doi.org/10.1002/hon.70067
- Yi H, Liang L, Wang H et al. Albendazole inhibits NF-kappaB signaling pathway to overcome tumor stemness and bortezomib resistance in multiple myeloma. Cancer Lett 2021; 520: 307-320. https://doi.org/10.1016/j.canlet.2021.08.009
- Kyle RA, Gertz MA, Witzig TE et al. Review of 1027 patients with newly diagnosed multiple myeloma. Mayo Clin Proc 2003; 78: 21-33. https://doi.org/10.4065/78.1.21
- Tan CJ, Kacerek D, Kampirapawong N et al. Treatment of Multiple Myeloma in Patients Refractory to Daratumumab/Anti-CD38 Monoclonal Antibodies: A Systematic Review. Cancer Med 2025; 14: e70585. https://doi.org/10.1002/cam4.70585
- Gozzetti A, Ciofini S, Simoncelli M et al. Anti CD38 monoclonal antibodies for multiple myeloma treatment. Hum Vaccin Immunother 2022; 18: 2052658. https://doi.org/10.1080/21645515.2022.2052658
- Nasser MI, Zhu S, Chen C et al. A Comprehensive Review on Schisandrin B and Its Biological Properties. Oxid Med Cell Longev 2020; 2020: 2172740. https://doi.org/10.1155/2020/2172740
- Sun J, Wang Z, Yun Y et al. Schisandrin B exerts anti-colorectal cancer effect through CXCL2/ERK/DUSP11 signaling pathway. Cancer Cell Int 2025; 25: 97. https://doi.org/10.1186/s12935-025-03727-9
- Mei Wu,Hongshao Sheng, Bo Ke, Tingting Liu, Chen Chen, ZiXia Zhang, Chunfang Kong. Schisandrin B Suppressed the Proliferation of MM Cell Lines Via IL-6. Cell Cellular Life Sci J 2023; 8: 000189. https://doi.org/10.23880/cclsj-16000189
- Ho M, Paruzzo L, Minehart J et al. Extramedullary Multiple Myeloma: Challenges and Opportunities. Curr Oncol 2025; 32. https://doi.org/10.3390/curroncol32030182
- Chakraborty C, Mukherjee S. Molecular Crosstalk between Chromatin Remodeling and Tumor Microenvironment in Multiple Myeloma. Curr Oncol 2022; 29: 9535-9549. https://doi.org/10.3390/curroncol29120749
- Fang Y, Pan J, Wang P et al. A comprehensive review of Schisandrin B's preclinical antitumor activity and mechanistic insights from network pharmacology. Front Pharmacol 2025; 16: 1528533. https://doi.org/10.3389/fphar.2025.1528533
- Qi L, Yu HQ, Li YQ et al. Schidandrin B kills tumor cells by initiating apoptosis in glioma SHG-44 cells. Chin J Integr Med 2016. https://doi.org/10.1007/s11655-015-2406-9
- Ma Z, Xu G, Shen Y et al. Schisandrin B-mediated TH17 cell differentiation attenuates bowel inflammation. Pharmacol Res 2021; 166: 105459. https://doi.org/10.1016/j.phrs.2021.105459
- Tan S, Zheng Z, Liu T et al. Schisandrin B Induced ROS-Mediated Autophagy and Th1/Th2 Imbalance via Selenoproteins in Hepa1-6 Cells. Front Immunol 2022; 13: 857069. https://doi.org/10.3389/fimmu.2022.857069
- Co VA, El-Nezami H, Liu Y et al. Schisandrin B Suppresses Colon Cancer Growth by Inducing Cell Cycle Arrest and Apoptosis: Molecular Mechanism and Therapeutic Potential. ACS Pharmacol Transl Sci 2024;7:863-877. https://doi.org/10.1021/acsptsci.4c00009
- Fang Y, Lv X, Li G et al. Schisandrin B targets CDK4/6 to suppress proliferation and enhance radiosensitivity in nasopharyngeal carcinoma by inducing cell cycle arrest. Sci Rep 2025;15:8452. https://doi.org/10.1038/s41598-025-92992-9
- Yue X, Huang L, Yang Y et al. High levels of serum IL-10 indicate disease progression, extramedullary involvement, and poor prognosis in multiple myeloma. J Zhejiang Univ Sci B 2022;23:968-974. https://doi.org/10.1631/jzus.B2200277
- Gu J, Huang X, Zhang Y et al. Cytokine profiles in patients with newly diagnosed multiple myeloma: Survival is associated with IL-6 and IL-17A levels. Cytokine 2021; 138: 155358. https://doi.org/10.1016/j.cyto.2020.155358
- Mielnik M, Podgajna-Mielnik M, Szudy-Szczyrek A et al. Predicting chemotherapy toxicity in multiple myeloma: the prognostic value of pre-treatment serum cytokine levels of interleukin-6, interleukin-8, monocyte chemoattractant protein-1, and vascular endothelial growth factor. Front Immunol 2024; 15: 1377546. https://doi.org/10.3389/fimmu.2024.1377546
- Beldi-Ferchiou A, Skouri N, Ben Ali C et al. Abnormal repression of SHP-1, SHP-2 and SOCS-1 transcription sustains the activation of the JAK/STAT3 pathway and the progression of the disease in multiple myeloma. PLoS One 2017; 12: e0174835. https://doi.org/10.1371/journal.pone.0174835
- Li X, Zhou J, Ling Y et al. Matrine induces autophagic cell death by triggering ROS/AMPK/mTOR axis and apoptosis in multiple myeloma. Biomed Pharmacother 2024; 175: 116738. https://doi.org/10.1016/j.biopha.2024.116738