Original Article – DOI: 10.33594/000000892
CPB (60): 592 - 610
Accepted: 24.09.2026 - Published: 30.09.2026
Diagnostic Performance of the Neutrophil-to-Lymphocyte Ratio for the Identification of Insulin Resistance in Patients with Fibrotic Chronic Hepatitis C: a Case–Control Study
bKadhimiya Teaching Hospital, Baghdad, Iraq,
cDepartment of Radiology, College of Health and Medical Technology, University of Hilla, Babylon, Iraq,
dDepartment of Medical Laboratory Techniques, College of Health and Medical Technology, Al-Farabi University, Baghdad, Iraq,
eBiotechnology Research Center, Al-Nahrain University, Baghdad, Iraq
Keywords
Abstract
Background/Aims: Chronic hepatitis C virus (HCV) infection is accompanied by persistent hepatic inflammation, progressive fibrogenesis and metabolic disturbance, of which insulin resistance (IR) is the most consistently reported. The neutrophil-to-lymphocyte ratio (NLR), derived from a routine complete blood count, has been proposed as an inexpensive index of systemic inflammatory activity, but its diagnostic accuracy for IR in fibrotic chronic hepatitis C has not been quantified in Iraqi patients. To quantify the cross-sectional diagnostic performance of NLR for the identification of insulin resistance in patients with fibrotic chronic hepatitis C, and to characterise its associations with metabolic, inflammatory and hepatic biochemical parameters. Methods: A case–control study was conducted at the Baghdad Hospital for Gastroenterology and Hepatology, Medical City, Baghdad, Iraq, between December 2021 and January 2022. One hundred and fifty participants were enrolled consecutively until each of three groups reached its a priori target of 50: patients with fibrotic chronic hepatitis C and insulin resistance (CHC+IR), patients with fibrotic chronic hepatitis C without insulin resistance (CHC−IR), and apparently healthy controls. Insulin resistance was defined a priori as a Homeostatic Model Assessment for Insulin Resistance (HOMA-IR) value ≥ 2.6. Hepatic fibrosis was recorded as present or absent from clinical, ultrasonographic and available histological records; stage-level fibrosis data were not available. Complete blood count, liver function tests including alanine aminotransferase (ALT) and aspartate aminotransferase (AST), fasting glucose, fasting insulin, C-reactive protein (CRP), interleukin-6 (IL-6) and tumour necrosis factor-alpha (TNF-α) were measured. Groups were compared by Welch analysis of variance with Games–Howell post hoc tests. Diagnostic performance was assessed by receiver operating characteristic (ROC) analysis with DeLong confidence intervals and Youden-optimal cut-offs; associations were quantified by Pearson and Spearman correlation with 95 % confidence intervals, and independence was examined by multivariable linear regression and by Firth penalised logistic regression. A sensitivity analysis in which the HOMA-IR threshold of 2.6 was applied strictly, so that a single clinically allocated patient with a recalculated value of 2.59 was reassigned, was performed for all principal outcomes. Results: The three groups were comparable for age (p = 0.075) and sex (p = 0.593). NLR increased stepwise across controls, CHC−IR and CHC+IR (1.79 ± 0.02, 1.95 ± 0.13 and 2.53 ± 0.15, respectively; Welch F = 625.5, p < 0.001; all pairwise comparisons p < 0.001). Within the chronic hepatitis C cohort (n = 100), NLR separated insulin-resistant from non-insulin-resistant patients completely, giving an area under the curve (AUC) of 1.000 at an exploratory, cohort-derived Youden-optimal cut-off of 2.24, with sensitivity and specificity of 100 % (95 % CI 92.9–100 % for each). NLR discriminated fibrotic chronic hepatitis C from healthy controls with an AUC of 0.942 (95 % CI 0.885–0.972) at a cut-off of 1.85 (sensitivity 90.0 %, specificity 100 %), whereas the AST/ALT ratio was uninformative (AUC 0.528, p = 0.583). NLR correlated strongly with HOMA-IR (r = 0.898, 95 % CI 0.852–0.930), fasting insulin (r = 0.903), CRP (r = 0.913), TNF-α (r = 0.906) and IL-6 (r = 0.798) (all p < 0.001). NLR remained independently associated with HOMA-IR after adjustment for age and sex (B = 2.31, 95 % CI 2.08–2.54, p < 0.001) and after further adjustment for hepatic biochemical markers (B = 1.55, 95 % CI 1.16–1.94, p < 0.001). Under strict application of the HOMA-IR threshold, which reassigned that patient and gave strata of 49 and 51 patients, the AUC for NLR was 0.9994 (95 % CI 0.9932–0.9999), the Youden-optimal threshold was recovered unchanged at 2.24, sensitivity remained 100 % and specificity fell to 98.0 % (95 % CI 89.7–99.7 %), and the regression estimates were essentially unaltered (B = 2.31, 95 % CI 2.08–2.54; odds ratio 12.04 per 0.1-unit increment in NLR); the direction, magnitude and statistical significance of every principal result were unchanged. Conclusion: In this cohort, NLR was strongly and independently associated with insulin resistance and discriminated insulin-resistant from non-insulin-resistant patients with fibrotic chronic hepatitis C with high accuracy. Because the groups were completely separated on NLR and the threshold was derived in the same sample, the cut-off of 2.24 is an exploratory, cohort-derived threshold rather than an established clinical cut-off, and the accuracy estimates are optimistic and require independent external validation. As all patients had fibrosis and no fibrosis staging was available, the present data support a diagnostic association with the presence of disease rather than prediction of fibrosis severity.
Introduction
Chronic hepatitis C virus (HCV) infection remains a major global public health burden despite the availability of highly effective direct-acting antiviral agents. Persistent viral replication maintains hepatic inflammation and progressive loss of functional liver tissue, which culminates in fibrosis, cirrhosis and hepatocellular carcinoma [1]. Fibrogenesis in this setting is driven principally by sustained inflammatory signalling and hepatic stellate cell activation, with consequent excessive deposition of extracellular matrix and distortion of the hepatic architecture [2]. Chronic HCV infection is increasingly recognised as a systemic inflammatory and metabolic disorder rather than a disease confined to the liver. Clinical and experimental studies have consistently linked HCV infection to insulin resistance (IR), which in turn increases the risk of type 2 diabetes mellitus and accelerates fibrosis progression [3]. Viral proteins and inflammatory mediators interfere with insulin receptor signalling through oxidative stress and the release of pro-inflammatory cytokines, in particular interleukin-6 (IL-6) and tumour necrosis factor-alpha (TNF-α), which are regarded as important effectors of both chronic inflammatory activity and metabolic derangement in HCV infection [4]. Liver biopsy remains the reference standard for the assessment of hepatic fibrosis, but it is invasive and costly, and is limited by sampling variability, inter-observer disagreement and patient discomfort [5]. Consequently, attention has turned to non-invasive biomarkers capable of providing reliable information on hepatic inflammation, fibrosis burden and metabolic disturbance in chronic liver disease [6]. The neutrophil-to-lymphocyte ratio (NLR), computed from routine complete blood count parameters, has attracted interest as an index of systemic inflammation across inflammatory, infectious and neoplastic conditions [7]. An elevated NLR reflects an imbalance between neutrophil-mediated innate inflammatory activity and lymphocyte-mediated immune regulation; in chronic liver disease, higher values have been associated with advanced fibrosis and cirrhosis [8] and with increased all-cause mortality in patients with cirrhosis [9]. In chronic hepatitis C specifically, Abdel-Razik et al. reported a higher NLR in patients with HOMA-IR above 3 than in those without insulin resistance, positive correlations of NLR with HOMA-IR, CRP, TNF-α and IL-6, and a higher NLR in advanced than in early fibrosis [10]. Other studies, however, found NLR unrelated to insulin resistance and to fibrosis assessed by transient elastography [11], or to histological fibrosis severity [12]. The evidence linking NLR to insulin resistance in fibrotic chronic hepatitis C is therefore limited and inconsistent, and we are not aware of any study that has examined this relationship in Iraqi patients. The present study was therefore designed to quantify the cross-sectional diagnostic performance of NLR for the identification of insulin resistance in patients with fibrotic chronic hepatitis C, to characterise the associations of NLR with metabolic, inflammatory and hepatic biochemical parameters, and to determine whether any such association persists after adjustment for potential confounding variables. Because the design is cross-sectional, the analysis addresses diagnostic discrimination at a single time point and does not evaluate longitudinal prediction. Any threshold identified in these data is, by construction, derived in the same sample in which it is evaluated, and is therefore presented throughout as an exploratory value requiring independent validation.
Materials and Methods
Study design and setting
This observational case–control study was conducted at the Baghdad Hospital for Gastroenterology and Hepatology, Medical City, Baghdad, Iraq, between December 2021 and January 2022. All laboratory measurements were obtained from a single fasting venous sample per participant, and no follow-up visits were undertaken. Reporting was guided by the STARD 2015 recommendations for diagnostic accuracy studies [13] and the STROBE statement for observational research [14].
Participants and group definitions
The sample size was determined a priori using G*Power [15]. For the primary three-group comparison, 50 participants per group (N = 150) provide a power of 0.80 at a two-sided α of 0.05 to detect an effect size of f = 0.26 by one-way analysis of variance, corresponding to a medium effect. Eligible patients attending the hepatology clinics and eligible apparently healthy volunteers were enrolled consecutively until each of the three groups reached this target of 50 participants, after which enrolment to that group ceased. The first group (CHC+IR, n = 50) comprised patients with chronic hepatitis C infection, documented hepatic fibrosis and insulin resistance. The second group (CHC−IR, n = 50) comprised patients with chronic hepatitis C infection and documented hepatic fibrosis but without insulin resistance. The third group (control, n = 50) comprised apparently healthy, HCV-negative volunteers of comparable age and sex distribution recruited from the same catchment population. The diagnosis of chronic hepatitis C was established by the attending hepatologists on the basis of persistent anti-HCV seropositivity with detectable HCV RNA for more than six months, supported by clinical, laboratory and imaging assessment. Group allocation was determined before any of the analyses reported here were performed.
Inclusion and exclusion criteria
Adult patients with an established diagnosis of chronic hepatitis C were eligible. To limit confounding of inflammatory and metabolic parameters, participants were excluded if they had concurrent viral hepatitis other than HCV, autoimmune disease, acute or chronic bacterial infection, malignancy, diabetes mellitus not attributable to HCV infection, or any other chronic systemic illness. Healthy controls were required to be free of these conditions and to be HCV seronegative.
Definition and assessment of hepatic fibrosis
Hepatic fibrosis was recorded as a binary variable (present or absent). No uniform protocol-defined threshold or staging system was applied: fibrosis status was taken from the pre-existing clinical diagnosis recorded by the treating hepatologist on the basis of the available clinical, biochemical and ultrasonographic information and, where available, histological reports already present in the hospital file. Neither transient elastography nor prospective protocol-driven liver biopsy was performed for the purposes of this study, and stage-level fibrosis scores (METAVIR or equivalent) were not uniformly recorded and could therefore not be retrieved. As a consequence, all 100 patients with chronic hepatitis C were classified as having fibrosis and all 50 controls as not having fibrosis, so that fibrosis status and HCV status were completely collinear in this dataset. Analyses involving fibrosis are accordingly presented as discrimination between fibrotic chronic hepatitis C and healthy controls, and no analysis of NLR across increasing fibrosis severity was possible. This constraint is emphasised again in the interpretation of the results and in the limitations.
Definition and assessment of insulin resistance
Insulin resistance was quantified using the Homeostatic Model Assessment for Insulin Resistance (HOMA-IR), calculated as fasting insulin (μIU/mL) multiplied by fasting plasma glucose (mmol/L) and divided by 22.5 [16]. Insulin resistance was defined a priori as HOMA-IR ≥ 2.6, the threshold in routine clinical use at the recruiting centre. Because published HOMA-IR thresholds vary between populations and studies, this value is not presented as a broadly established cut-off, and the effect of applying it strictly was examined in the sensitivity analysis described in Section 2.11. Group allocation was made clinically at recruitment and was not revised in the light of the analytical dataset. Recalculation of HOMA-IR from the recorded fasting insulin and glucose values reproduced the clinical allocation in 149 of the 150 participants (99.3 %). One patient allocated clinically to the CHC+IR group had a recalculated HOMA-IR of 2.59, marginally below the threshold. That patient was retained in the originally assigned group for the primary analysis, so that group membership was not redefined post hoc, and the consequences of applying the threshold strictly were examined in the pre-specified sensitivity analysis described in Section 2.11. No participant allocated to either non-insulin-resistant group reached the threshold.
Ethical approval and informed consent
The study was conducted in accordance with the ethical principles of the Declaration of Helsinki. The study protocol and the accompanying participant consent documentation were reviewed and approved before the commencement of enrolment by the Ethics Committee of the Institute of Genetic Engineering and Biotechnology for Postgraduate Studies, University of Baghdad, Baghdad, Iraq (reference ETH/255/MOH26, issued 15 October 2021). The approval letter records that the committee reviewed the proposal description and the consent form, approved the research to be conducted in the form presented, and required that the committee be informed of the progress of the study, of any serious adverse event, and of any subsequent amendment to the protocol or to the participant information and consent documentation. A copy of the approval letter has been provided to the Editorial Office. Consent was obtained from every participant before enrolment and sample collection, in the form specified in the approved protocol. Because the study involved no intervention beyond a single venous blood sample obtained during routine clinical care and carried no more than minimal risk, consent was administered verbally by a member of the clinical team using a standardised information script derived from the approved consent documentation, and was recorded by the consenting clinician in the participant’s study record, which was countersigned and dated at the time of enrolment. Participation was voluntary, no direct or indirect personal identifiers were retained in the analytical dataset, and participants were free to withdraw at any time without any effect on their clinical care.
Sample collection
After an overnight fast of at least eight hours, approximately 5 mL of venous blood was drawn from each participant under aseptic conditions. Blood was distributed into a dipotassium ethylenediaminetetraacetic acid tube for haematological analysis and into a plain gel separator tube for biochemical and immunological analysis. Serum was obtained by centrifugation at 3000 rpm for 10 minutes, aliquoted and stored at −20 °C until analysis. Haematological analysis was performed within two hours of collection.
Haematological and biochemical analysis
Absolute neutrophil and lymphocyte counts were obtained by automated complete blood count analysis on a Sysmex XN-350 haematology analyser (Sysmex Corporation, Kobe, Japan). The neutrophil-to-lymphocyte ratio was calculated as the absolute neutrophil count divided by the absolute lymphocyte count, both expressed as ×10⁹/L. Serum alanine aminotransferase (ALT), aspartate aminotransferase (AST), gamma-glutamyl transferase (GGT), alkaline phosphatase (ALP), total bilirubin, total protein and fasting plasma glucose were measured on a cobas c 311 clinical chemistry analyser (Roche Diagnostics, Mannheim, Germany) according to the manufacturer’s instructions, and the AST/ALT ratio was derived arithmetically. Fasting insulin was measured by electrochemiluminescence immunoassay on a cobas e 411 analyser (Roche Diagnostics, Mannheim, Germany). Internal quality control material at two concentrations was analysed in each run, and all measurements were performed by operators blinded to group allocation.
Measurement of inflammatory biomarkers
Serum C-reactive protein was measured by particle-enhanced immunoturbidimetric assay on the cobas c 311 analyser (Roche Diagnostics, Mannheim, Germany). Serum interleukin-6 and tumour necrosis factor-alpha concentrations were quantified by quantitative sandwich enzyme-linked immunosorbent assay kits (SunLong Biotech Co., Ltd., Hangzhou, China) according to the manufacturer’s instructions. The manufacturer-stated assay range and sensitivity are 2–80 pg/mL and 0.5 pg/mL for the IL-6 kit (catalogue no. SL1001Hu), and 6–300 pg/mL and 2.2 pg/mL for the TNF-α kit (catalogue no. SL1761Hu). In both assays, horseradish peroxidase-conjugated detection antibody and tetramethylbenzidine substrate were used, absorbance was read at 450 nm, and concentrations were interpolated from the standard curve run on each plate. All samples were assayed in duplicate on a single reagent lot for each analyte, and the mean of the duplicates was used in the analysis. One TNF-α value (5.78 pg/mL, control group) lay marginally below the lower limit of the stated assay range but above the kit sensitivity, and one IL-6 value (80.92 pg/mL) lay marginally above the upper limit of the stated range but below the highest calibrator (90 pg/mL); both were retained as measured.
Statistical analysis
All analyses were performed on the complete dataset of 150 participants; there were no missing values for any variable, and no imputation was required. The distribution of each continuous variable was examined within each group by the Shapiro–Wilk test, and homogeneity of variance was assessed by the Levene test. Continuous data are presented as mean ± standard deviation. Because variances were heterogeneous for several variables, between-group comparisons were performed by the Welch analysis of variance with Games–Howell post hoc tests, which do not assume equal variances or equal group sizes [17]. Categorical variables are presented as counts and percentages and were compared by the chi-square test. Associations of NLR with metabolic, inflammatory and hepatic parameters were quantified by the Pearson product-moment correlation coefficient with 95 % confidence intervals derived from the Fisher z transformation, with the Spearman rank correlation coefficient reported in parallel as a distribution-free confirmation. Correlations were computed within the chronic hepatitis C cohort (n = 100), which is the clinically relevant stratum, and repeated in the full cohort (n = 150). Partial correlations adjusted for age and sex were obtained by correlating the residuals of the corresponding linear models. Diagnostic performance was assessed by receiver operating characteristic (ROC) analysis. The area under the curve (AUC) and its 95 % confidence interval were estimated by the non-parametric method of DeLong with a logit transformation, and areas under correlated curves were compared by the DeLong test [18]. The threshold maximising the Youden index was identified [19]. Because that threshold was both derived and evaluated in the same sample, it is reported throughout as an exploratory, cohort-derived value rather than as a diagnostic cut-off proposed for clinical use. Sensitivity, specificity, positive and negative predictive values and overall accuracy at the selected threshold are reported with Wilson score 95 % confidence intervals. The independence of the association between NLR and insulin resistance was examined in two complementary ways. First, HOMA-IR was modelled as a continuous outcome in multivariable linear regression, with unstandardised coefficients, 95 % confidence intervals and variance inflation factors reported. Second, insulin resistance was modelled as a binary outcome; because NLR separated the two classes completely, conventional maximum-likelihood logistic regression does not yield finite estimates, and Firth penalised likelihood logistic regression was used instead, with profile penalised-likelihood confidence intervals and penalised likelihood ratio tests [20, 21]. All tests were two-sided and a p-value below 0.05 was considered statistically significant. Analyses were performed in SPSS version 21 (IBM Corp., Armonk, NY, USA) and independently reproduced in Python version 3.12 using the NumPy, SciPy, pandas, scikit-learn and statsmodels libraries.
Sensitivity analysis of the insulin-resistance classification
Because one clinically allocated patient in the CHC+IR group had a recalculated HOMA-IR of 2.59, marginally below the a priori threshold of 2.6, the robustness of the principal results to the classification rule was examined in a sensitivity analysis. In that analysis the threshold of HOMA-IR ≥ 2.6 was applied strictly to the recalculated values, so that the patient concerned was reassigned to the non-insulin-resistant stratum and the two chronic hepatitis C groups became 49 and 51 patients, respectively. The complete set of principal analyses was then repeated without further modification, comprising the between-group comparison of NLR, the ROC analysis of NLR for insulin resistance within the chronic hepatitis C cohort with re-estimation of the AUC and of the Youden-optimal threshold, the multivariable linear regression of HOMA-IR on NLR adjusted for age and sex, and the penalised logistic regression of insulin resistance on NLR. The linear model is by construction invariant to the classification rule, since HOMA-IR enters as a continuous outcome, the covariates are unchanged, and the reclassification relabels one patient without adding or removing any observation; it is nevertheless refitted and reported so that the invariance is verifiable rather than merely asserted. Because the reclassification is capable of introducing overlap between the two NLR distributions, the ROC analysis of the reclassified data was additionally examined for whether the DeLong variance became estimable, and a conventional maximum-likelihood logistic model was refitted to determine whether finite estimates could be obtained. The primary analysis retains the clinical allocation, because that allocation was fixed before any analysis was undertaken; the sensitivity analysis is reported alongside it so that the influence of the single borderline observation is fully transparent.
Data, code and reproducibility
The de-identified participant-level dataset (Supplementary Data S1), the corresponding statistical output (Supplementary File S2), and the analysis code used to reproduce the principal analyses (Supplementary Code S3) are provided as supplementary materials. The dataset contains a sequential study identifier in place of any hospital or personal identifier, and no name, date of birth, admission number, address or other directly or indirectly identifying field is included. From Supplementary Data S1 alone, Supplementary Code S3 reproduces the between-group comparison of NLR, the ROC analyses of NLR and the comparator markers, the linear and penalised logistic regression of the association between NLR and insulin resistance, and the sensitivity analysis of Section 3.9, and Supplementary File S2 records its output.
Results
Demographic characteristics
The study population comprised 150 participants distributed equally among the three groups. Mean age was 49.74 ± 4.13 years in controls, 51.02 ± 4.71 years in the CHC−IR group and 52.00 ± 5.90 years in the CHC+IR group, with no statistically significant difference between groups (F = 2.60, p = 0.075). Male participants accounted for 27 (54.0 %), 32 (64.0 %) and 29 (58.0 %) of the control, CHC−IR and CHC+IR groups respectively, and the sex distribution did not differ significantly between groups (χ² = 1.045, df = 2, p = 0.593). The three groups were therefore comparable with respect to the two principal demographic determinants of the parameters under study (Table 1).
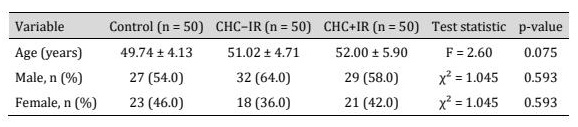
Table 1: Demographic characteristics of the study participants. Values are mean ± standard deviation or n (%). CHC−IR, chronic hepatitis C without insulin resistance; CHC+IR, chronic hepatitis C with insulin resistance
Haematological parameters and the neutrophil-to-lymphocyte ratio
Absolute neutrophil counts rose progressively across the three groups, from 3.83 ± 0.27 ×10⁹/L in controls to 4.56 ± 0.40 ×10⁹/L in the CHC−IR group and 5.36 ± 0.56 ×10⁹/L in the CHC+IR group (Welch F = 170.7, p < 0.001), with all three pairwise comparisons statistically significant (p < 0.001). Lymphocyte counts were 2.14 ± 0.15, 2.34 ± 0.16 and 2.12 ± 0.23 ×10⁹/L respectively (Welch F = 25.8, p < 0.001); the CHC−IR group differed from both the control group (p < 0.001) and the CHC+IR group (p < 0.001), whereas controls and the CHC+IR group did not differ (p = 0.859). The neutrophil-to-lymphocyte ratio increased in a stepwise manner across the three groups, from 1.79 ± 0.02 in controls to 1.95 ± 0.13 in the CHC−IR group and 2.53 ± 0.15 in the CHC+IR group (Welch F = 625.5, p < 0.001), and all three pairwise comparisons were statistically significant (p < 0.001). The observed ranges did not overlap between the CHC−IR group (1.62–2.22) and the CHC+IR group (2.24–2.80) (Table 2).
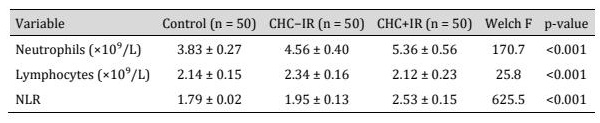
Table 2: Haematological parameters and neutrophil-to-lymphocyte ratio among the study groups. Values are mean ± standard deviation. NLR, neutrophil-to-lymphocyte ratio. Games–Howell post hoc comparisons were significant at p < 0.001 for all pairs except control versus CHC+IR for lymphocytes (p = 0.859)
Liver function biomarkers
Serum ALT rose from 30.80 ± 3.64 U/L in controls to 38.79 ± 5.90 U/L in the CHC−IR group and 48.97 ± 5.17 U/L in the CHC+IR group (Welch F = 207.4, p < 0.001), and AST from 31.12 ± 5.65 to 39.62 ± 5.89 and 49.40 ± 5.60 U/L (Welch F = 131.4, p < 0.001). Corresponding increases were observed for GGT (30.04 ± 4.88, 42.12 ± 4.90 and 53.02 ± 4.91 U/L; Welch F = 274.0, p < 0.001), ALP (118.70 ± 8.76, 132.00 ± 9.50 and 140.00 ± 9.97 U/L; Welch F = 67.0, p < 0.001) and total bilirubin (0.95 ± 0.12, 1.17 ± 0.18 and 1.40 ± 0.18 mg/dL; Welch F = 110.8, p < 0.001). Total serum protein decreased across the same sequence (7.69 ± 0.12, 7.38 ± 0.06 and 7.17 ± 0.04 g/dL; Welch F = 547.8, p < 0.001). By contrast, the AST/ALT ratio was essentially identical in the three groups (1.02 ± 0.19, 1.04 ± 0.18 and 1.02 ± 0.15; Welch F = 0.3, p = 0.776) (Table 3).
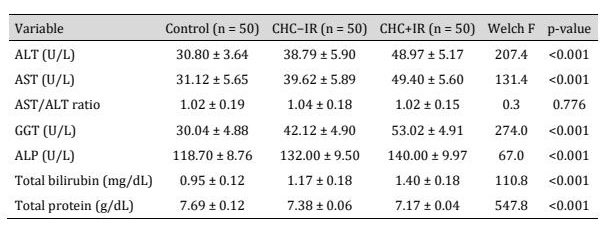
Table 3: Liver function biomarkers among the study groups. Values are mean ± standard deviation. ALT, alanine aminotransferase; AST, aspartate aminotransferase; GGT, gamma-glutamyl transferase; ALP, alkaline phosphatase
Metabolic parameters and insulin resistance
Fasting plasma glucose increased from 87.62 ± 5.05 mg/dL in controls to 103.00 ± 5.36 mg/dL in the CHC−IR group and 109.60 ± 6.16 mg/dL in the CHC+IR group (Welch F = 213.3, p < 0.001). Fasting insulin was 6.13 ± 0.32, 7.23 ± 1.21 and 12.37 ± 0.84 μIU/mL respectively (Welch F = 1194.8, p < 0.001), and HOMA-IR was 1.33 ± 0.12, 1.84 ± 0.36 and 3.35 ± 0.35 (Welch F = 747.6, p < 0.001). All pairwise comparisons for the three metabolic variables were statistically significant (p < 0.001). Recalculated HOMA-IR values ranged from 2.59 to 4.15 in the CHC+IR group and from 1.02 to 2.59 in the two non-insulin-resistant groups; the lower bound of the former range corresponds to the single borderline patient described in Section 2.5, whose reassignment is examined in Section 3.9 (Table 4).
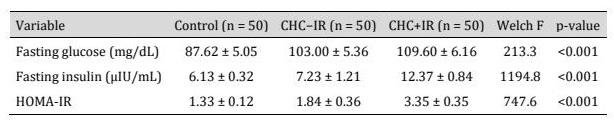
Table 4: Metabolic parameters among the study groups. Values are mean ± standard deviation. HOMA-IR, Homeostatic Model Assessment for Insulin Resistance
Inflammatory biomarkers
Serum CRP was 0.74 ± 0.11 mg/L in controls, 0.97 ± 0.12 mg/L in the CHC−IR group and 2.46 ± 0.24 mg/L in the CHC+IR group (Welch F = 1057.0, p < 0.001). IL-6 concentrations were 32.57 ± 7.29, 42.85 ± 8.31 and 61.93 ± 7.89 pg/mL respectively (Welch F = 188.2, p < 0.001), and TNF-α concentrations were 7.29 ± 0.73, 8.76 ± 0.37 and 13.83 ± 0.79 pg/mL (Welch F = 1057.2, p < 0.001). All pairwise comparisons were statistically significant (p < 0.001). The highest concentrations of all three mediators were observed in the insulin-resistant group (Table 5).
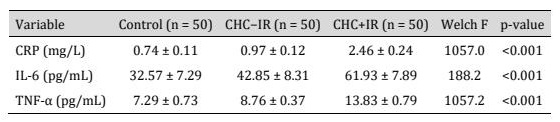
Table 5: Inflammatory biomarkers among the study groups. Values are mean ± standard deviation. CRP, C-reactive protein; IL-6, interleukin-6; TNF-α, tumour necrosis factor-alpha
Association of NLR with metabolic, inflammatory and hepatic parameters
Within the chronic hepatitis C cohort (n = 100), NLR was strongly and positively correlated with HOMA-IR (r = 0.898, 95 % CI 0.852–0.930; ρ = 0.853; p < 0.001) and with fasting insulin (r = 0.903, 95 % CI 0.859–0.934; p < 0.001), and more moderately with fasting glucose (r = 0.569, 95 % CI 0.420–0.689; p < 0.001). Among the inflammatory mediators, NLR correlated most strongly with CRP (r = 0.913, 95 % CI 0.873–0.941), followed by TNF-α (r = 0.906, 95 % CI 0.863–0.936) and IL-6 (r = 0.798, 95 % CI 0.713–0.860), all p < 0.001. Positive correlations of intermediate strength were observed with GGT (r = 0.772), ALT (r = 0.693), AST (r = 0.687), total bilirubin (r = 0.563) and ALP (r = 0.421), and a strong inverse correlation with total protein (r = −0.881, 95 % CI −0.918 to −0.828). NLR was not correlated with the AST/ALT ratio (r = −0.040, p = 0.691) or with age (r = 0.032, p = 0.750). The correlation between NLR and HOMA-IR was essentially unchanged after adjustment for age and sex (partial r = 0.898, p < 0.001), and all correlations were of the same magnitude and direction in the full cohort of 150 participants (Table 6, Fig. 1).
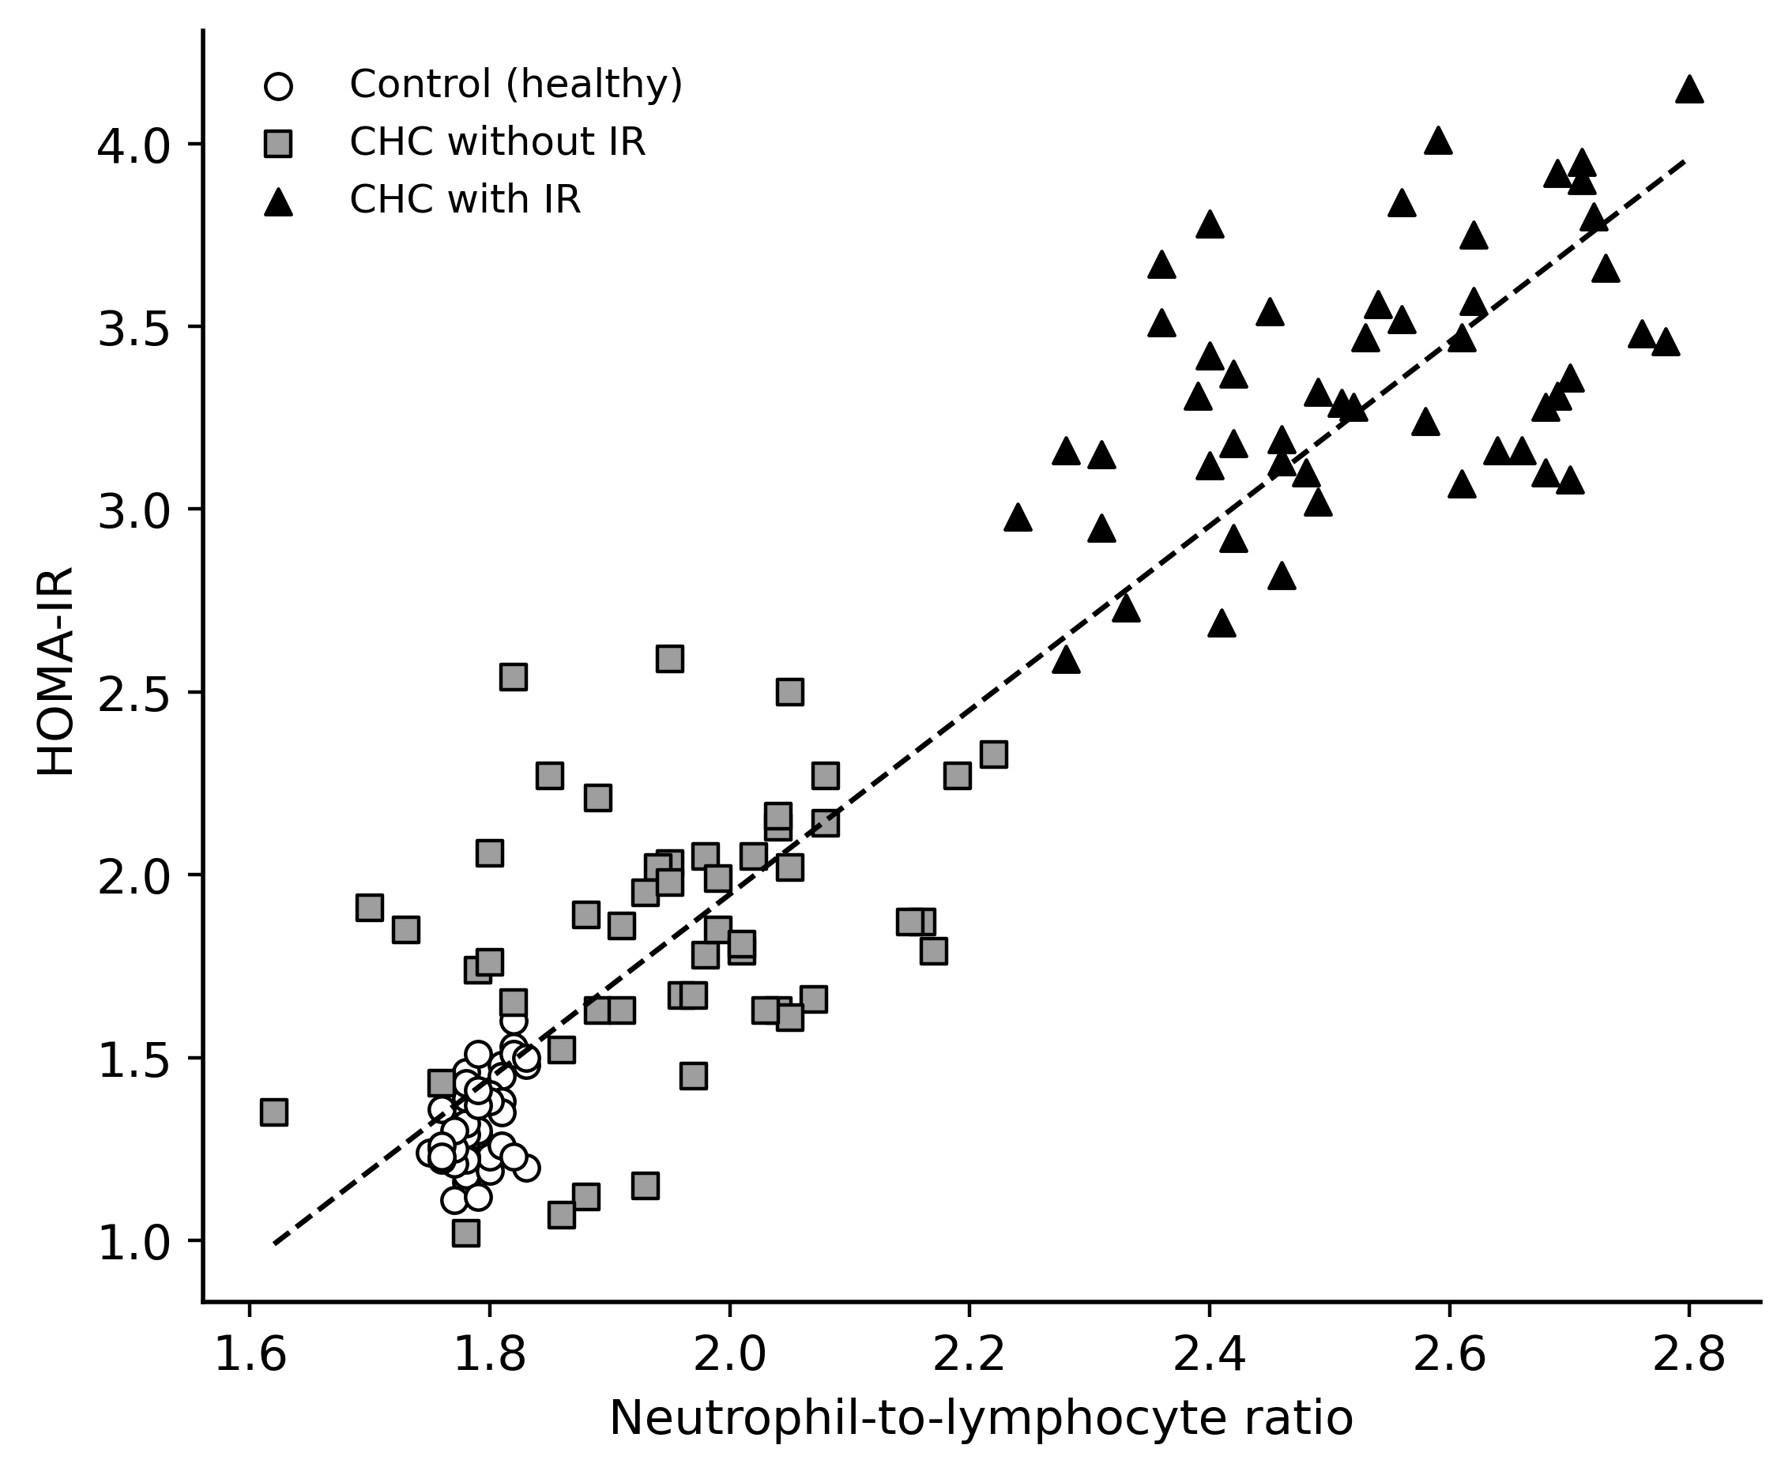
Fig. 1: Relationship between the neutrophil-to-lymphocyte ratio and HOMA-IR across the three study groups, with the fitted linear trend for the whole cohort.
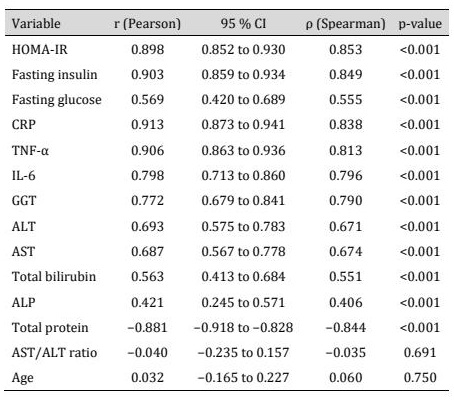
Table 6: Correlations of the neutrophil-to-lymphocyte ratio with metabolic, inflammatory and hepatic parameters. Analyses restricted to patients with chronic hepatitis C (n = 100). Confidence intervals for the Pearson coefficient were derived from the Fisher z transformation. p-values refer to the Pearson coefficient
Diagnostic performance
of NLR Within the chronic hepatitis C cohort (n = 100, of whom 50 were insulin resistant), NLR discriminated insulin-resistant from non-insulin-resistant patients with an area under the curve of 1.000. The exploratory, cohort-derived threshold maximising the Youden index was 2.24, at which sensitivity and specificity were both 100 % (95 % CI 92.9–100 % for each), with positive and negative predictive values of 100 % (95 % CI 92.9–100 %) and overall accuracy of 100 % (95 % CI 96.3–100 %). This value reflects complete separation of the two classes: the highest NLR observed among non-insulin-resistant patients was 2.22 and the lowest among insulin-resistant patients was 2.24. Because the classes were fully separated, the DeLong variance of the area estimate was zero and a conventional confidence interval for the AUC could not be computed; the accuracy estimates should therefore be regarded as upper bounds obtained in the derivation sample rather than as generalisable performance figures. For comparison, within the same cohort CRP (threshold 1.94 mg/L) and TNF-α (threshold 12.11 pg/mL) also separated the two classes completely (AUC 1.000 for each), whereas IL-6 achieved an AUC of 0.954 (95 % CI 0.904–0.979; threshold 48.53 pg/mL, sensitivity 98.0 %, specificity 82.0 %), GGT an AUC of 0.947 (95 % CI 0.887–0.976; threshold 50.40 U/L, the highest of three thresholds sharing the maximal Youden index, sensitivity 78.0 %, specificity 98.0 %), ALT an AUC of 0.903 (95 % CI 0.829–0.947) and the absolute neutrophil count an AUC of 0.871 (95 % CI 0.787–0.925). The area under the curve for NLR was significantly greater than that for IL-6 (difference 0.046, z = 2.60, p = 0.009), GGT (difference 0.053, z = 2.48, p = 0.013) and ALT (difference 0.097, z = 3.31, p < 0.001); comparison with CRP and TNF-α was not possible because all three markers produced identical, perfectly ranked classifications. When the analysis was extended to the full cohort of 150 participants, the same exploratory threshold of 2.24 retained a sensitivity of 100 % (95 % CI 92.9–100 %) and a specificity of 100 % (95 % CI 96.3–100 %) (Table 7, Fig. 2). All thresholds reported in this section were derived within the present cohort and are presented for description of these data only; none is proposed as a clinical decision threshold in the absence of external validation. For the secondary comparison between fibrotic chronic hepatitis C and healthy controls, NLR yielded an area under the curve of 0.942 (95 % CI 0.885–0.972, p < 0.001). At the exploratory, cohort-derived threshold of 1.85, sensitivity was 90.0 % (95 % CI 82.6–94.5 %), specificity 100 % (95 % CI 92.9–100 %), positive predictive value 100 % (95 % CI 95.9–100 %), negative predictive value 83.3 % (95 % CI 72.0–90.7 %) and overall accuracy 93.3 % (95 % CI 88.2–96.3 %). The AST/ALT ratio did not discriminate between these two groups (AUC 0.528, 95 % CI 0.427–0.627, p = 0.583). Because every patient in this cohort had fibrosis and every control did not, this comparison quantifies discrimination between fibrotic disease and health rather than discrimination among fibrosis stages (Fig. 3).
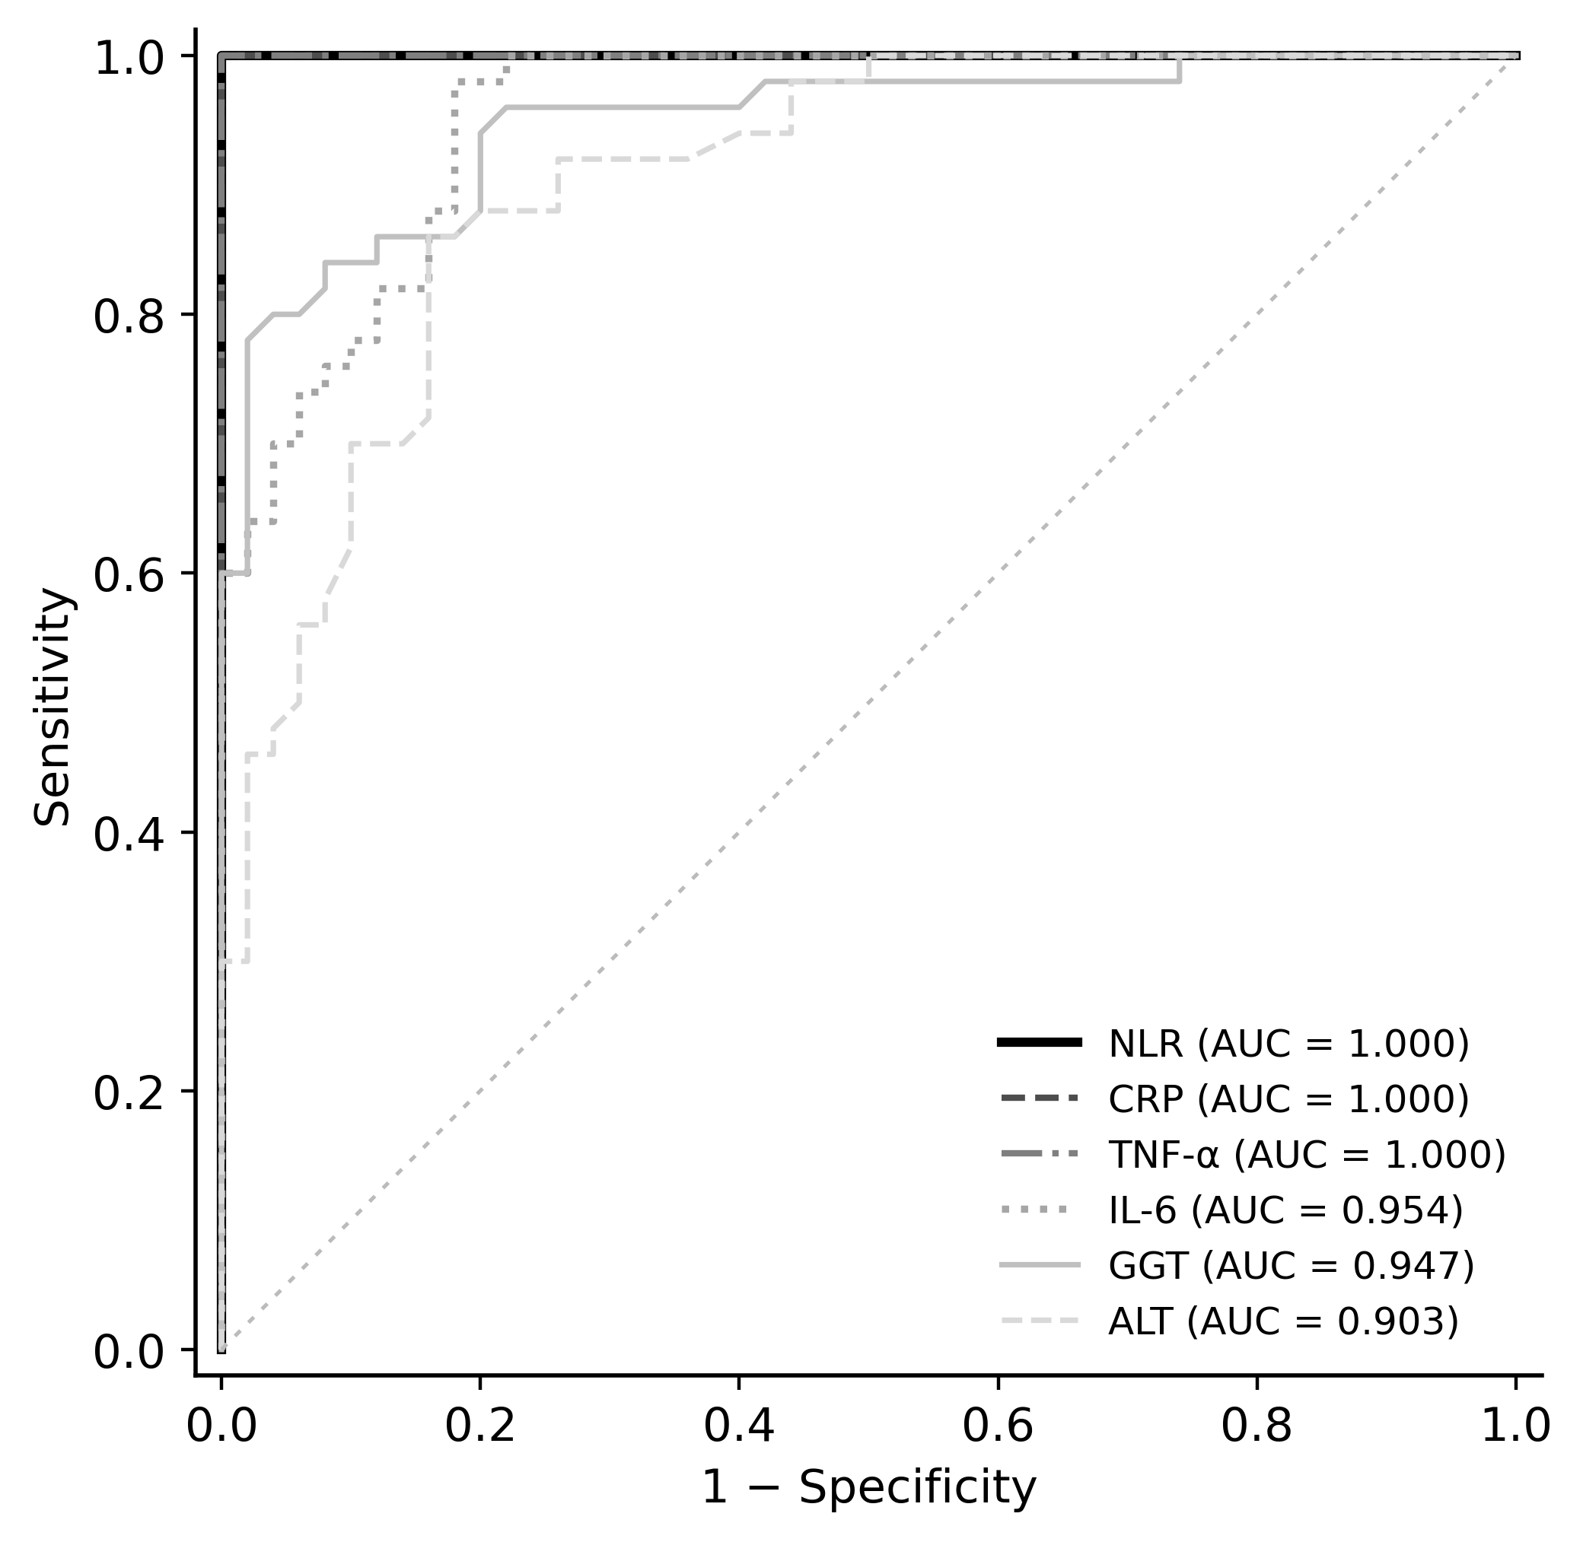
Fig. 2: Receiver operating characteristic curves for the neutrophil-to-lymphocyte ratio and comparator markers in the identification of insulin resistance among patients with chronic hepatitis C (n = 100).
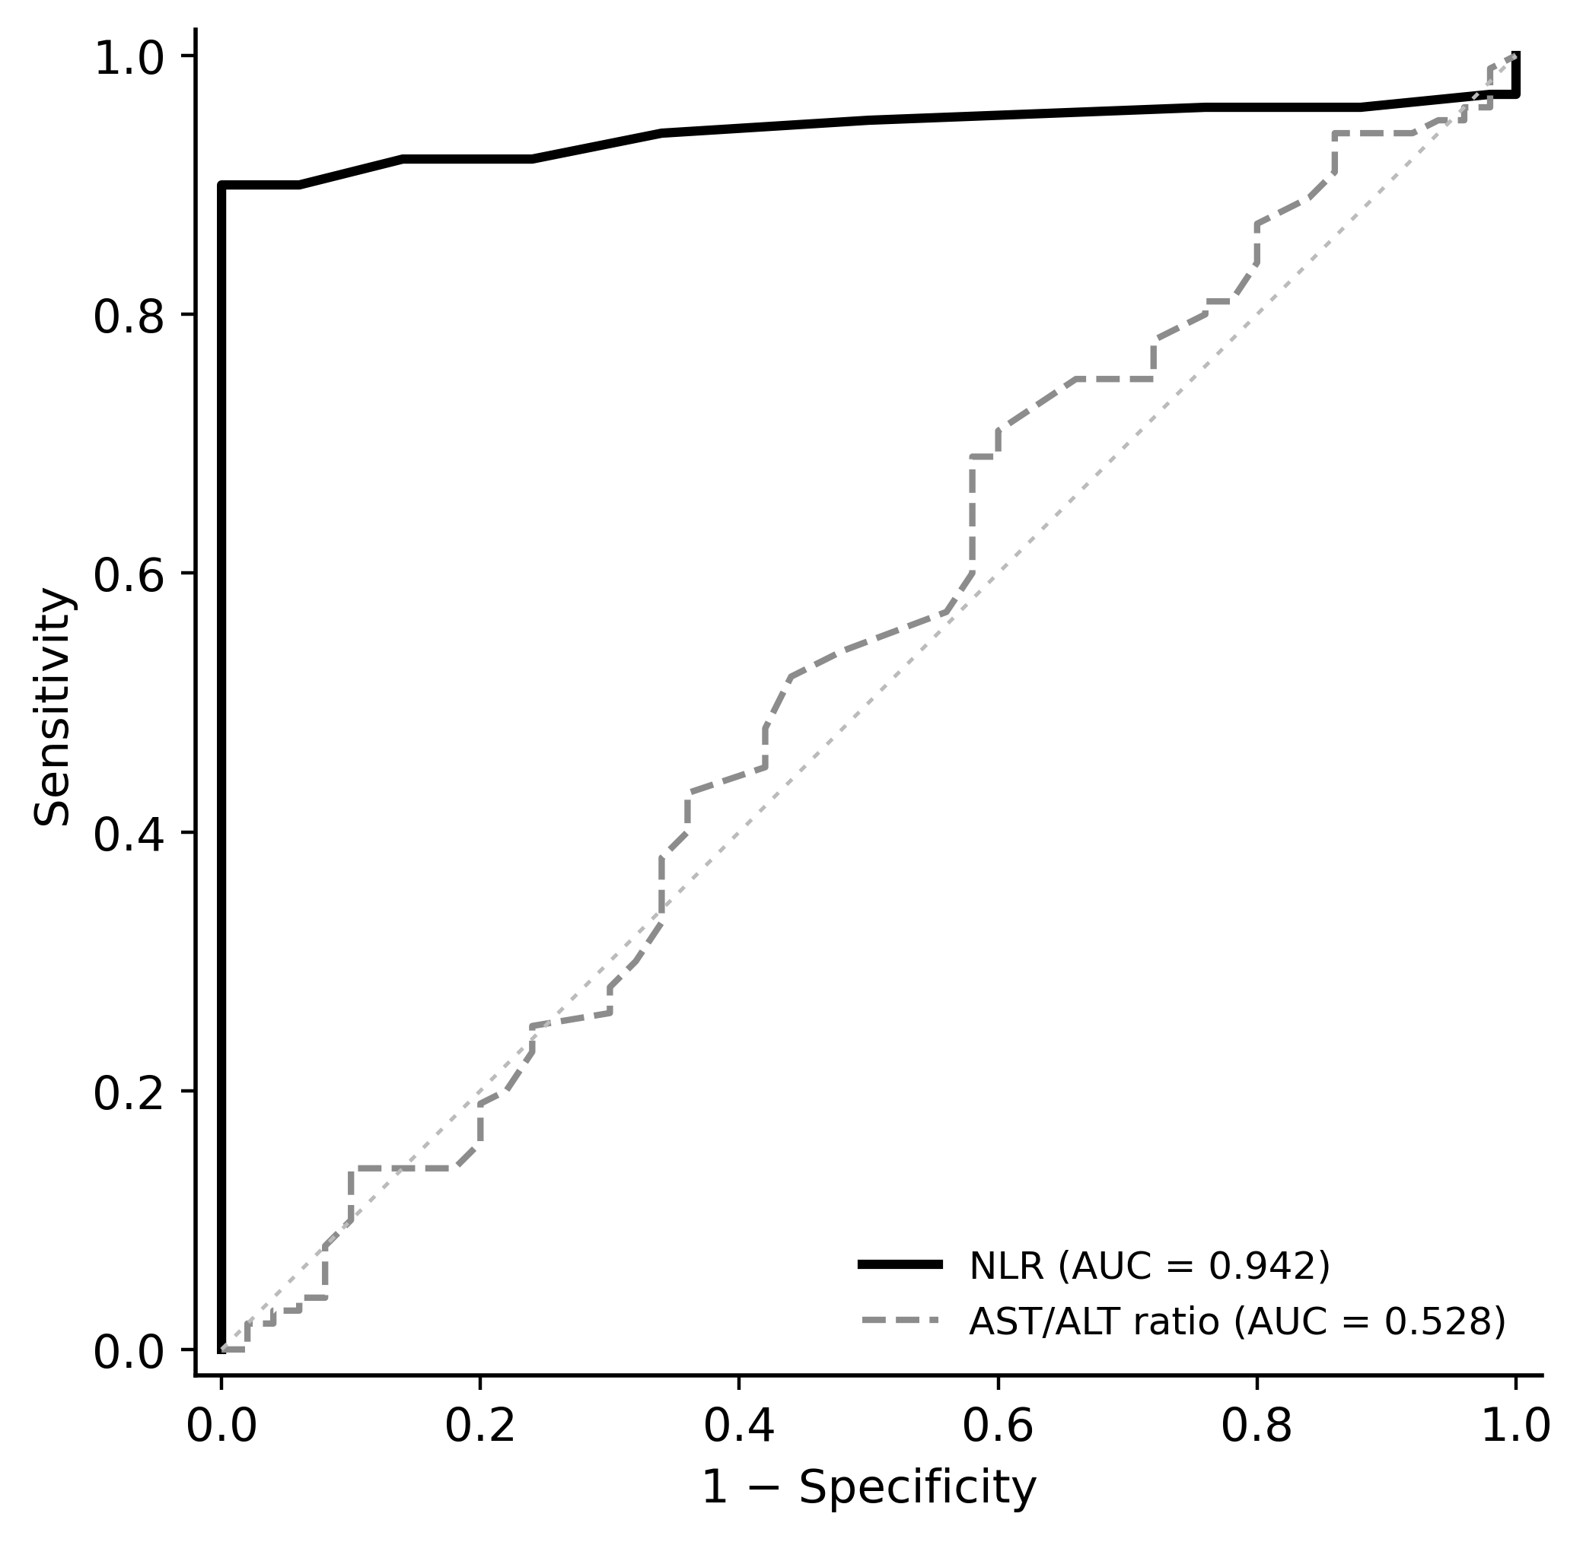
Fig. 3: Receiver operating characteristic curves for the neutrophil-to-lymphocyte ratio and the AST/ALT ratio in the discrimination of fibrotic chronic hepatitis C from healthy controls (n = 150).
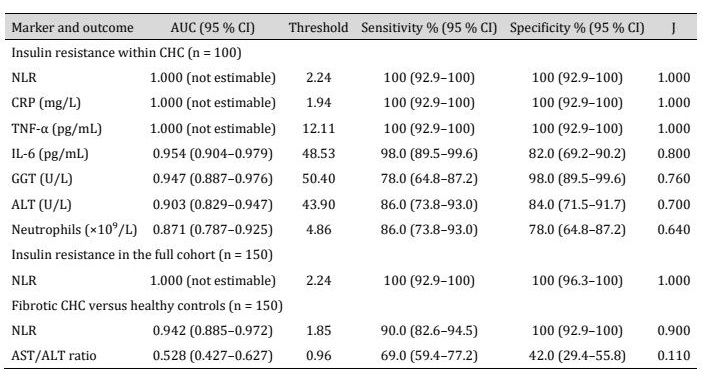
Table 7: Diagnostic performance of the neutrophil-to-lymphocyte ratio and comparator markers. AUC, area under the receiver operating characteristic curve; CI, confidence interval; J, Youden index. Confidence intervals for the AUC were obtained by the DeLong method with logit transformation and are not estimable where the classes are completely separated. All thresholds were derived within the present cohort by maximisation of the Youden index and are exploratory values requiring independent external validation; none is an established clinical cut-off. For GGT, three thresholds yielded the same maximal Youden index (J = 0.760): 48.50 U/L (sensitivity 84.0 %, specificity 92.0 %), 50.30 U/L (80.0 %, 96.0 %) and 50.40 U/L (78.0 %, 98.0 %); the highest is reported (Supplementary File S2). Confidence intervals for sensitivity and specificity are Wilson score intervals
Multivariable analysis
In multivariable linear regression restricted to patients with chronic hepatitis C, NLR remained strongly associated with HOMA-IR after adjustment for age and sex, with each unit increase in NLR corresponding to an increase of 2.31 units in HOMA-IR (95 % CI 2.08–2.54, p < 0.001; model R² = 0.811). Neither age (B = 0.009, 95 % CI −0.005 to 0.023, p = 0.193) nor male sex (B = −0.063, 95 % CI −0.216 to 0.090, p = 0.413) was independently associated with HOMA-IR. Further adjustment for hepatic biochemical markers attenuated but did not abolish the association (B = 1.55, 95 % CI 1.16–1.94, p < 0.001; R² = 0.846), with independent contributions from GGT (B = 0.026, 95 % CI 0.011–0.041, p = 0.001) and total bilirubin (B = 0.415, 95 % CI 0.030–0.800, p = 0.035). When the inflammatory mediators were added, the coefficient for NLR fell further but remained significant (B = 0.59, 95 % CI 0.10–1.08, p = 0.018; R² = 0.884), alongside TNF-α (B = 0.133, p = 0.004) and IL-6 (B = 0.010, p = 0.021); variance inflation factors of 15.6 for TNF-α and 16.4 for CRP in this model indicate severe collinearity among the inflammatory markers, and the individual coefficients of that model should not be interpreted as independent effects. In Firth penalised logistic regression with insulin resistance as the binary outcome, each increment of 0.1 in NLR was associated with an odds ratio of 11.87 (95 % profile penalised-likelihood CI 3.74 to 3527, p < 0.001) after adjustment for age and sex, and of 5.69 (95 % CI 2.02 to 231, p < 0.001) after further adjustment for ALT and GGT. Neither age nor sex was independently associated with insulin resistance in either model. Penalisation was necessary because NLR separated the outcome classes completely, and that same separation leaves the penalised likelihood almost flat as the coefficient increases, so that the upper confidence limits are extremely wide and carry no useful information; the lower limits are the interpretable part of these intervals, and the point estimates are stabilised values whose magnitude should not be read as a calibrated effect size (Table 8).
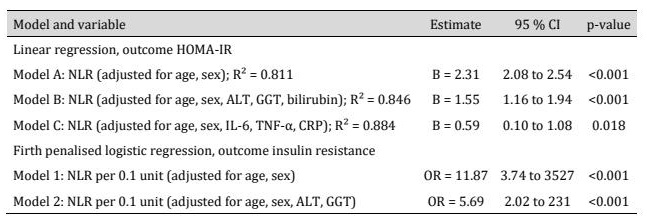
Table 8: Multivariable analysis of the association between the neutrophil-to-lymphocyte ratio and insulin resistance in patients with chronic hepatitis C (n = 100). B, unstandardised regression coefficient; OR, odds ratio; CI, confidence interval. Confidence intervals for the odds ratios are profile penalised-likelihood intervals; their upper limits are very wide because complete separation leaves the penalised likelihood almost flat as the coefficient increases, and only the lower limits are informative. Model C is reported for completeness only; variance inflation factors above 15 indicate severe collinearity among the inflammatory markers
Sensitivity analysis of the insulin-resistance classification
When the a priori threshold of HOMA-IR ≥ 2.6 was applied strictly to the recalculated values, the single borderline patient described in Section 2.5 (recalculated HOMA-IR 2.59) was reassigned from the CHC+IR to the CHC−IR stratum, so that the two chronic hepatitis C groups comprised 49 and 51 patients respectively. All other data and all analytical procedures were unchanged. Under this reclassification, mean NLR was 2.54 ± 0.15 in the insulin-resistant stratum and 1.96 ± 0.14 in the non-insulin-resistant stratum, and the difference between the two strata remained highly significant (Welch F = 415.5, p < 0.001). In the ROC analysis of NLR for insulin resistance within the chronic hepatitis C cohort, the area under the curve was 0.9994 (95 % CI 0.9932–0.9999), and the threshold maximising the Youden index was 2.24, recovered unchanged from the primary analysis, at which sensitivity was 100 % (95 % CI 92.7–100 %) and specificity 98.0 % (95 % CI 89.7–99.7 %), with overall accuracy 99.0 % (95 % CI 94.6–99.8 %). The reclassification abolished the complete separation of the two distributions: of the 2499 case–control pairs one was discordant and one was tied, the reassigned patient (NLR 2.28) now lying above one retained insulin-resistant patient (NLR 2.24) and level with another. The DeLong variance was consequently non-zero (5.57 × 10⁻⁷), so that a confidence interval for the area became estimable for the first time. In multivariable linear regression with HOMA-IR as the outcome, the coefficient for NLR adjusted for age and sex was B = 2.31 (95 % CI 2.08–2.54, p < 0.001; R² = 0.811), identical to the primary estimate because the linear model does not depend on the binary classification. In Firth penalised logistic regression, the odds ratio per 0.1-unit increment in NLR adjusted for age and sex was 12.04 (95 % profile penalised-likelihood CI 3.81 to 7325, p < 0.001), compared with 11.87 (95 % CI 3.74 to 3527) in the primary analysis. Conventional maximum-likelihood logistic regression still failed to converge to finite estimates, because a single discordant pair leaves the data quasi-separated, and penalised estimation therefore remained necessary. The corresponding primary and sensitivity estimates are set out side by side in Table 9, and the full output is given in Supplementary File S2. Taken together, the sensitivity analysis indicates that reallocation of the single borderline patient left the direction, magnitude and statistical significance of every principal result unchanged. The exploratory threshold of 2.24 was recovered exactly, sensitivity was unaltered at 100 %, specificity fell by a single misclassified patient from 100 % to 98.0 %, the area under the curve fell from 1.000 to 0.9994, and the regression estimates moved only marginally. The dependence of the reported diagnostic performance on the classification rule is therefore modest, but it is set out here in full so that it is visible to the reader rather than assumed; the one substantive change is that the loss of complete separation permits a confidence interval for the area to be constructed, and that interval is itself consistent with near-perfect discrimination within this sample.
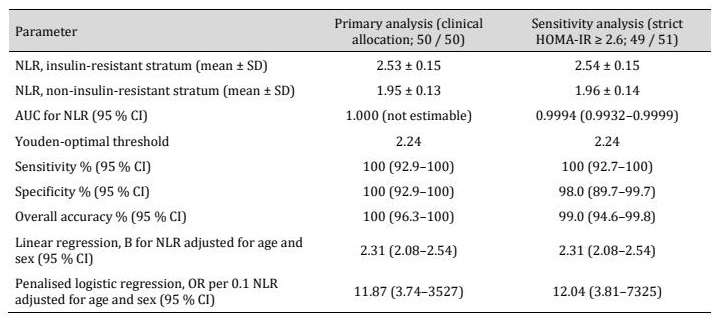
Table 9: Primary and sensitivity analyses of the principal results according to the rule used to classify insulin resistance. AUC, area under the receiver operating characteristic curve; CI, confidence interval; NLR, neutrophil-to-lymphocyte ratio; OR, odds ratio; SD, standard deviation. The primary analysis retains the group allocation made clinically at recruitment. The sensitivity analysis applies the a priori HOMA-IR threshold of 2.6 strictly to the recalculated values, reassigning one patient with a recalculated HOMA-IR of 2.59 from the insulin-resistant to the non-insulin-resistant stratum. The linear regression coefficient is invariant to the classification rule, because HOMA-IR enters that model as a continuous outcome and no observation is added or removed
Discussion
This case–control study quantified the cross-sectional diagnostic performance of the neutrophil-to-lymphocyte ratio for the identification of insulin resistance in patients with fibrotic chronic hepatitis C. Three findings emerged. First, NLR increased in a graded fashion from healthy controls through non-insulin-resistant patients to insulin-resistant patients, and the increase paralleled the rise in fasting insulin, HOMA-IR, CRP, IL-6 and TNF-α. Second, NLR was strongly correlated with HOMA-IR and with each of the inflammatory mediators, and this association persisted after adjustment for age, sex and hepatic biochemical markers. Third, NLR discriminated insulin-resistant from non-insulin-resistant patients with an area under the curve of 1.000 at an exploratory, cohort-derived threshold of 2.24, and discriminated fibrotic chronic hepatitis C from health with an area under the curve of 0.942 at an exploratory threshold of 1.85. It is important to distinguish clearly between these three levels of evidence. The graded group differences and the correlations establish an association between NLR and the metabolic and inflammatory phenotype of chronic hepatitis C. The ROC analyses establish diagnostic discrimination, that is, the ability of NLR measured at a single time point to classify patients according to a concurrently measured reference standard. Neither analysis establishes prediction in the prognostic sense, because no participant was followed longitudinally and no incident outcome was observed. Nor can the observed associations be interpreted causally: the design cannot determine whether inflammatory activation drives insulin resistance, whether insulin resistance amplifies inflammatory signalling, or whether both arise from a common process driven by persistent viral replication. The wording of the present conclusions has been restricted accordingly. The perfect discrimination observed for NLR merits particular caution and is reported here transparently rather than presented as a strength. The distributions of NLR in the insulin-resistant and non-insulin-resistant patients did not overlap at all, the highest value in the latter group being 2.22 and the lowest in the former 2.24. Complete separation of this kind is exceptional in clinical biomarker data and has two immediate consequences. Statistically, it renders the variance of the area estimate zero, so that no confidence interval can be constructed, and it prevents conventional maximum-likelihood logistic regression from converging, which is why penalised estimation was required. Substantively, an area under the curve of 1.000 obtained in the sample in which the threshold was also derived is an optimistic estimate that incorporates optimisation bias and cannot be assumed to transfer to an independent population. The same pattern was observed for CRP and TNF-α, which suggests that the phenomenon reflects a feature of the sampling frame — most plausibly the selection of clinically well-defined groups at the extremes of the metabolic spectrum — rather than a property unique to NLR. The value of 2.24 is therefore presented throughout this article as an exploratory, cohort-derived threshold, that is, as a hypothesis to be tested prospectively, and not as an established or clinically actionable cut-off. The dependence of these estimates on the rule used to classify insulin resistance was examined directly. Because a single patient allocated clinically to the insulin-resistant group had a recalculated HOMA-IR of 2.59, marginally below the a priori threshold, the whole set of principal analyses was repeated with that patient reassigned according to a strict application of the threshold. The results of that reanalysis are reported in Section 3.9 and Table 9 and show that reallocation of that patient left every principal estimate essentially unchanged: the exploratory threshold of 2.24 was recovered exactly, sensitivity remained 100 % and specificity fell to 98.0 %, and the area under the curve fell from 1.000 to 0.9994. This exercise illustrates a more general point about the present dataset: where two classes are separated by a narrow margin, the reported discrimination is necessarily sensitive to the placement of observations close to the classification boundary, and the fact that moving a single observation across that boundary was enough to abolish complete separation is a further reason why the threshold reported here requires validation in a cohort in which it was not derived. The direction and magnitude of the difference in NLR closely resemble those reported by Abdel-Razik et al. in chronic hepatitis C, who found a mean NLR of 2.61 in patients with HOMA-IR above 3 and 1.92 in those at or below it [10], compared with 2.53 and 1.95 in the insulin-resistant and non-insulin-resistant groups of the present study. Two other studies found no association of NLR with insulin resistance or with fibrosis [11, 12]; differences in patient selection, in the method of fibrosis assessment and in the HOMA-IR threshold used to define insulin resistance may contribute to this inconsistency, which is a further reason why the present threshold requires external validation. The direction and biological coherence of the findings are nevertheless consistent with the wider literature. An elevated NLR reflects the combination of neutrophil-predominant innate activation and relative lymphocyte depletion that characterises persistent viral infection, and higher values have been reported in chronic liver disease in association with fibrosis progression and adverse outcome [22, 23]. The parallel elevation of TNF-α and IL-6 accords with experimental evidence that these mediators impair insulin receptor substrate phosphorylation and activate intracellular inflammatory cascades that interfere with hepatic and peripheral insulin signalling [24, 25]. The concurrent rise of NLR, cytokine concentrations and HOMA-IR observed here is compatible with the view that immune activation and metabolic dysfunction are closely coupled in chronic hepatitis C, although the present design cannot establish the direction of that coupling [24, 26]. The biochemical profile of the patients — elevated ALT, AST, GGT, ALP and bilirubin with reduced total protein — is consistent with sustained hepatocellular injury and impaired synthetic function [27], and with the extracellular matrix remodelling and progressive architectural distortion that characterise hepatic fibrogenesis [28, 29]. Notably, the AST/ALT ratio, a widely used surrogate index of advanced fibrosis, neither differed between groups nor correlated with NLR, and did not discriminate patients from controls. This reinforces the point that the fibrosis-related comparison in this study reflects the presence of disease rather than its stage: in a cohort in which fibrosis severity varies little, or in which stage is not recorded, indices designed to track stage would not be expected to perform well. From a clinical standpoint, the appeal of NLR lies in its accessibility. It is derived from a complete blood count that is already performed routinely, requires no additional reagent, sample or cost, and can be calculated in any laboratory irrespective of resources. In settings where transient elastography, protocol liver biopsy and cytokine assays are not routinely available, an index of this kind could plausibly complement rather than replace established metabolic and fibrosis assessment tools [30], for example by flagging patients who warrant formal assessment of insulin resistance [31]. Realising that potential, however, depends on validation in cohorts that were not used to derive the threshold, and no clinical use of the value reported here is advocated on the strength of the present data.
Limitations
Several limitations should be considered when interpreting these results. The most important concerns the characterisation of fibrosis. Fibrosis was recorded only as present or absent, was ascertained from clinical, ultrasonographic and pre-existing histological records rather than by a uniform protocol, and was completely collinear with HCV status in this dataset. No fibrosis stage was available, no elastography was performed, and no patient with chronic hepatitis C in the absence of fibrosis was enrolled. It follows that the study cannot address whether NLR tracks fibrosis severity, and all statements concerning fibrosis have been confined to discrimination between fibrotic disease and health. Second, important disease-related characteristics of the HCV cohort were not collected and could not be retrieved retrospectively. These include treatment status and any prior or ongoing direct-acting antiviral therapy, HCV RNA viral load, viral genotype, estimated duration of infection, body mass index, waist circumference, lipid profile, alcohol intake and smoking status. Several of these variables influence both inflammatory and metabolic parameters, and antiviral therapy in particular alters both the metabolic and the fibrotic trajectory of chronic hepatitis C [32], and their absence means that residual confounding of the association between NLR and insulin resistance cannot be excluded. In particular, adiposity is a well-recognised determinant of both NLR and HOMA-IR, and the lack of any anthropometric measure is a material constraint on the multivariable analysis. Third, the complete separation of the outcome classes on NLR, CRP and TNF-α limits the interpretability of the diagnostic and regression estimates, as discussed above, and raises the possibility that group selection was influenced by characteristics correlated with the markers under study. Fourth, the reference standard itself is a dichotomised continuous index, and the placement of a single patient close to the HOMA-IR threshold was sufficient to warrant a formal sensitivity analysis; any threshold-based definition of insulin resistance carries this dependence, and the HOMA-IR value of 2.6 used here, although in routine use at the recruiting centre, is not universally adopted. Fifth, the study was conducted at a single tertiary centre with 50 participants per group, and the findings may not generalise to primary care populations or to patients with a broader spectrum of disease severity. Sixth, the diagnostic thresholds were derived and evaluated in the same sample without internal cross-validation or external validation, so the reported accuracy is subject to optimism. Seventh, the cross-sectional design precludes any inference about temporal sequence or prognosis. Finally, NLR is a non-specific index that rises in bacterial infection and sepsis and is influenced by corticosteroid use, physical stress and haematological disorders [33]; although participants with recognised confounding conditions were excluded, unrecognised influences cannot be ruled out.
Directions for future research
Prospective multicentre studies with protocol-driven fibrosis staging, ideally by transient elastography with histological confirmation in a subset, are required to determine whether NLR tracks fibrosis severity as distinct from disease presence. Such studies should record viral load, genotype, treatment status and anthropometric and lipid parameters, so that the independence of any association with insulin resistance can be assessed properly. Validation of the exploratory threshold reported here in an independent cohort, preferably with internal bootstrap or cross-validated correction for optimism reported alongside the apparent performance, and evaluation of whether NLR adds incremental information to established non-invasive indices, would be necessary before any clinical application could be contemplated.
Conclusion
In patients with fibrotic chronic hepatitis C, the neutrophil-to-lymphocyte ratio was strongly and independently associated with insulin resistance and with circulating concentrations of CRP, IL-6 and TNF-α, and discriminated insulin-resistant from non-insulin-resistant patients with high accuracy. The ratio also distinguished patients with fibrotic chronic hepatitis C from healthy controls. Because the outcome classes were completely separated on NLR and the threshold was derived in the same sample, the value of 2.24 is an exploratory, cohort-derived threshold rather than an established clinical cut-off, the accompanying accuracy estimates are optimistic, and both require independent external validation before any clinical use can be considered. Because fibrosis was recorded only as present or absent and was collinear with HCV status, the data support a diagnostic association with the presence of fibrotic disease rather than prediction of fibrosis severity, and no prognostic claim can be made from a cross-sectional design. Subject to these qualifications, the neutrophil-to-lymphocyte ratio remains an inexpensive and universally available index that merits prospective evaluation as a complement to established metabolic and fibrosis assessment tools in chronic hepatitis C.
Acknowledgements
The authors are grateful to the staff of the Baghdad Hospital for Gastroenterology and Hepatology, Medical City, for their assistance with sample collection and laboratory analysis, and to all participants who took part in this study.
Funding
This research received no specific grant from any funding agency in the public, commercial or not-for-profit sectors.
Ethics approval and consent to participate
The study protocol and the participant consent documentation were reviewed and approved by the Ethics Committee of the Institute of Genetic Engineering and Biotechnology for Postgraduate Studies, University of Baghdad, Baghdad, Iraq (reference ETH/255/MOH26, issued 15 October 2021, prior to the commencement of enrolment), and the study was conducted in accordance with the Declaration of Helsinki. A copy of the approval letter has been provided to the Editorial Office. Consent was obtained from every participant before enrolment in the form specified in the approved protocol; because the study required only a single venous blood sample taken during routine clinical care, consent was administered verbally using a standardised information script and was recorded, countersigned and dated in the participant’s study record by the consenting clinician.
Data availability
The de-identified participant-level dataset underlying the analyses reported in this article is provided as Supplementary Data S1, and the corresponding statistical output as Supplementary File S2. The dataset carries sequential study identifiers only and contains no direct or indirect personal identifiers.
Code availability
The analysis code used to reproduce the principal analyses, including the sensitivity analysis, is provided as Supplementary Code S3.
Author contributions
All authors contributed to the conception and design of the study, to data acquisition, analysis and interpretation, and to drafting and critical revision of the manuscript. All authors have read and approved the final version and agree to be accountable for all aspects of the work.
Disclosure Statement
The authors declare that they have no conflicts of interest regarding the publication of this article.
References
- Dash S, Aydin Y, Widmer KE, Nayak L. Hepatocellular carcinoma mechanisms associated with chronic HCV infection and the impact of direct-acting antiviral treatment. J Hepatocell Carcinoma. 2020;7:45-76. https://doi.org/10.2147/JHC.S221187
- Hammerich L, Tacke F. Hepatic inflammatory responses in liver fibrosis. Nat Rev Gastroenterol Hepatol. 2023;20(10):633-46. https://doi.org/10.1038/s41575-023-00807-x
- Alzahrani N. Hepatitis C virus, insulin resistance, and diabetes: A review. Microbiol Immunol. 2022;66(10):453-9. https://doi.org/10.1111/1348-0421.13023
- Mahmoud B, Moneim AA, Mabrouk D. The impact of HCV eradication on hyperglycemia, insulin resistance, cytokine production, and insulin receptor substrate-1 and 2 expression in patients with HCV infection. Clin Exp Med. 2022;22(4):583-93. https://doi.org/10.1007/s10238-021-00773-1
- Neuberger J, Cain O. The need for alternatives to liver biopsies: non-invasive analytics and diagnostics. Hepat Med. 2021;13:59-69. https://doi.org/10.2147/HMER.S278076
- Yip TCF, Lyu F, Lin H, Li G, Yuen PC, Wong VWS, Wong GLH. Non-invasive biomarkers for liver inflammation in non-alcoholic fatty liver disease: present and future. Clin Mol Hepatol. 2023;29(Suppl):S171-83. https://doi.org/10.3350/cmh.2022.0426
- Zahorec R. Neutrophil-to-lymphocyte ratio, past, present and future perspectives. Bratisl Lek Listy. 2021;122(7):474-88. https://doi.org/10.4149/BLL_2021_078
- Peng Y, Li Y, He Y, Wei Q, Xie Q, Zhang L, et al. The role of neutrophil to lymphocyte ratio for the assessment of liver fibrosis and cirrhosis: a systematic review. Expert Rev Gastroenterol Hepatol. 2018;12(5):503-13. https://doi.org/10.1080/17474124.2018.1463158
- D'Amico T, Miglionico M, Cangemi R, Romiti GF, De Fabrizio B, Fasano S, et al. Neutrophil-lymphocyte ratio is associated with worse outcomes in patients with cirrhosis: insights from the PRO-LIVER Registry. Intern Emerg Med. 2025;20(5):1371-80. https://doi.org/10.1007/s11739-025-03955-x
- Abdel-Razik A, Mousa N, Besheer TA, Eissa M, Elhelaly R, Arafa M, et al. Neutrophil to lymphocyte ratio as a reliable marker to predict insulin resistance and fibrosis stage in chronic hepatitis C virus infection. Acta Gastroenterol Belg. 2015;78(4):386-92.
- Alsebaey A, Elhelbawy M, Waked I. Platelets-to-lymphocyte ratio is a good predictor of liver fibrosis and insulin resistance in hepatitis C virus-related liver disease. Eur J Gastroenterol Hepatol. 2018;30(2):207-11. https://doi.org/10.1097/MEG.0000000000001013
- Ozel Coskun BD, Dizdar OS, Baspınar O, Ortaköylüoğlu A. Usefulness of the neutrophil-to-lymphocyte ratio and platelet morphologic parameters in predicting hepatic fibrosis in chronic hepatitis C patients. Ann Clin Lab Sci. 2016;46(4):380-6.
- Bossuyt PM, Reitsma JB, Bruns DE, Gatsonis CA, Glasziou PP, Irwig L, et al. STARD 2015: an updated list of essential items for reporting diagnostic accuracy studies. BMJ. 2015;351:h5527. https://doi.org/10.1136/bmj.h5527
- von Elm E, Altman DG, Egger M, Pocock SJ, Gøtzsche PC, Vandenbroucke JP. The Strengthening the Reporting of Observational Studies in Epidemiology (STROBE) statement: guidelines for reporting observational studies. Lancet. 2007;370(9596):1453-7. https://doi.org/10.1016/S0140-6736(07)61602-X
- Faul F, Erdfelder E, Lang AG, Buchner A. G*Power 3: a flexible statistical power analysis program for the social, behavioral, and biomedical sciences. Behav Res Methods. 2007;39(2):175-91. https://doi.org/10.3758/BF03193146
- Matthews DR, Hosker JP, Rudenski AS, Naylor BA, Treacher DF, Turner RC. Homeostasis model assessment: insulin resistance and beta-cell function from fasting plasma glucose and insulin concentrations in man. Diabetologia. 1985;28(7):412-9. https://doi.org/10.1007/BF00280883
- Games PA, Howell JF. Pairwise multiple comparison procedures with unequal n's and/or variances: a Monte Carlo study. J Educ Stat. 1976;1(2):113-25. https://doi.org/10.3102/10769986001002113
- DeLong ER, DeLong DM, Clarke-Pearson DL. Comparing the areas under two or more correlated receiver operating characteristic curves: a nonparametric approach. Biometrics. 1988;44(3):837-45.https://doi.org/10.2307/2531595
- Youden WJ. Index for rating diagnostic tests. Cancer. 1950;3(1):32-5. https://doi.org/10.1002/1097-0142(1950)3:1<32::AID-CNCR2820030106>3.0.CO;2-3
- Firth D. Bias reduction of maximum likelihood estimates. Biometrika. 1993;80(1):27-38. https://doi.org/10.1093/biomet/80.1.27
- Heinze G, Schemper M. A solution to the problem of separation in logistic regression. Stat Med. 2002;21(16):2409-19. https://doi.org/10.1002/sim.1047
- Sevastianos VA, Voulgaris TA, Dourakis SP. Hepatitis C, systemic inflammation and oxidative stress: correlations with metabolic diseases. Expert Rev Gastroenterol Hepatol. 2020;14(1):27-37. https://doi.org/10.1080/17474124.2020.1708191
- Ali MAM, Harmsen WS, Morsy KH, Galal GMK, Therneau TM, Roberts LR. Prognostic utility of systemic inflammatory markers and chronic hepatitis C virus infection status in hepatocellular carcinoma patients treated with local ablation. BMC Cancer. 2022;22(1):221. https://doi.org/10.1186/s12885-021-09121-8
- Szukiewicz D. Molecular mechanisms for the vicious cycle between insulin resistance and the inflammatory response in obesity. Int J Mol Sci. 2023;24(12):9818. https://doi.org/10.3390/ijms24129818
- Rafaqat S, Gluscevic S, Mercantepe F, Rafaqat S, Klisic A. Interleukins: pathogenesis in non-alcoholic fatty liver disease. Metabolites. 2024;14(3):153. https://doi.org/10.3390/metabo14030153
- Taban N, Bhat MH, Sayeed SI, Majid S, Lone S, Muzaffar M, et al. Comparative evaluation of inflammatory markers NLR, PLR, IL-6, and HbA1c in type 2 diabetes mellitus: a hospital based study. Med J Islam Repub Iran. 2025;39:48. https://doi.org/10.47176/mjiri.39.48
- Jain P, Batta AK, Singh P. Comparative study of serum levels of gamma-glutamyl transferase, aspartate aminotransferase (AST), alanine transaminase (ALT), AST:ALT, and bilirubin in patients with chronic hepatitis. Indian J Med Biochem. 2023;26(3):73-6. https://doi.org/10.5005/jp-journals-10054-0208
- Berumen J, Baglieri J, Kisseleva T, Mekeel K. Liver fibrosis: pathophysiology and clinical implications. WIREs Mech Dis. 2021;13(1):e1499. https://doi.org/10.1002/wsbm.1499
- Ortiz C, Schierwagen R, Schaefer L, Klein S, Trepat X, Trebicka J. Extracellular matrix remodeling in chronic liver disease. Curr Tissue Microenviron Rep. 2021;2(3):41-52. https://doi.org/10.1007/s43152-021-00030-3
- Heyens LJ, Busschots D, Koek GH, Robaeys G, Francque S. Liver fibrosis in non-alcoholic fatty liver disease: from liver biopsy to non-invasive biomarkers in diagnosis and treatment. Front Med. 2021;8:615978. https://doi.org/10.3389/fmed.2021.615978
- Tahapary DL, Pratisthita LB, Fitri NA, Marcella C, Wafa S, Kurniawan F, et al. Challenges in the diagnosis of insulin resistance: focusing on the role of HOMA-IR and triglyceride/glucose index. Diabetes Metab Syndr. 2022;16(8):102581. https://doi.org/10.1016/j.dsx.2022.102581
- Jędrysik M, Tomasiewicz K, Chełstowska B, Tudrujek-Zdunek M, Szymański FM. Influence of antiviral treatment in hepatitis C patients on metabolism and fibrosis process. Front Med. 2026;13:1729835. https://doi.org/10.3389/fmed.2026.1729835
- Liang P, Yu F. Value of CRP, PCT, and NLR in prediction of severity and prognosis of patients with bloodstream infections and sepsis. Front Surg. 2022;9:857218. https://doi.org/10.3389/fsurg.2022.857218