Original Article - DOI:10.33594/000000684
Accepted 11 February 2024 - Published online : 27 February 2024
Early Low-Grade Inflammation Induced by High-Salt Diet in Sprague Dawley Rats Involves Th17/Treg Axis Dysregulation, Vascular Wall Remodeling, and a Shift in the Fatty Acid Profile
bScientific Center of Excellence for Personalized Health Care, Josip Juraj Strossmayer University of Osijek, Trg Svetog Trojstva 3, HR-31000 Osijek, Croatia,
cDepartment of Dermatology and Venereology, University Hospital Center Osijek, J. Huttlera 4, HR-31000 Osijek, Croatia,
dDepartment of Nuclear Medicine and Oncology, Faculty of Medicine, Josip Juraj Strossmayer University of Osijek, J. Huttlera 4, HR-31000 Osijek, Croatia,
eCenter for Research and Knowledge Transfer in Biotechnology, University of Zagreb, Trg Republike Hrvatske 14, HR-10000 Zagreb, Croatia,
fDepartment of Drug Metabolism and Pharmacokinetics, Fidelta Ltd., Prilaz Baruna Filipovića 29, HR-10000 Zagreb, Croatia,
gDepartment of Chemistry and Biochemistry, Faculty of Food Technology and Biotechnology, University of Zagreb, Pierottijeva 6, HR-10000 Zagreb, Croatia
Keywords
Abstract
Background/Aims:
Unrestricted increased table salt (NaCl) intake is associated with oxidative stress and inflammation, leading to endothelial dysfunction and atherosclerosis. However, data on salt-induced immunomodulatory effects in the earliest phase of salt loading are scarce.Methods:
In the present study, an animal model of short-term salt loading was employed, including male Sprague Dawley rats consuming a high-salt diet (HSD; 4% NaCl) or standard laboratory chow (low-salt; LSD; 0.4% NaCl) during a 7-day period. The contribution of angiotensin II (ANGII) suppression was tested by adding a group of rats on a high-salt diet receiving ANGII infusions. Samples of peripheral blood/mesenteric lymph node leukocytes, brain blood vessels, and serum samples were processed for flow cytometry, quantitative real-time PCR, total proteome analysis, and multiplex immunoassay.Results:
Data analysis revealed the up-regulation of Il 6 gene in the microcirculation of high-salt-fed rats, accompanied by an increased serum level of TNF-alpha cytokine. The high-salt diet resulted in increased proportion of serum mono-unsaturated fatty acids and saturated fatty acids, reduced levels of linoleic (C18:2 ω-6) and α-linolenic (C18:3 ω-3) acid, and increased levels of palmitoleic acid (C16:1 ω-7). The high-salt diet had distinct, lymphoid compartment-specific effects on leukocyte subpopulations, which could be attributed to the increased expression of salt-sensitive SGK-1 kinase. Complete proteome analysis revealed high-salt-diet-induced vascular tissue remodeling and perturbations in energy metabolism. Interestingly, many of the observed effects were reversed by ANGII supplementation.Conclusion:
Low-grade systemic inflammation induced by a HSD could be related to suppressed ANGII levels. The effects of HSD involved changes in Th17 and Treg cell distribution, vascular wall remodeling, and a shift in lipid and arachidonic acid metabolism.Introduction
Unrestricted table salt (NaCl) intake has been associated with different health problems and poorer health outcomes, including hypertension, kidney failure, myocardial infarction, and cerebrovascular insults, all conditions that encompass atherosclerosis and vascular dysfunction [1–3]. An increasing body of evidence suggests that acute NaCl-induced suppression of the renin–angiotensin system (RAS) leads to decreased expression and activity of Cu/Zn SOD and Mn SOD, and increased oxidative stress resulting in inducible NO synthase (iNOS) uncoupling and reduced NO bioavailability [4, 5]. This further leads to impaired vasodilatation, as demonstrated in experimental animal [6, 7] and human studies [8]. It is well accepted that HSD significantly alter metabolism of arachidonic acid, as demonstrated by Matić A and colleagues [7], which affects the mechanisms of vasodilation in various microcirculatory beds [7, 9]. In our previous studies we have demonstrated that this effect is mostly related to increased oxidative stress due to HSD and ANG II levels suppression [6]. Both saturated as well as unsaturated fatty acids can modify immune response [8]. However, there is a lack of information on the effects of HSD on lipid metabolisms and fatty acids profile. Moreover, increased levels of reactive oxygen and nitrogen species (ROS and RNS) act as signaling molecules and induce vascular tissue damage by triggering immune responses and inflammation [10]. Increased salt loading over a longer period may change the balance between pro-inflammatory Th17 lymphocytes and anti-inflammatory regulatory T cells (Treg) in favor of Th17 lymphocytes, resulting in further exacerbation of ongoing inflammation under autoimmune settings [11–14]. This is associated with the changes in expression and activity of salt-sensitive kinase (SGK-1), a member of the MAPK/p38 signaling pathway [15]. However, data on the earliest effects on the naïve and silent T lymphocytes in healthy individuals are scarce.
Recent publication provided evidence for tissue accumulation of NaCl, independent of systemic renal osmolyte regulation and water retention [16], suggesting a possible contribution to organ-specific immune regulation. Our understanding of the salt-induced perturbation of the immune processes are even more uncertain, as the intriguing current evidence suggests a divergent, context-dependent influence of NaCl on T-cell differentiation, where pro-inflammatory effects were exerted only in the presence of the pro-inflammatory cytokine milieu, deprived of transforming growth factor beta (TGFβ) [17]. By contrast, Th17-cell activation proceeding in a neutral environment resulted in robust forkhead box P3 (Foxp3) and TGFβ up-regulation (signature transcription factor and cytokine of Treg), exceeding the extent of retinoic-acid-receptor-related orphan nuclear receptor gamma t (RORɣt) and interleukin(IL)-17 expression (signature transcription factor and cytokine of Th17), giving Th17 T cells an anti-inflammatory function [17]. Nevertheless, many underlying mechanisms involved in vascular low-grade inflammation due to salt loading remain elusive, as does the exact time of their onset.
The hypothesis of the present work was that the short-term high salt dietary (HSD) intake leads to the development of low-grade inflammation by inducing early endothelial activation and cytokine production within the vessel wall. An additional hypothesis was that the mechanisms underlying NaCl-induced changes in Th17/Treg balance and fatty acid metabolism involve RAS suppression. The present study aimed to investigate the earliest effects of salt loading on systemic and vascular inflammation in Sprague-Dawley rat model, by utilizing state-of-the-art methods and complex cluster analysis of data. Sprague Dawley rats were fed HSD (4% NaCl) during a 7-day period in order to avoid the effects of salt-induced changes in blood pressure and body fluid composition. Vascular inflammation in microcirculation and systemic inflammation were assessed by measuring tissue and serum concentrations of cytokines, chemokines and cell adhesion molecules, in addition to serum concentration of fatty acids as precursors of lipid mediators involved in the process of inflammation. Distribution of Th17 and Treg lymphocytes within the peripheral blood and mesenteric lymph node (MLN) compartments was assessed to examine the effects of HSD on the T helper-cell differentiation and adaptive immune responses. Furthermore, to test if the observed effects were associated with deprivation of RAS due to HSD, an additional set of experiments involving angiotensin II (ANGII) supplementation was performed.
We identified clusters of factors, including Th17/Treg axis dysregulation, vascular wall remodeling, and shifts in lipid metabolism, which underlie the mechanisms of low-grade inflammation induced by short-term HSD in Sprague Dawley rats.
Materials and Methods
Animal model and study design
Three groups of healthy male Sprague Dawley rats (10 weeks old) were included in the study, which lasted for 7 days. Rats were randomly assigned to the following groups (n = 16–17 rats/group): (1) low-salt diet (LSD) group (LSD group) fed with normal rat chow containing 0.4% NaCl (Mucedola, Italy); (2) high-salt diet (HSD) group fed with customized food for rats (Mucedola, Italy) supplemented with 4% NaCl (HSD group), and (3) an additional HSD group receiving angiotensin II infusion (HSD + ANGII group), as described in text bellow. Rats were housed in pairs in ventilated shoebox-style cages in a 12 h:12 h light-dark cycle and had access to pelleted food and water ad libitum. The rats were sacrificed by decapitation following sedation with 75 mg/kg of ketamine (Ketanest S 25 mg/mL, Pfizer) and 0.5 mg/kg of midazolam (Midazolam Torrex 5 mg/mL, Torrex Chiesi Pharma). The number of animals used was reduced to a minimum by collecting as many samples as possible from each animal, in addition to refinement procedures undertaken to reduce the animals’ stress. All direct procedures involving animals were performed at the animal care facility of the Faculty of Medicine at the Josip Juraj Strossmayer University of Osijek, Osijek, Croatia, which is a registered and certified user/breeder of mice and rats for educational and scientific purposes.
Experimental procedures conformed with the European Guidelines for the Care and Use of Laboratory Animals (Directive 86/609) and were approved by the local Ethical Committee (Faculty of Medicine, Josip Juraj Strossmayer University of Osijek, class: 602-04/14-08/06, no.: 2158-61-07-14-04) and by the Ministry of Agriculture, Croatia (HR-POK-005). All measurements were performed in the Laboratory for Vascular Physiology and the Laboratory for Molecular and Clinical Immunology, at the Department of Physiology and Immunology, Faculty of Medicine Osijek, Josip Juraj Strossmayer University of Osijek, Osijek (Croatia), and in the Laboratory for Radiation Chemistry and Dosimetry, Ruđer Bošković Institute, Zagreb, Croatia.
Mean arterial blood pressure measurement
Rats were anesthetized using a combination of ketamine (75 mg.kg-1, 25 mg.mL-1 Ketanest S, Pfizer) and midazolam (2.5 mg.kg-1, 5 mg.mL-1 Midazolam Torrex, Torrex Chiesi Pharma). A sterile catheter was inserted into the left femoral artery and mean arterial blood pressure was measured using a Spacelabs Medical monitoring system (Spacelabs Medical, Redmond, WA). The animals were left for 10 min to allow for blood pressure to stabilize prior to recording. Mean arterial pressure was calculated from the 1-min recording data as a sum of systolic and double diastolic pressure divided by three [7, 18]. Following blood pressure measurement, blood and tissue samples were collected for further analysis. If necessary, initial sample processing was undertaken (as described in the following sections) and then the samples were stored at −80 °C until final analysis.
Angiotensin II infusion
On the day 4 of HSD, following anesthesia, the rats from the HSD+ANGII group received an osmotic minipump (ALZET, Cupertino, CA) for subcutaneous administration of angiotensin II (100 ng.kg-1.min-1) for 3 consecutive days (5th–7th day) [18].
Analysis of serum free fatty acid levels
Gas chromatography–tandem mass spectrometry (GC–MS/MS) technique was applied for analysis of the serum fatty acids profile, as described previously [19, 20]. The 37-component fatty acid methyl esters (FAME MIX) stock solution was purchased as 30 mg/mL total concentration of fatty acids in methylene chloride from Supelco (Supelco Inc.; Bellefonte, PA, USA), and used for the preparation of standard solutions. The sample preparation procedure from Wang et al [43]. was modified and used for the analysis. For the serum fatty acids profile analysis, the GC–MS/MS system by Thermo Fisher GC Trace 1300 coupled with TSQ 9000 Triple Quadrupole was used. The serum fatty acids profile analysis was performed at the BIOCentre’s Bioanalytical Laboratory, BIOCentre – incubation center for biosciences, in Zagreb, Croatia. Fatty acid species observed within this study are listed in Suppl. Table 1.
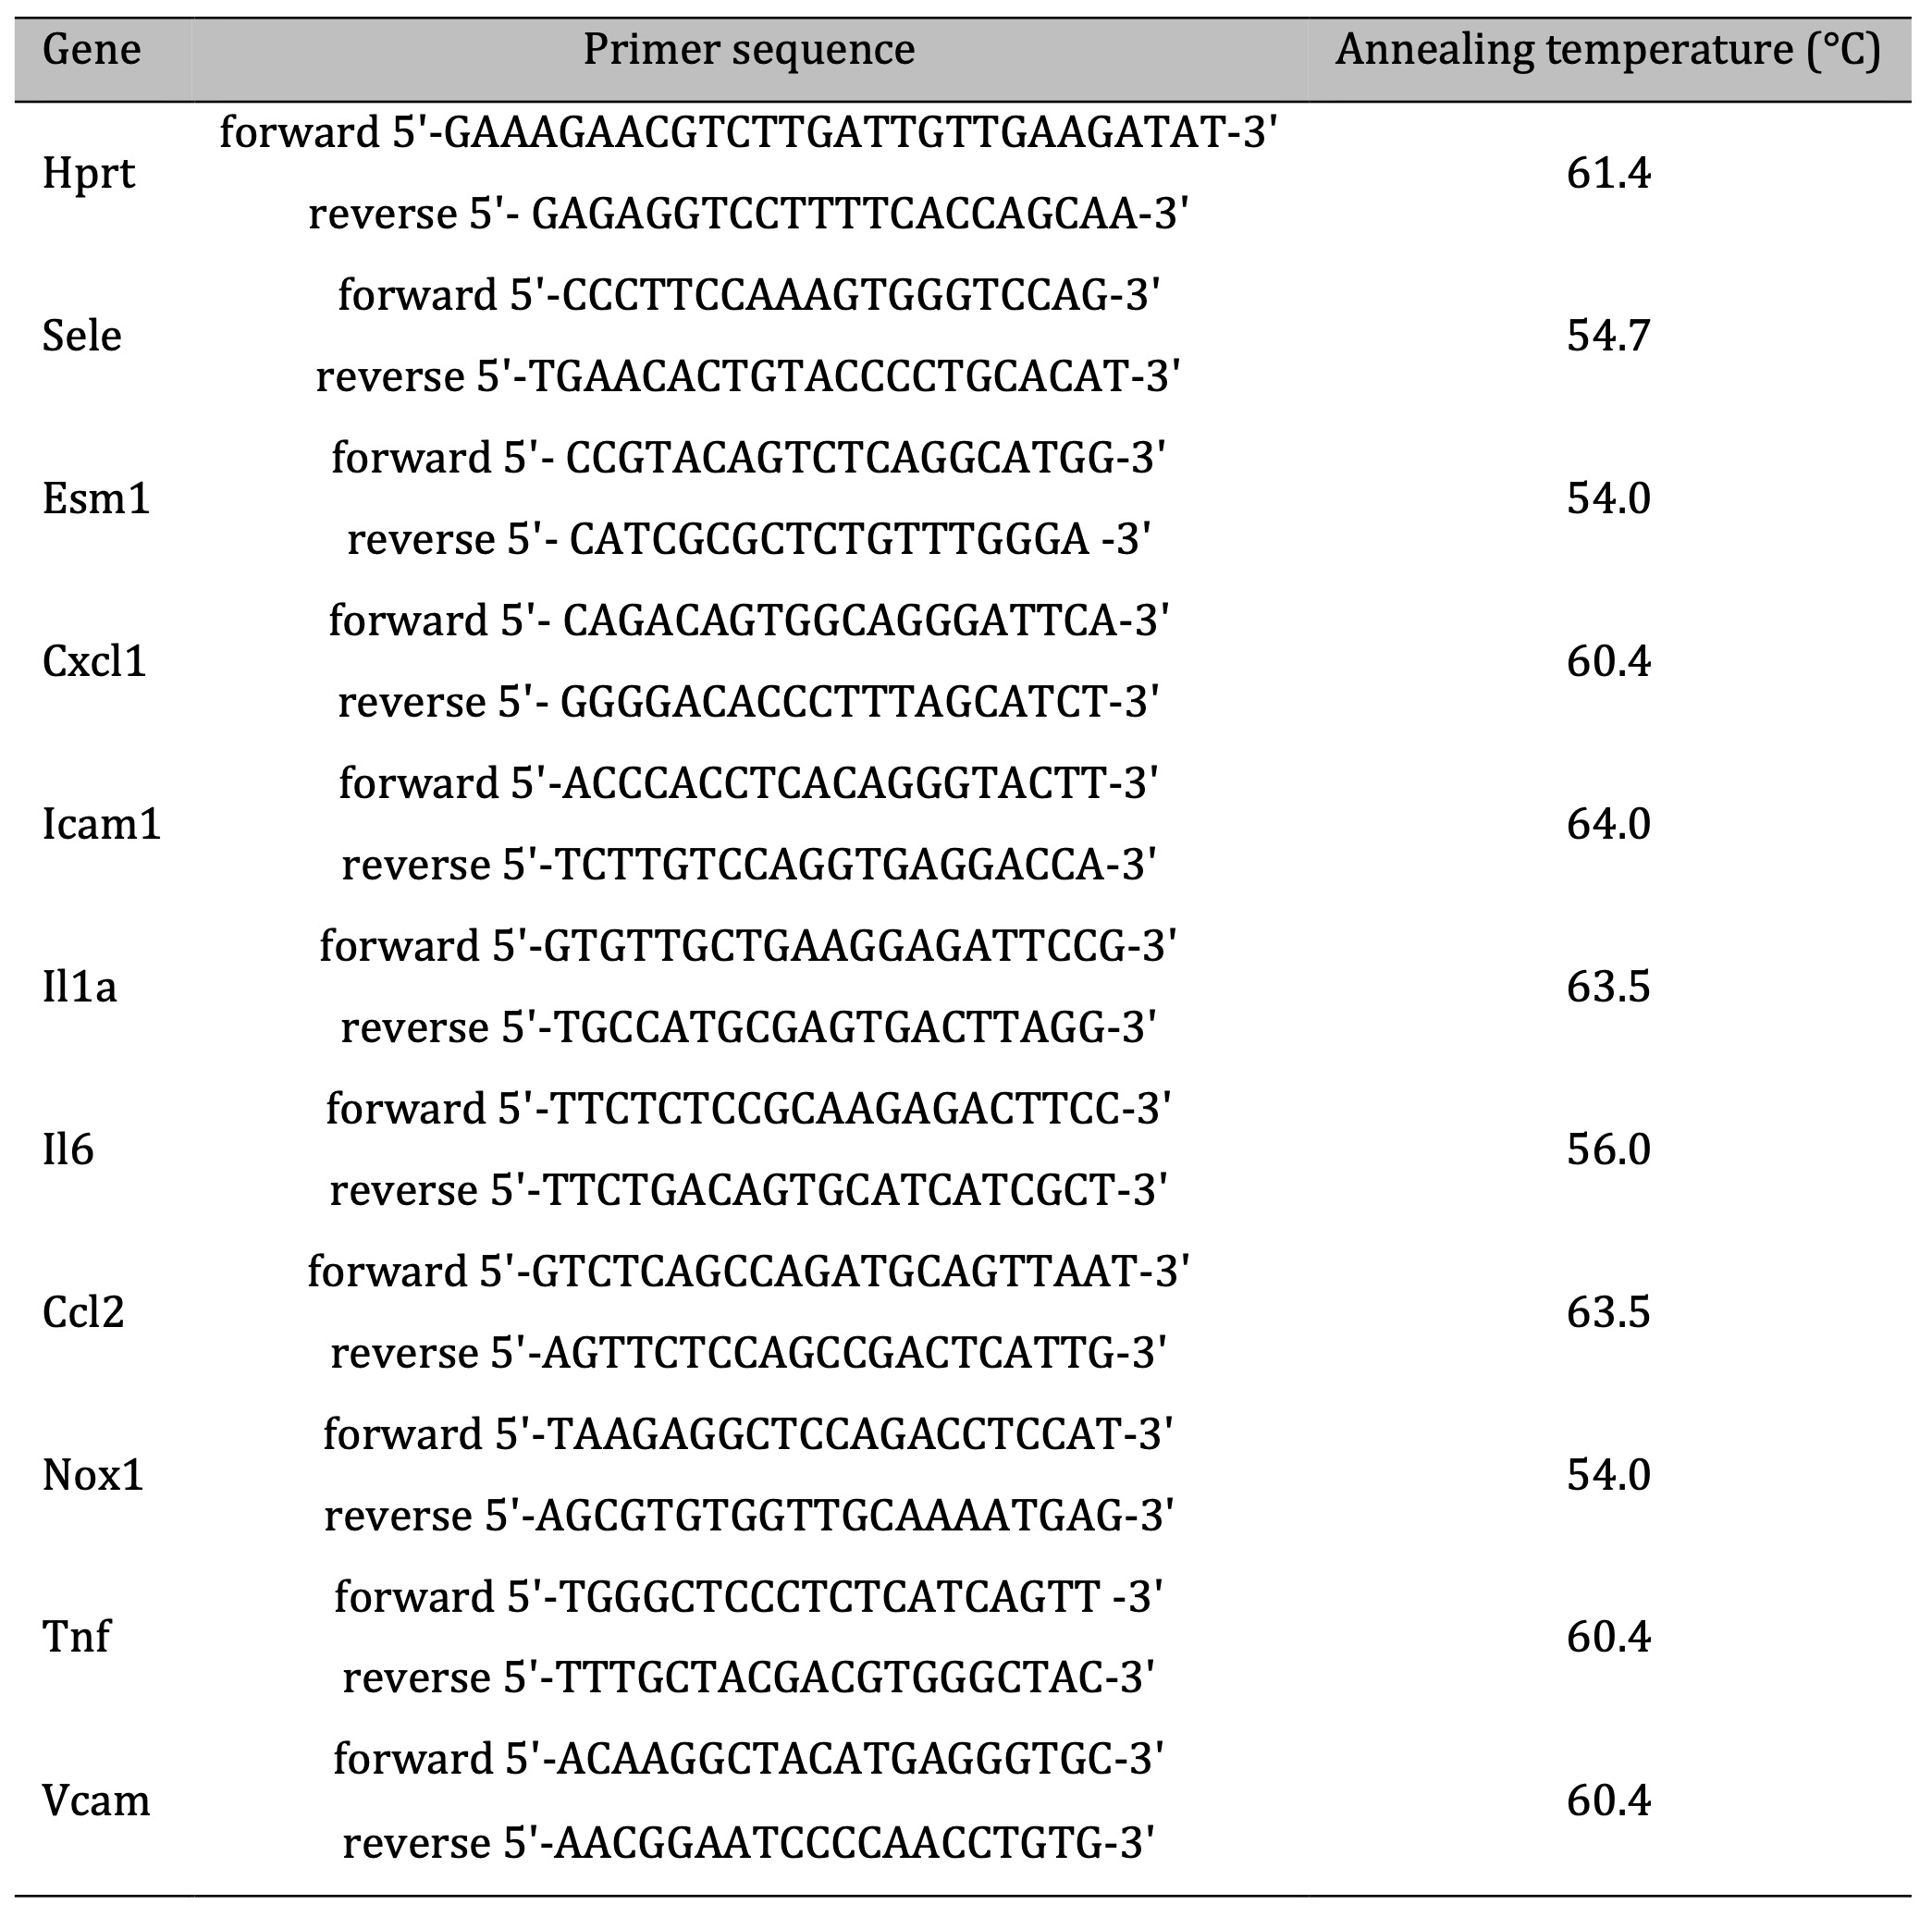
Table 1: Primer sequences and PCR reaction cycling conditions
Assessment of serum cytokine, chemokine and soluble cell adhesion molecule levels
Peripheral blood samples for serum analysis were collected in anticoagulant-free tubes, centrifuged for 10 min at 1, 000 g, aliquoted and stored at (−80 °C) until use. Custom Multiplex Procarta Plex immunoassay (eBioscience, Affymetrix) and the Luminex 200 instrument platform were used for the multiplex quantitative analysis of cytokines (interleukin(IL)-1 alpha (IL-1 alpha), IL-6, and tumor necrosis factor alpha (TNF-α)); chemokines (monocyte chemoattractant protein 1 (MCP-1, CCL2) and (C-X-C motif) ligand 1 (CXCL1)); and soluble cell adhesion molecules (soluble vascular cell adhesion protein 1 (sVCAM-1) and soluble intercellular adhesion molecule-1 (sICAM-1)). Measurements were performed in the Laboratory for Immunology and Allergology Diagnostics at the University Hospital Center Osijek (Osijek, Croatia). The levels of tested analytes in serum samples were determined using the 5P logistic fit algorithm of the ProcartaPlex Analyst software v 1.0. (eBioscience, Affymetrix).
Relative gene expression determined using the RT-qPCR method
Target gene expressions were assessed from main surface brain blood vessels (BBV) at the base of the brain known as the circle of Willis, including anterior, middle, posterior cerebral arteries and basilar artery (also called pial arteries). BBV were carefully extracted from the surface of the brain under the dissecting microscope, and any remaining surrounding tissue was removed using sharp Vannas spring scissors. BBV samples were snap frozen in liquid nitrogen and stored at −80 °C until further processing. Homogenization of samples and total RNA extraction were performed using TRI reagent (Life Technologies, USA) in accordance with the manufacturer’s protocol. Further purification of the samples and cDNA synthesis were performed using commercially available reagents in accordance with the manufacturer’s instructions (Sigma-Aldrich and Applied Biosystems, USA). RNA concentration and purity were verified by OD260/OD280 ratio > 1.8. using IMPLEN NanoPhotometer P-Class P-330 (IMPLEN GmbH, Germany), while RNA integrity was confirmed on a 1% agarose gel.
The obtained cDNA samples were diluted five-fold in nuclease-free water (Sigma-Aldrich, USA) and used as a template for subsequent quantitative real-time PCR analysis of ten selected targets (Il6, Il1a, Tnf, Cxcl1, Nox1, Ccl2, Esm1, Sele, Vcam1, Icam1) using Bio-Rad CFX96 (Bio-Rad, USA). Primer sequences and PCR reaction cycling conditions are given in Table 1. Expression levels of the examined transcripts were normalized relative to the hypoxanthine-guanine phosphoribosyltransferase (HPRT) reference gene, validated via the NormFinder algorithm as the best endogenous control. Fold difference in mRNA expression was finally calculated in accordance with the efficiency corrected model of 2-ΔΔCt method, as described by Pfaffl in 2001[37].
Proteomic analysis of brain blood vessel tissue
Protein extraction and sample preparation. Protein extraction from surface brain blood vessel collection was performed using Minute Kit in accordance with the manufacturer’s instructions. Concentrations of total proteins in lysates were determined using a BCA protein assay (Thermo Scientific, Rockford, IL, USA). Additionally, a pool of all samples was prepared by mixing equal protein amounts and used as the internal standard (reference sample). Tandem mass tag TMT labelling was performed as described previously [22]. In short, 20 µg of proteins from each sample was diluted using 0.1 M triethyl ammonium bicarbonate (TEAB, pH 7.8) up to a final volume of 50 µL. The samples were reduced (2.5 µL of 200 mM DTT, 1 h at 55 °C), alkylated (2.5 µL of 375 mM iodoacetamide IAA, 30 min at room temperature, in the dark) and precipitated using ice-cold acetone (−20 °C overnight). Following a centrifugation step (8, 000 × g, 10 min at 4 °C), protein pellets were dissolved in 50 µL of 0.1 M TEAB containing trypsin (1:40, w/w) and digested overnight at 37 °C. Tryptic peptides were labelled using TMT tenplex reagents (Thermo Scientific, Rockford, IL, USA), which were prepared in accordance with the manufacturer’s instructions. For labeling, an amount of 19 µL was used and the reaction was quenched using 5% hydroxylamine. TMT-labelled peptides were combined into a new tube, aliquoted, dried and stored at −80 °C for LC-MS/MS analysis.
Liquid Chromatography Tandem Mass Spectrometry (LC-MS/MS) analysis. High-resolution label-based LC-MS/MS analysis was performed in order to obtain protein identities and relative quantification data, as reported previously [12, 14]. Dried TMT-labelled peptides were dissolved in loading buffer (2% ACN in 0.1% FA) and loaded onto the trapping column using the Ultimate 3000 RSLSnano system (Dionex). For peptide separation, PepMap™ RSLC C18 (50 cm × 75 μm ID) column and 2 h linear gradient of 5–35% buffer B (0.1% FA in 80% ACN) at a flow rate of 300 nL.min-1 were used. Eluent was introduced into the Q Exactive plus mass spectrometer (Thermo Fisher Scientific, Rockford, IL, USA) using nanospray Flex ion source and stainless-steel emitter (New Objective). The ionization voltage was set to 2.1 kV and the ion transfer tube temperature was 250 °C. The analysis was performed in DDA positive ion mode using the Top 8 method. Full scan FTMS spectra were acquired in mass range m/z 350.0 to m/z 1900.0 with the maximum injection time of 110 ms, resolution 70, 000 and AGC target 1 × 10⁶. For HCD fragmentation, step collision energy was set to 25, 35 and 40% NCE, resolution to 17, 500 and AGC target to 2 × 10⁵. An isolation window of ± 2.0 Da was applied to isolate precursor ions with the dynamic exclusion of 30 s. Precursor ions with the charges +1 and more than +7 were excluded from the fragmentation. The lock mass (m/z 445.1200) enabled internal calibration.
Proteomic data analysis. Protein identification was performed using the SEQUEST algorithm implemented within the Proteome Discoverer software (version 2.3., Thermo Fisher Scientific, Rockford, IL, USA) and database search of Mus musculus FASTA files (NCBI database, downloaded on 7 December 2017, 46, 105 entries). Search parameters were set as follows: two trypsin missed cleavage sites; precursor and fragment mass tolerances of 10 ppm and 0.05 Da, respectively; carbamidomethyl (C) as fixed peptide modification; oxidation (M) and TMT sixplex (K, peptide N-terminus) as dynamic modifications. At least two unique peptides and cut-off of 5% FDR were set to obtain reliable protein identification. FDR was calculated for the entire data set using the Percolator algorithm within the Proteome Discoverer workflow, based on the search results from a decoy database. Reporter-based relative quantification, statistical analysis, as well as gene ontology and pathway analyses were performed within the Proteome Discoverer software. The internal standard was used as the reference sample. Abundance normalization based on total peptide amount and ratio calculation of proteins were performed. Biological replicates study using a non-nested design without missing value imputation was applied. For statistical analysis, p-values were calculated using unpaired t-test with subsequent Benjamini–Hochberg correction using a maximum adjusted P-value set to 0.05.
Flow cytometry – expression analysis of leukocyte cellular adhesion molecule ligands and frequencies of peripheral Treg and Th17 lymphocyte
Following the decapitation of the animals, peripheral blood samples were collected in tubes containing 6–10% of 0.5 M EDTA. 100 μL of collected blood was immediately processed for the cell surface staining of integrins, while the rest of the sample was processed for peripheral blood mononuclear cell (PBMC) isolation using a density gradient medium (Ficoll-Paque®, GE Healthcare Bio-Sciences AB, Sweden), in accordance with the manufacturer’s instructions. Collected PBMCs were gently suspended in 1x phosphate-buffered saline (PBS) and the cell count and viability were determined by staining the cells with 0.4% Trypan blue solution (Sigma-Aldrich, Merck KGaA, Germany) and counting them in the Bürker Türk hemocytometer under the 10X objective of an inverted phase contrast microscope (MBL3200, A. KRÜSS OPTRONIC GmbH, Germany). Finally, harvested PBMC collection was cryopreserved in 0.5 mL of cold fetal bovine serum (FBS; Sigma-Aldrich, USA), and an equal volume of pre-chilled (4 °C) freezing medium [20% of DMSO (Supelco, Merck KGaA, Germany) in FBS] was added dropwise. For optimal cell preservation, the cryovials were stacked in the Mr. Frosty freezing container containing isopropyl alcohol and placed in a −80 °C freezer for at least 24 h.
Sample processing for cell surface integrin expression. Cells were preincubated with rat Fc block (BD Pharmingen, USA) and then used for flow cytometry measurements of cell adhesion molecules CD11a/LFA-1 (BD Bioscience; Clone: WT.1) and CD11b/Mac-1 (eBioscience; Clone: OX42) on different subpopulations of leukocytes. Erythrocytes were lysed using the BD Lysing Solution 1x, 10 min on 37 °C, and washed twice for 5 min on 400 g/18 °C. After the last washing process, the cells were fixed with 1% formaldehyde. At least 20, 000 live singleton cells were collected using a BD FACS Canto II cytometer (FACS Canto II, Becton Dickinson, San Jose, CA, USA) equipped with blue Argon 488 nm and Red HeNe 633 nm laser lines. Data analysis and visualization were performed using the FlowLogic software (Inivai Technologies, Mentone, Australia).
T cell activation protocol for assessment of Th17 frequencies. Cryopreserved PBMCs were thawed in a 37 °C water bath for approximately 60 seconds, transferred into a sterile 15 mL tube and diluted dropwise with 10 mL of pre-warmed, supplemented RPMI-1640 culture medium [L-glutamine (Sigma-Aldrich), supplemented with 10% FBS (Sigma-Aldrich, USA) and 1% penicillin–streptomycin antibiotic (Capricorn Scientific GmbH, Germany)]. Following two additional washing steps, the cells were resuspended in a fresh medium, transferred to 24-well plates and placed to rest for a minimum of 24 h in an incubator (Shel Lab, CO2 Series, Sheldon manufacturing Inc., USA) at 37 °C, 5% CO2 and > 80% humidity prior to further procedures. T cell activation was carried out in 24-well plates (4 h, ~37 °C, 5% CO2, > 80% humidity level) with a commercially available cell stimulation cocktail containing phorbol 12-myristate 13-acetate (PMA) and ionomycin in a final concentration of 2 µL.mL-1 (500×; eBioscienceTM, Invitrogen by Thermo Fisher Scientific, Waltham, MA, USA). Brefeldin A solution (1, 000×; eBioscienceTM, Invitrogen by Thermo Fisher Scientific, Waltham, MA, USA) was used as an inhibitor of protein transport to the Golgi apparatus, with resulting accumulation of proteins in the endoplasmic reticulum.
Staining of intracellular and nuclear antigens for flow cytometry. Frequencies of CD4+CD25+Foxp3+ regulatory T lymphocytes and CD4+IL-17A+ T helper lymphocytes among isolated PBMCs were determined using the flow cytometry method. Sample preparation and staining protocols for intracellular antigens were modified versions of the recommended protocols (access date 13 May 2020; available at www.thermofisher.com). For intracellular staining, a Foxp3 transcription factor staining buffer set was used (eBioscienceTM, Invitrogen by Thermo Fisher Scientific). Prior to cell surface staining, dead cells were irreversibly labelled with fixable viability dye (FVD) eFluorTM 780 (eBioscienceTM, Invitrogen by Thermo Fisher Scientific, USA), and nonspecific antibody capturing by Fc receptors was blocked by the addition of rat Fc block reagent (BD Pharmigen, USA). After incubation at RT, staining with the appropriate antibody mixture was carried out depending on the cell subset of interest. To assess the frequencies of Treg, the following antibodies were used: CD3 FITC (clone: eBioG4, eBioscienceTM, Invitrogen by Thermo Fischer Scientific, USA), CD4 Pe-Cy7 (clone: W3/25, SONY Biotechnology, SJ, California), CD25 APC (clone: OX39, eBioscienceTM, Invitrogen by Thermo Fischer Scientific, USA), while the Foxp3 PE (clone: FJK-16s, eBioscienceTM, Invitrogen by Thermo Fischer Scientific, USA) antibody was used for intracellular staining of cells. Th17 lymphocytes’ rate among total peripheral blood CD4 lymphocytes was determined using PMA–ionomycin-activated PBMCs and the following mouse anti-rat antibodies: CD3 FITC (clone: eBioG4, eBioscienceTM, Invitrogen by Thermo Fischer Scientific, USA), CD4 Pe-Cy7 (clone: W3/25, SONY Biotechnology, SJ, California), and IL-17A PE (clone: eBio17B7, eBioscienceTM).
Along with careful sample preparation and optimization of staining protocols, single-stain, fluorescence minus one (FMO), un-stained and negative controls were included in our experiments in order to reliably distinguish positive cells from background/negative staining and nonspecific effects. The fluorescence compensation matrix for multicolor flow cytometry analysis was calculated using the BDTM CompBeads Anti-mouse Ig, κ/Negative Control Compensation Particle Set (BD Pharmingen, USA).
Serum- and Glucocorticoid Regulated Kinase 1 (SGK1) Assay
Relative amount of total serum- and glucocorticoid regulated kinase 1 (SGK1) in cultured cells was measured by commercially available cell-based enzyme-linked immunosorbent assay (ELISA) kit (LifeSpan BioSciences, Inc., Seattle, WA, USA) on compact absorbance reader for 96-well microplates (BioRad PR 3100 TSC), as described previously [21]. After thawing and viability check (0.4% trypan blue solution), PBMCs were counted and seeded in culture media (RPMI-1640 supplemented with 10% FBS and 1% penicillin-streptomycin antibiotic). Prior to the addition of cells, 96-well plates were coated with 100 µL of adhesive poly-l-lysine solution (0.1% in H2O) and incubated for 30 min at 37 °C. 20, 000 cells were seeded into each well in 200 µL culture media, and the plates were incubated overnight (~37 °C, 5% CO2, >80% humidity). Following incubation, we have proceeded with the protocol steps provided by the manufacturer (available at https://www.lsbio.com/elisakits/mouse-human-rat-phospho-sgk1-sgk-ser422-cell-based-phosphorylation-elisa-elisa-kit-ls-f1101/1101, accessed on 12 March 2021).
Data analysis
Differential expression analysis. Fold difference (fold change, FC) in mRNA levels was calculated using the ΔΔCt method. To reduce the effect of outliers on the analysis, fold-change values were winsorized at the 2.5th and 97.5th percentile. Genes were identified as differentially expressed if they met the Kruskal–Wallis test with a Benjamini–Hochberg false discovery rate < 0.05.
Protein-protein interactions. Protein-protein interactions were retrieved from STRING (https://string-db.org/, v11.5, Rattus norvegicus, medium confidence score) using all active interaction sources. Only uniquely mapped proteins that exhibited differential abundances were searched for their involvement.
Metabolic pathways. MetScape v3.1.2 application was used to upload a list of compounds (Kyoto Encyclopedia of Genes and Genomes IDs), identify pathways, and build a metabolic network where nodes represent metabolites and direct edges represent biochemical reactions (organism: rat, Cytoscape v3.7.1). Values that were missing because they were below the lower limit of quantification were replaced by one-fifth of the smallest measured value. FCs were calculated as the ratios between two group medians using raw data before normalization was applied.
For prioritization, filtered data were cube-root transformed, and then each metabolite was ranked by its variable importance in projection score via partial least squares-discriminative analysis [34] (MetaboAnalyst 4.0, https://www.metaboanalyst.ca). A debiased sparse partial correlation network was constructed using input metabolites as nodes, while the edges represent the association measures which passed a false discovery rate < 0.05 (Fruchterman–Rheingold layout) (25).
Enrichment analysis. Lists of differentially expressed proteins were 1:1 mapped to their human orthologues and analyzed for overrepresented pathways using the Enrichr tool (https://maayanlab.cloud/Enrichr/enrich, min. size ≥ 2) (Suppl. Table 2). Hallmark (H) 2020 curated (C2, Reactome 2016) and gene ontology (Biological Process 2021, C5) gene sets from MSigDB (v7.4) were used for annotation (www.gsea-msigdb.org/gsea/msigdb)[3, 26, 27]. Computation of adjusted P-values (hypergeometric test) was conducted as previously described in detail (29).
Statistical analysis. If not otherwise stated, we assumed non-Gaussian distributions and heteroscedastic errors. Continuous data are presented as median with interquartile range. For two independent groups, the Mann–Whitney U test was used. To compare multiple groups, the Kruskal–Wallis test was applied with Conover’s post-hoc test (PMCMRplus v1.9.0). All P-values are two-tailed. Where appropriate, multiple testing correction was employed using the Benjamini–Hochberg procedure at a false discovery rate < 0.05 and < 0.001. Specific statistical details for each of the figures (including the number of replicates, P-value representation and experimental design) can be found within the figure captions. No new codes were generated by this study. All analyses were performed in R software v4.0.2 (www.r-project.org) using the RStudio v 1.2.5001 environment (Rstudio Inc., Boston, MA, USA). Certain figures were generated using the RcolorBrewer (v1.1-2), ggubr (v0.4.0) and tidyverse (v.1.3.0) packages.
Results
Gene expression of cytokines, chemokines and cell adhesion molecules in bulk surface cerebral blood vessels of Sprague Dawley rats following short-term salt loading
At the end of the study protocol, the blood pressure and the body mass of all animals used in this study were similar, thus providing evidence that all examinations and observed HDS-specific effects were independent from the known salt-loading effect on blood pressure and water retention (Suppl. Table 3). Short-term salt loading resulted in significantly (p<0.05) increased Il6 gene expression compared to animals that were fed the (LSD) (Fig. 1). The gene expression levels of Sele and Vcam1 were increased following HSD; however, due to high interindividual variability the data did not meet statistical significance (p=0.06” and p=0.48, respectively). The mRNA levels of other assessed genes encoding cytokines, chemokines and cell adhesion molecules were not significantly affected by short-term salt loading.
Here we provide evidence for the earliest transcriptome signature of inflammatory remodeling in microcirculation of HSD-fed animals.
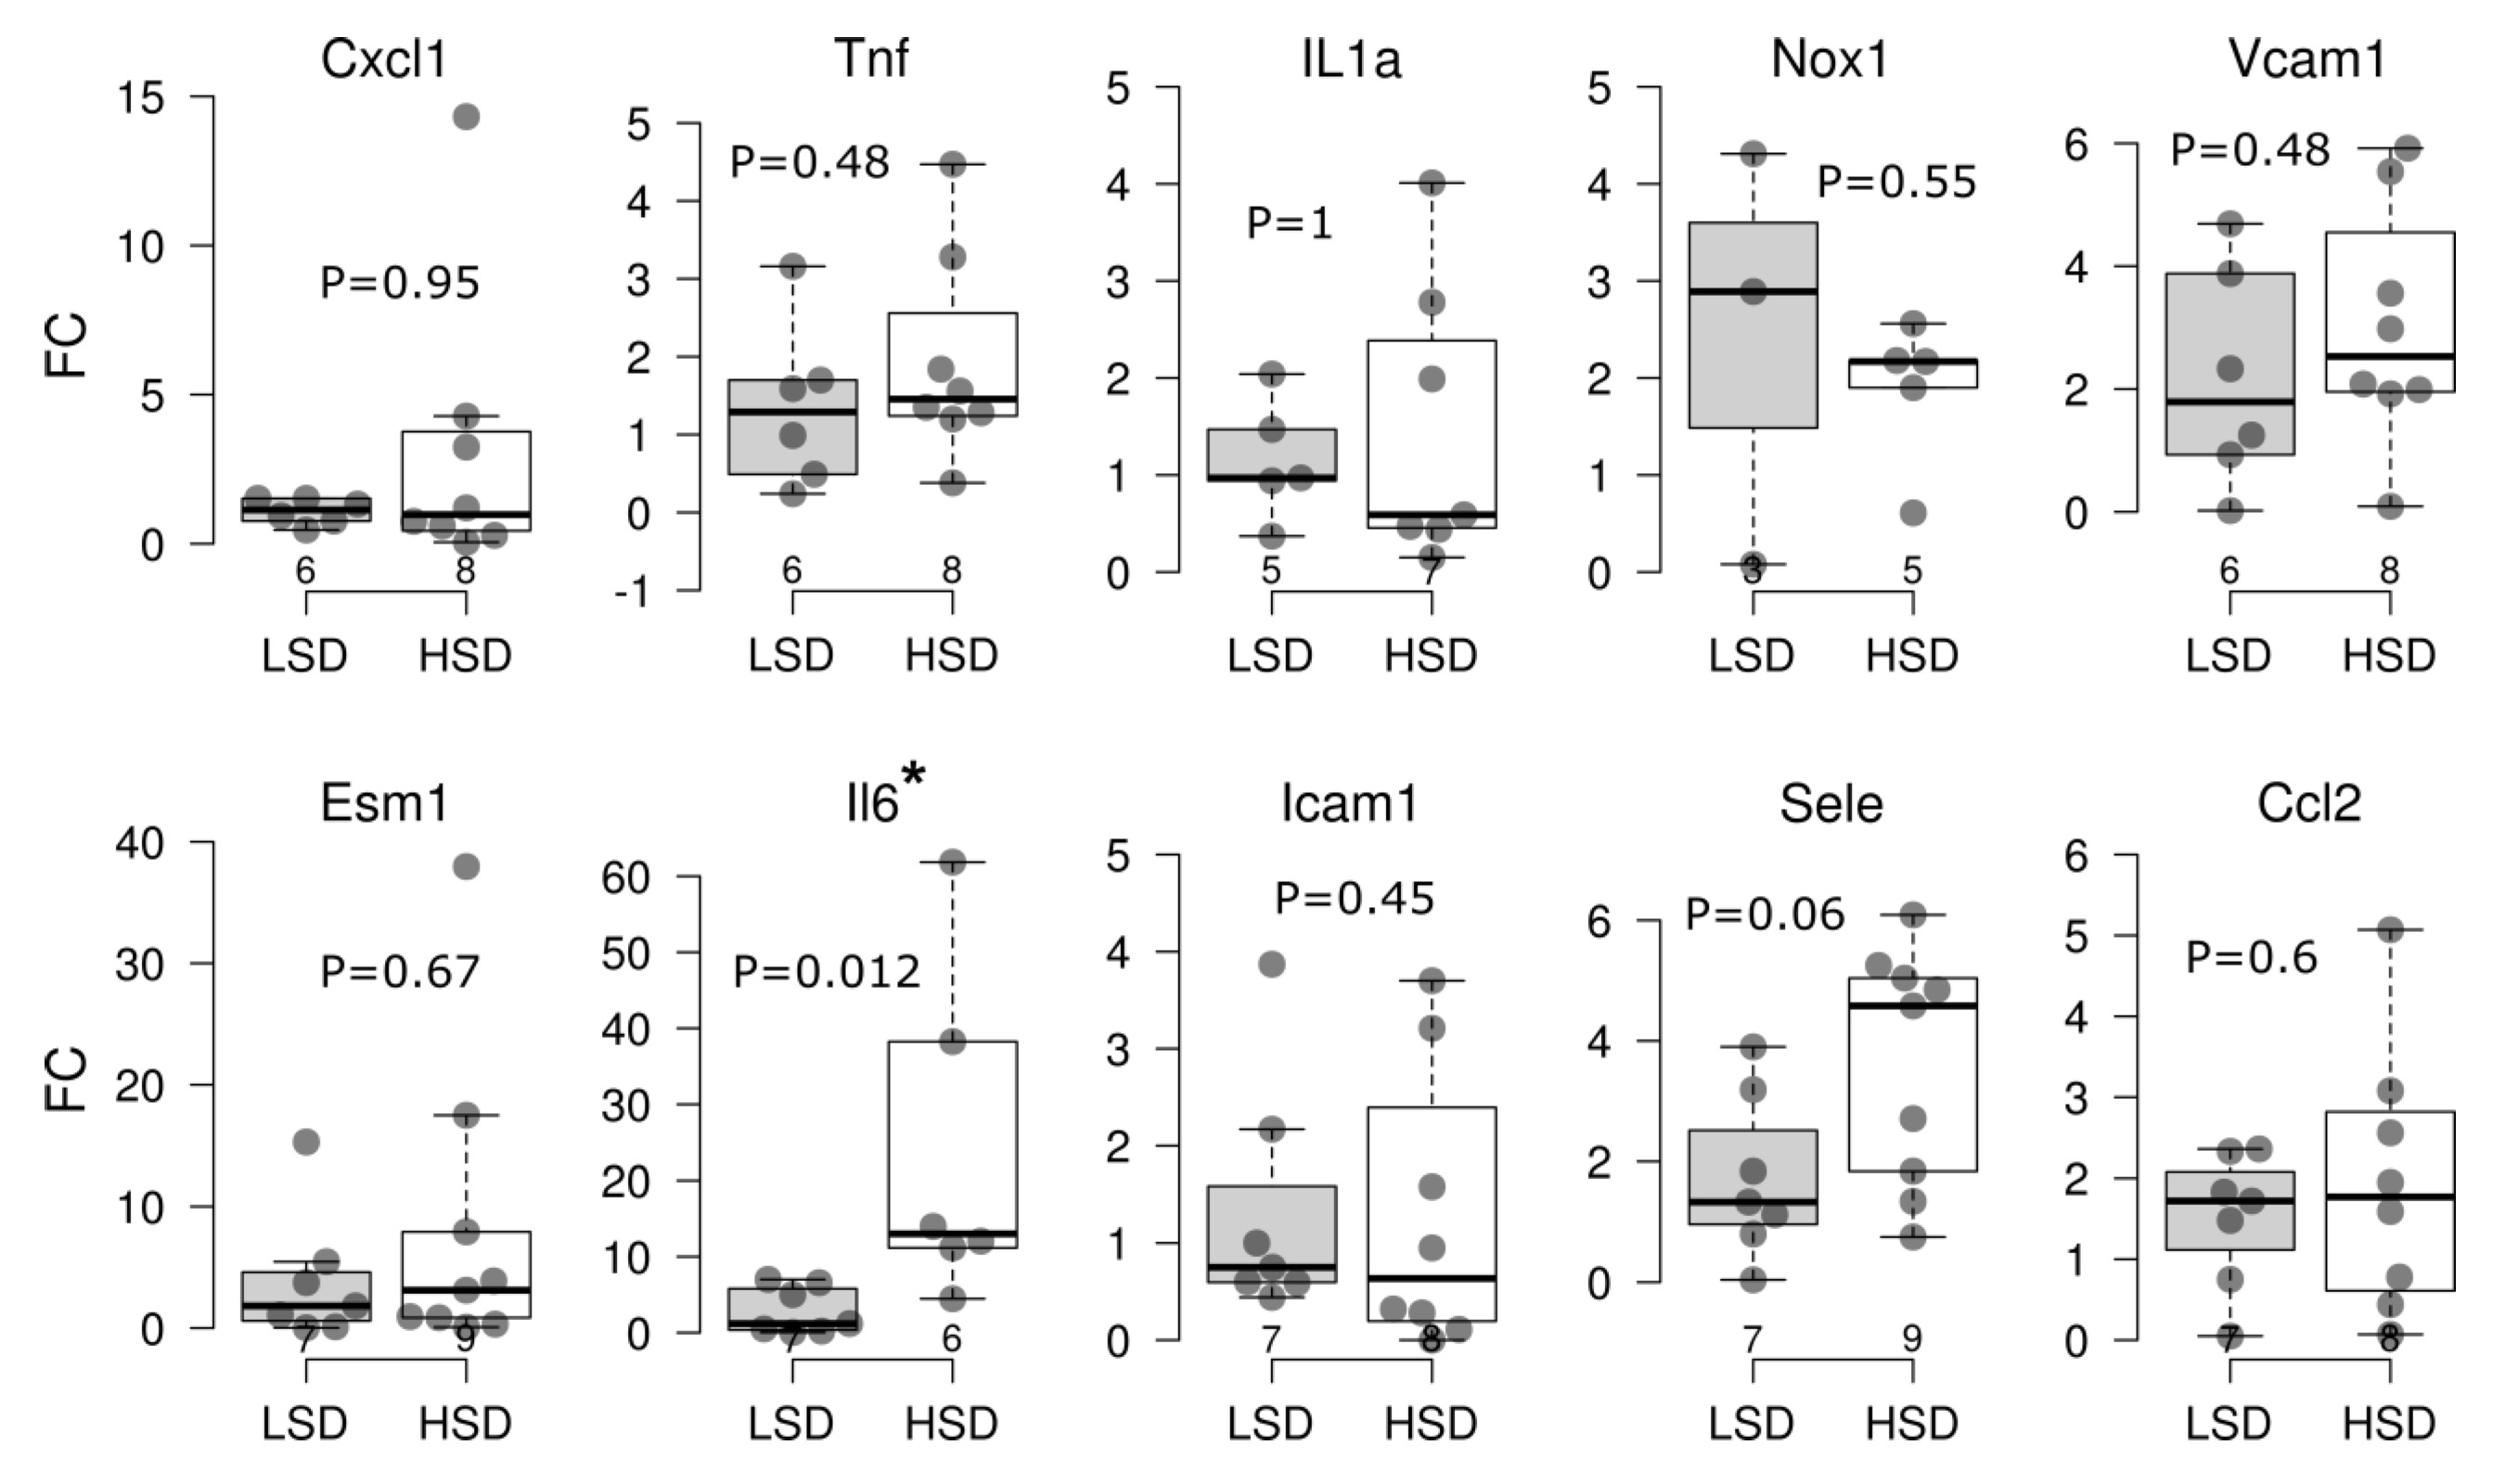
Fig. 1: Key pro-inflammatory cytokine, chemokine and cell adhesion molecule gene expression in brain blood vessels of Sprague Dawley rats after a 7-day high-salt diet. Boxplots showing fold change (FC, qRT-PCR analysis, ΔΔCt method) of indicated gene expression following treatment with high-salt (HSD) versus low-salt diet (LSD) in Sprague Dawley rats. Each dot represents one animal. Gene-wise significance was tested using the Mann–Whitney U test (P). The Benjamini–Hochberg procedure was used to control the false discovery rate, and statistical significance was defined as Pa < 0.05. Gene names: The Rat Genome Database (rgd.mcw.edu). The lower and upper edges of a box represent the first (Q1) and third quartiles (Q3), respectively; the horizontal line inside the box indicates the median (M); the whiskers extend to the most extreme values inside inner fences, M .5(Q3 − 1); and the circles represent values outside the inner fences (outliers). The number of replicates is shown in the bottom row. *P<0.05, **P<0.01, ***P<0.005, ****P < 0.001
The effect of short-term high-salt diet on serum cytokine and chemokine levels – increased levels of TNF α following 7-day high-salt diet are reversed to control values by administration of ANGII
In the present study, serum concentrations of key pro-inflammatory cytokines, chemokines and soluble cell adhesion molecules were determined and compared among study groups, revealing that only serum TNFα levels were significantly altered by the dietary intervention. Namely, in the HSD group of rats there were significantly increased serum levels of TNFα, compared to the levels found in their LSD-fed counterparts (Fig. 2). Restoration of serum ANGII levels resulted in reversal of serum TNFα levels back to control values. Based on these data, the vascular wall inflammation as assessed by targeted transcriptomics, did not contribute significantly to the systemic burden of pro-inflammatory mediators in circulation.
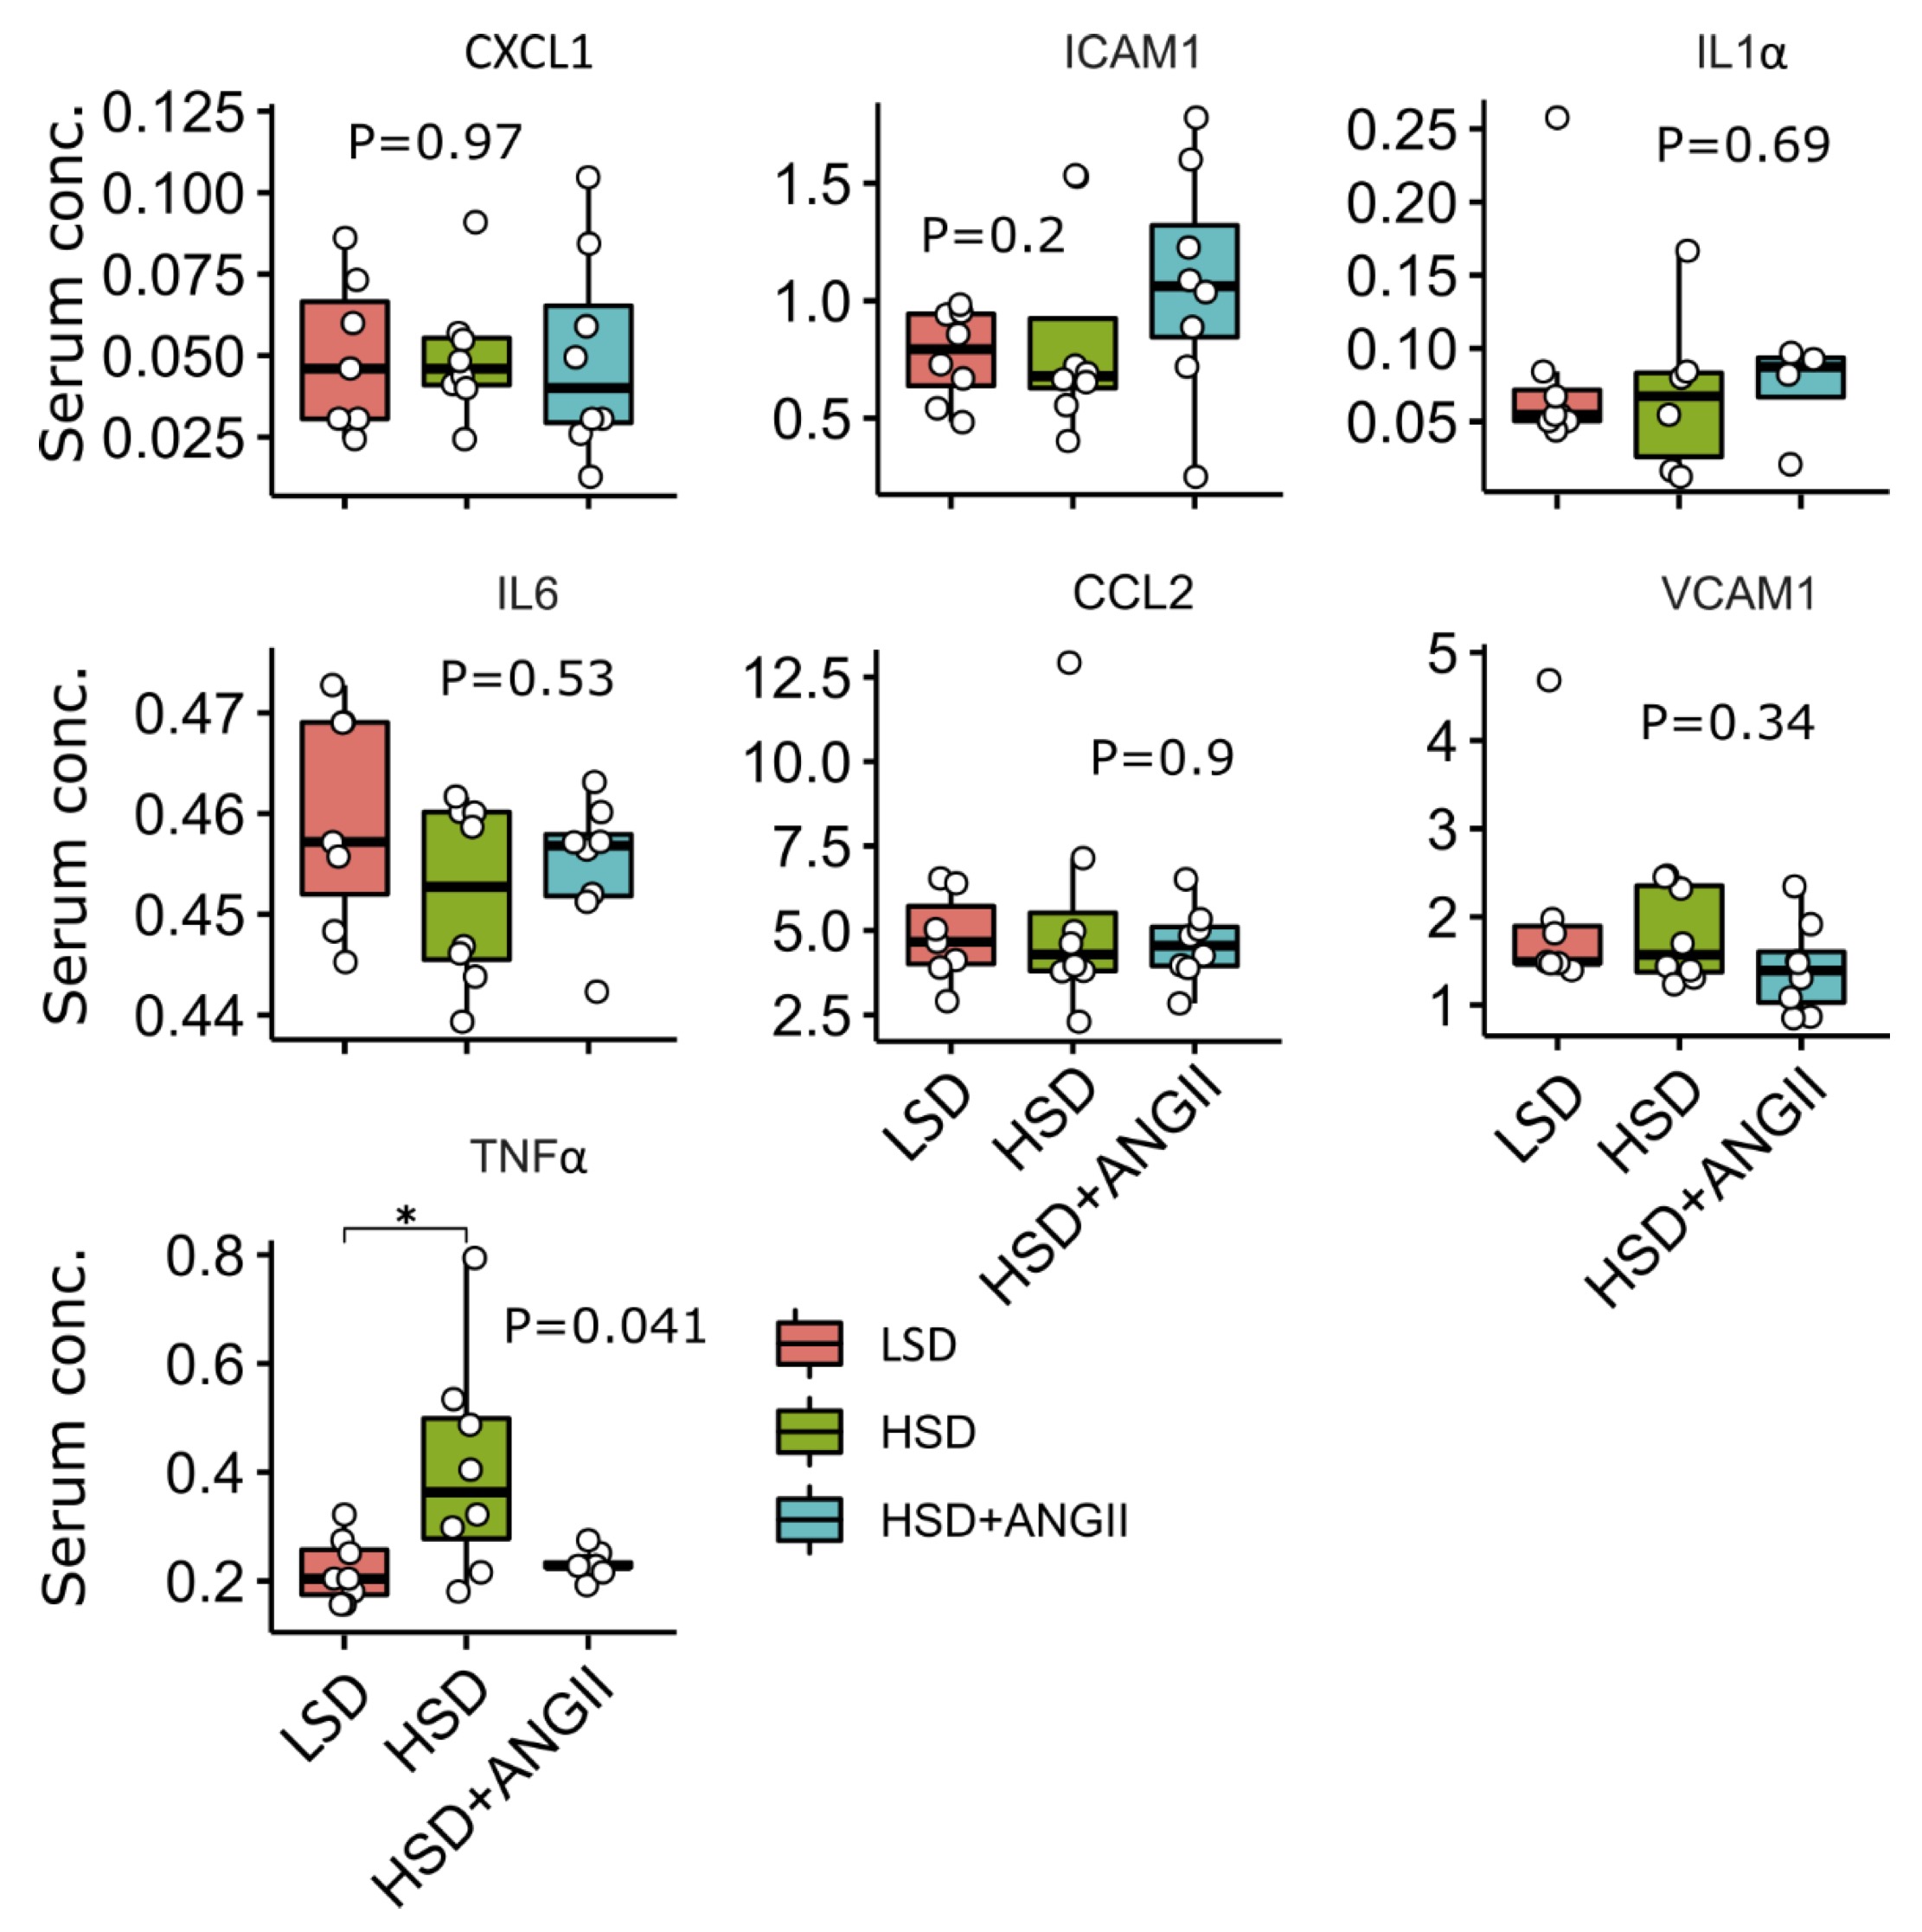
Fig. 2: Serum levels of key pro-inflammatory cytokines, chemokines and soluble cell adhesion molecules following 7-day high-salt diet with/without angiotensin II (ANGII) infusion in Sprague Dawley rats. Luminex analysis, the distribution of selected targets following treatment with high-salt diet (HSD), and HSD + ANGII versus low-salt diet (LSD) in Sprague Dawley rats. The lower and upper edges of a box represent the first (Q1) and third quartiles (Q3), respectively; the horizontal line inside the box indicates the median (M); the whiskers extend to the most extreme values inside inner fences, M .5(Q3 − 1); and the circles represent values outside the inner fences (outliers). Each dot represents a single rat. Group-wise significance was tested using the Kruskal–Wallis test (P), followed by Conover’s post-hoc test (horizontal brackets, pairwise differences). *P < 0.05, **P < 0.01. Non-significant P-values were suppressed. All measured parameters are presented in unit ng/mL, except TNF-alpha in pg/mL. GRO alias CXCL1.
Serum fatty acid profile is altered in Sprague Dawley rats on HSD
The mean fatty acid composition of serum phospholipids is given in Fig. 3 and 4. In the control, LSD group of rats, polyunsaturated fatty acids (PUFA) accounted for the majority of total serum fatty acid species, followed by saturated fatty acids (SFA), one-third and monounsaturated fatty acids (MUFA, one-fifth). HSD resulted in significantly increased levels of MUFA and, to a modest degree, SFA compared to the LSD group, while the infusion of ANGII almost completely abolished these effects. Overall, the estimated change in values was limited (0.87 < FC < 1.15). Closer inspection of specific MUFA and PUFA serum concentrations revealed the accumulation of palmitoleic acid (C16:1 ω-7, FC = 1.9), while the levels of linoleic acid (C18:2 ω-6, FC = 0.74) and α-linolenic acid (C18:3 ω-3, FC = 0.63) were significantly reduced under short-term salt loading (Fig. 4A).
ANGII infusion in HSD rats reversed the serum concentration of linoleic and palmitoleic acid to control values (Fig. 4A), and ANGII infusion had no effect on α-linolenic acid serum levels. The analysis of variable importance in projection scores confirmed that palmitoleic, linoleic, and α-linolenic acid were the most important metabolites segregating the HSD group from the LSD group, suggesting that all three pathways (ω-3, ω-6, and ω-7) are implicated (Fig. 4B and 4C). By contrast, the saturated species under study were more evenly distributed, contravening overall increased serum SFA content in salt-loaded animals, indicating that the selected FA species were not sufficient to explain aggregate SFA and PUFA kinetics under HSD. Clearly, the selected metabolites provide only partial coverage of serum lipidomics under the HSD, paving the way for fine-grained research.
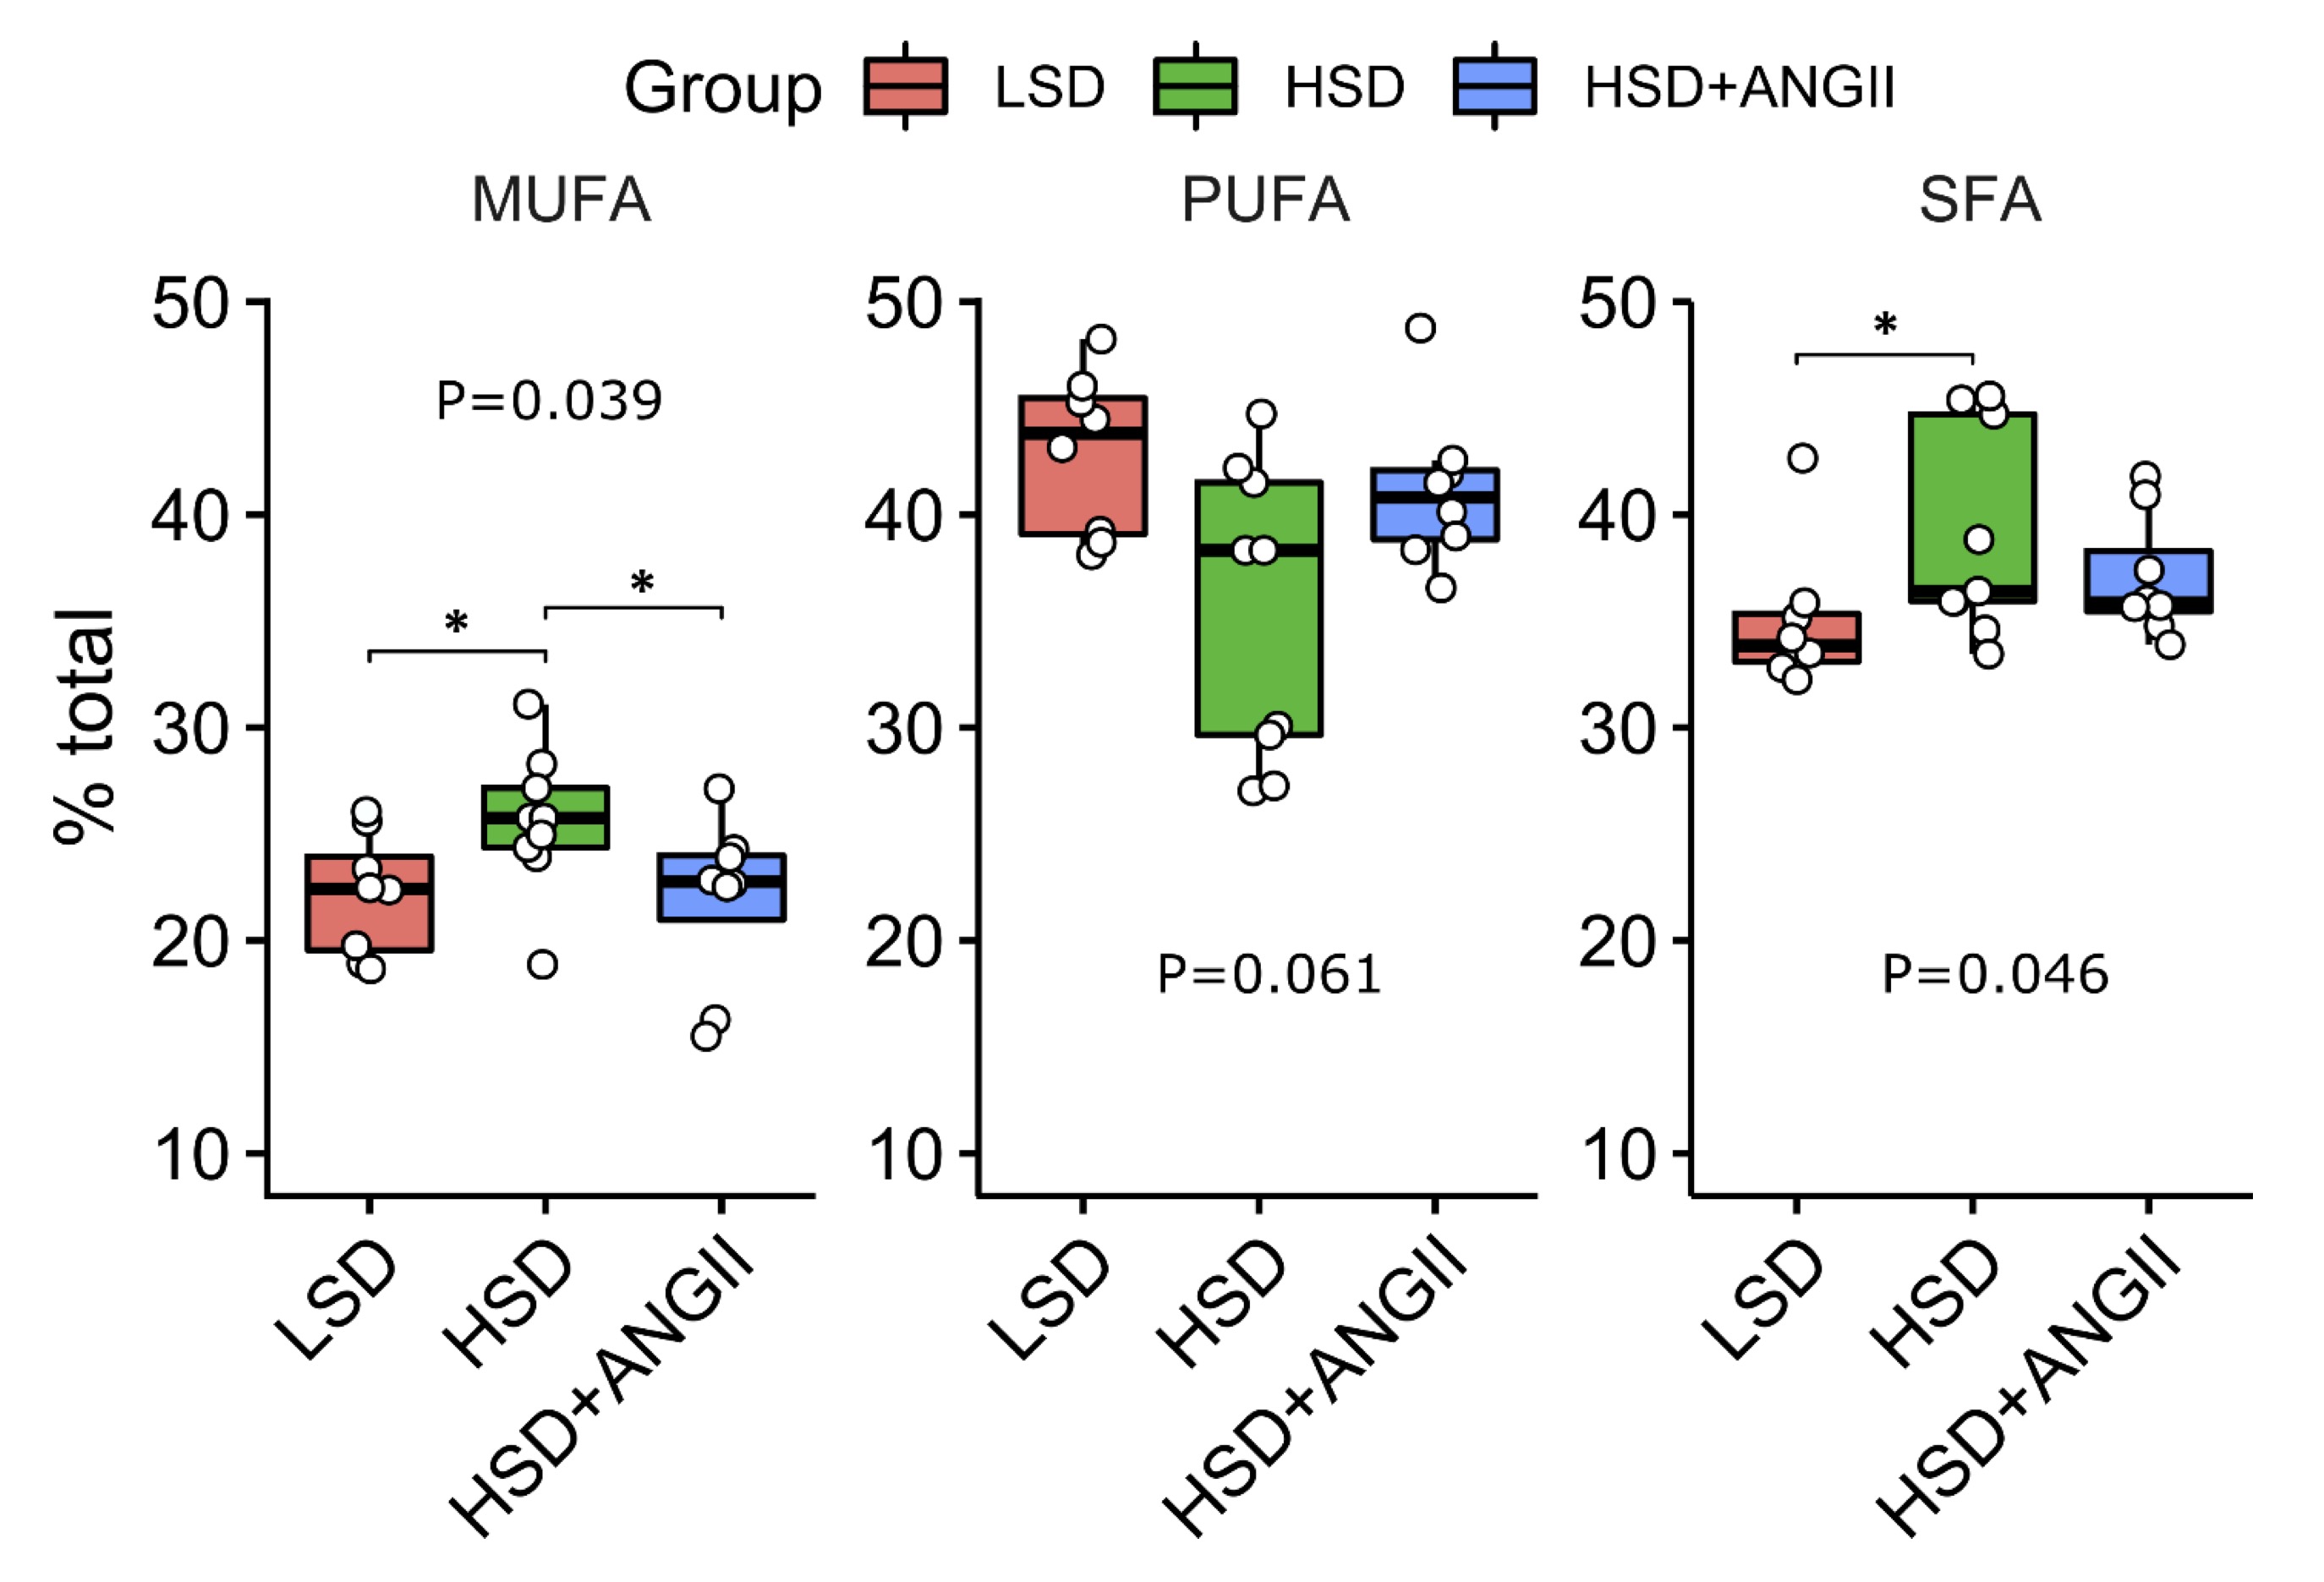
Fig. 3: Distribution of serum fatty acids (FA) after short-term salt loading with/without angiotensin II infusion in Sprague Dawley rats. The distribution of serum fatty acids for each treatment combination – low-salt diet (LSD), high-salt diet (HSD); HSD + angiotensin II infusion (HSD + ANGII). The lower and upper edges of a box represent the first (Q1) and third quartiles (Q3), respectively; the horizontal line inside the box indicates the median (M); the whiskers extend to the most extreme values inside inner fences, M .5(Q3 − 1); and the circles represent values outside the inner fences (outliers). Each dot represents one animal. Group-wise significance was tested using the Kruskal–Wallis test (P). Horizontal brackets indicate significant pairwise differences (Conover’s post-hoc test, *P<0.05). Non-significant P-values were suppressed. Monounsaturated fatty acids (MUFA), polyunsaturated fatty acids (PUFA), saturated fatty acids (SFA).
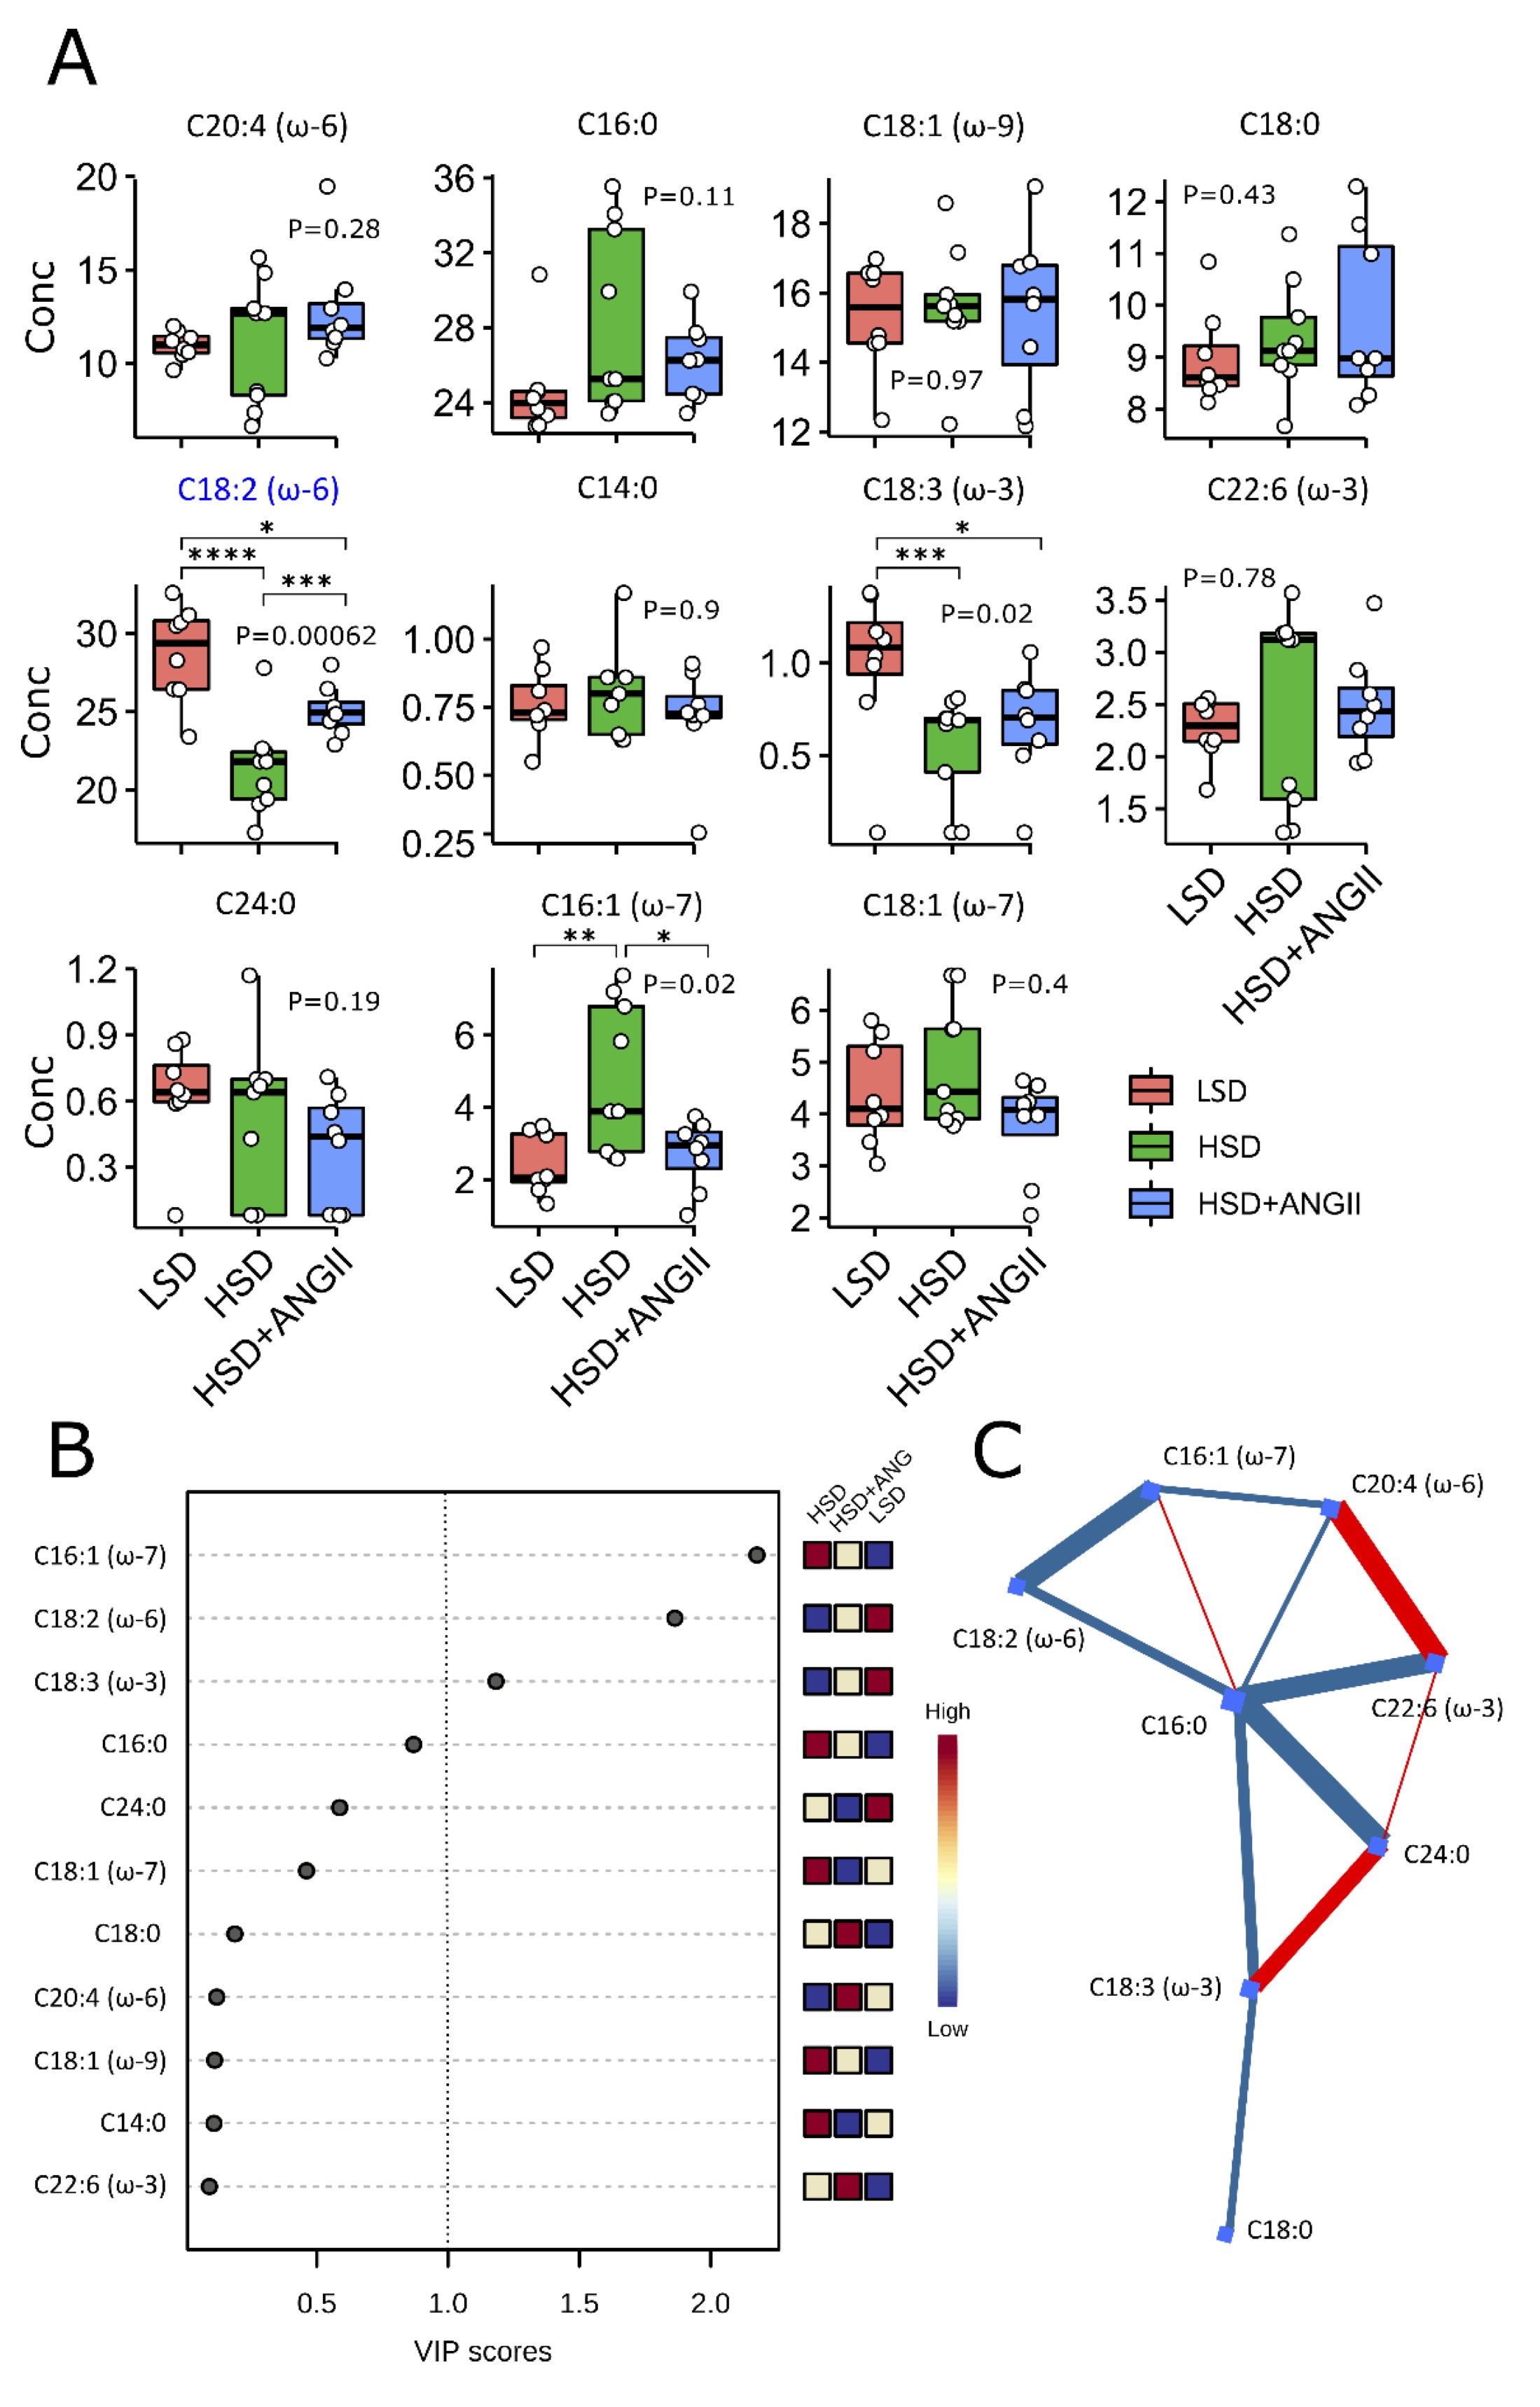
Fig. 4: The effect of 7-day high-salt diet-induced RAS suppression on the serum serum fatty acids profile. Panel A The boxes summarize the distribution of selected fatty acids for each treatment combination – low-salt diet (LSD), high-salt diet (HSD); HSD + angiotensin II infusion (HSD + ANGII) (lipid numbers). The lower and upper edges of a box represent the first (Q1) and third quartiles (Q3), respectively; the horizontal line inside the box indicates the median (M); the whiskers extend to the most extreme values inside inner fences, M .5(Q3 − 1); and the circles represent values outside the inner fences (outliers). Each dot represents a single rat. Group-wise significance was tested using the Kruskal–Wallis test (P). Blue color indicates associations surviving the Benjamini–Hochberg correction (PBH < 0.05). Horizontal brackets indicate significant pairwise differences (Conover’s post-hoc test, *P<0.05, **P<0.01, ***P<0.005, ****P<0.001). Non-significant P-values were suppressed. Panel B Variable importance in projection (VIP) scores of metabolites by partial least squares discriminant analysis (PLS-DA) comparing different treatment groups. The importance of a metabolite in the model is measured by the VIP score, indicating its intensity of association with the PLS-DA components that best distinguish the groups. VIP scores > 1 are highlighted, recapitulating the results of nonparametric associations. The columns to the right indicate whether the abundance of each metabolite is enhanced (red) or reduced (blue) in each group. Values below the level of quantitation (missing values, n = 7, 2.5 %) were replaced by 1/5 of min. positive values of their corresponding variables. Panel C Correlation-based connectome (Fruchterman–Reingold layout) representing the network of debiased sparse partial correlations among the metabolites. Nodes (fatty acids) are shown as blue squares, and have blue and red edges for those detected in negative and positive modes, respectively (false discovery rate P<0.05). Edge thickness is proportional to the strength of the association. Lipid numbers are available in Suppl. Table 1.
Increased frequencies of recently activated (CD4+CD25int) and regulatory (CD4+CD25highFoxp3+) T cells with no changes in Th17 subpopulation in mesenteric lymph nodes of Sprague Dawley rats on a HSD
In the present study, we have assessed the frequencies of regulatory T cells (Treg) characterized by the CD25highFoxp3+ phenotype and recently activated T cells (CD4+CD25int) among the CD3+CD4+ and CD3+ T cell population in mesenteric lymph nodes (MLN), respectively (Fig. 6A-D). The frequencies of total CD3+ T cells and CD3+CD4+ (the majority corresponding to T helper cells) were not affected by the 7-day HSD, but interestingly, HSD-fed animals receiving ANGII infusions presented with peripheral CD3+ T cell pool expansion (Fig. 5D), which correlated with the increased frequencies of non-CD4 T cells. Furthermore, the frequencies of recently activated CD4+CD25int T cells were significantly enriched in the mesenteric lymph nodes of Sprague Dawley rats following 7-day salt loading (Fig. 5D), an effect that was completely abolished by ANGII infusions. Short-term salt loading resulted in Treg expansion, as evidenced by increased frequencies of CD4+CD25high T cells (Fig. 5D) and CD4+CD25highFoxp3+ (% of CD3+CD4+ and CD3+ lymphocytes; Fig. 5E; p values are denoted at corresponding plots). Frequencies of Treg cells were reversed by the additional ANGII, even below control values (Fig. 5D and 5E). Distribution of Th17 and IL-17 secreting non-CD4 T cells in MLN was not affected by the HSD or by any of the treatment combinations.
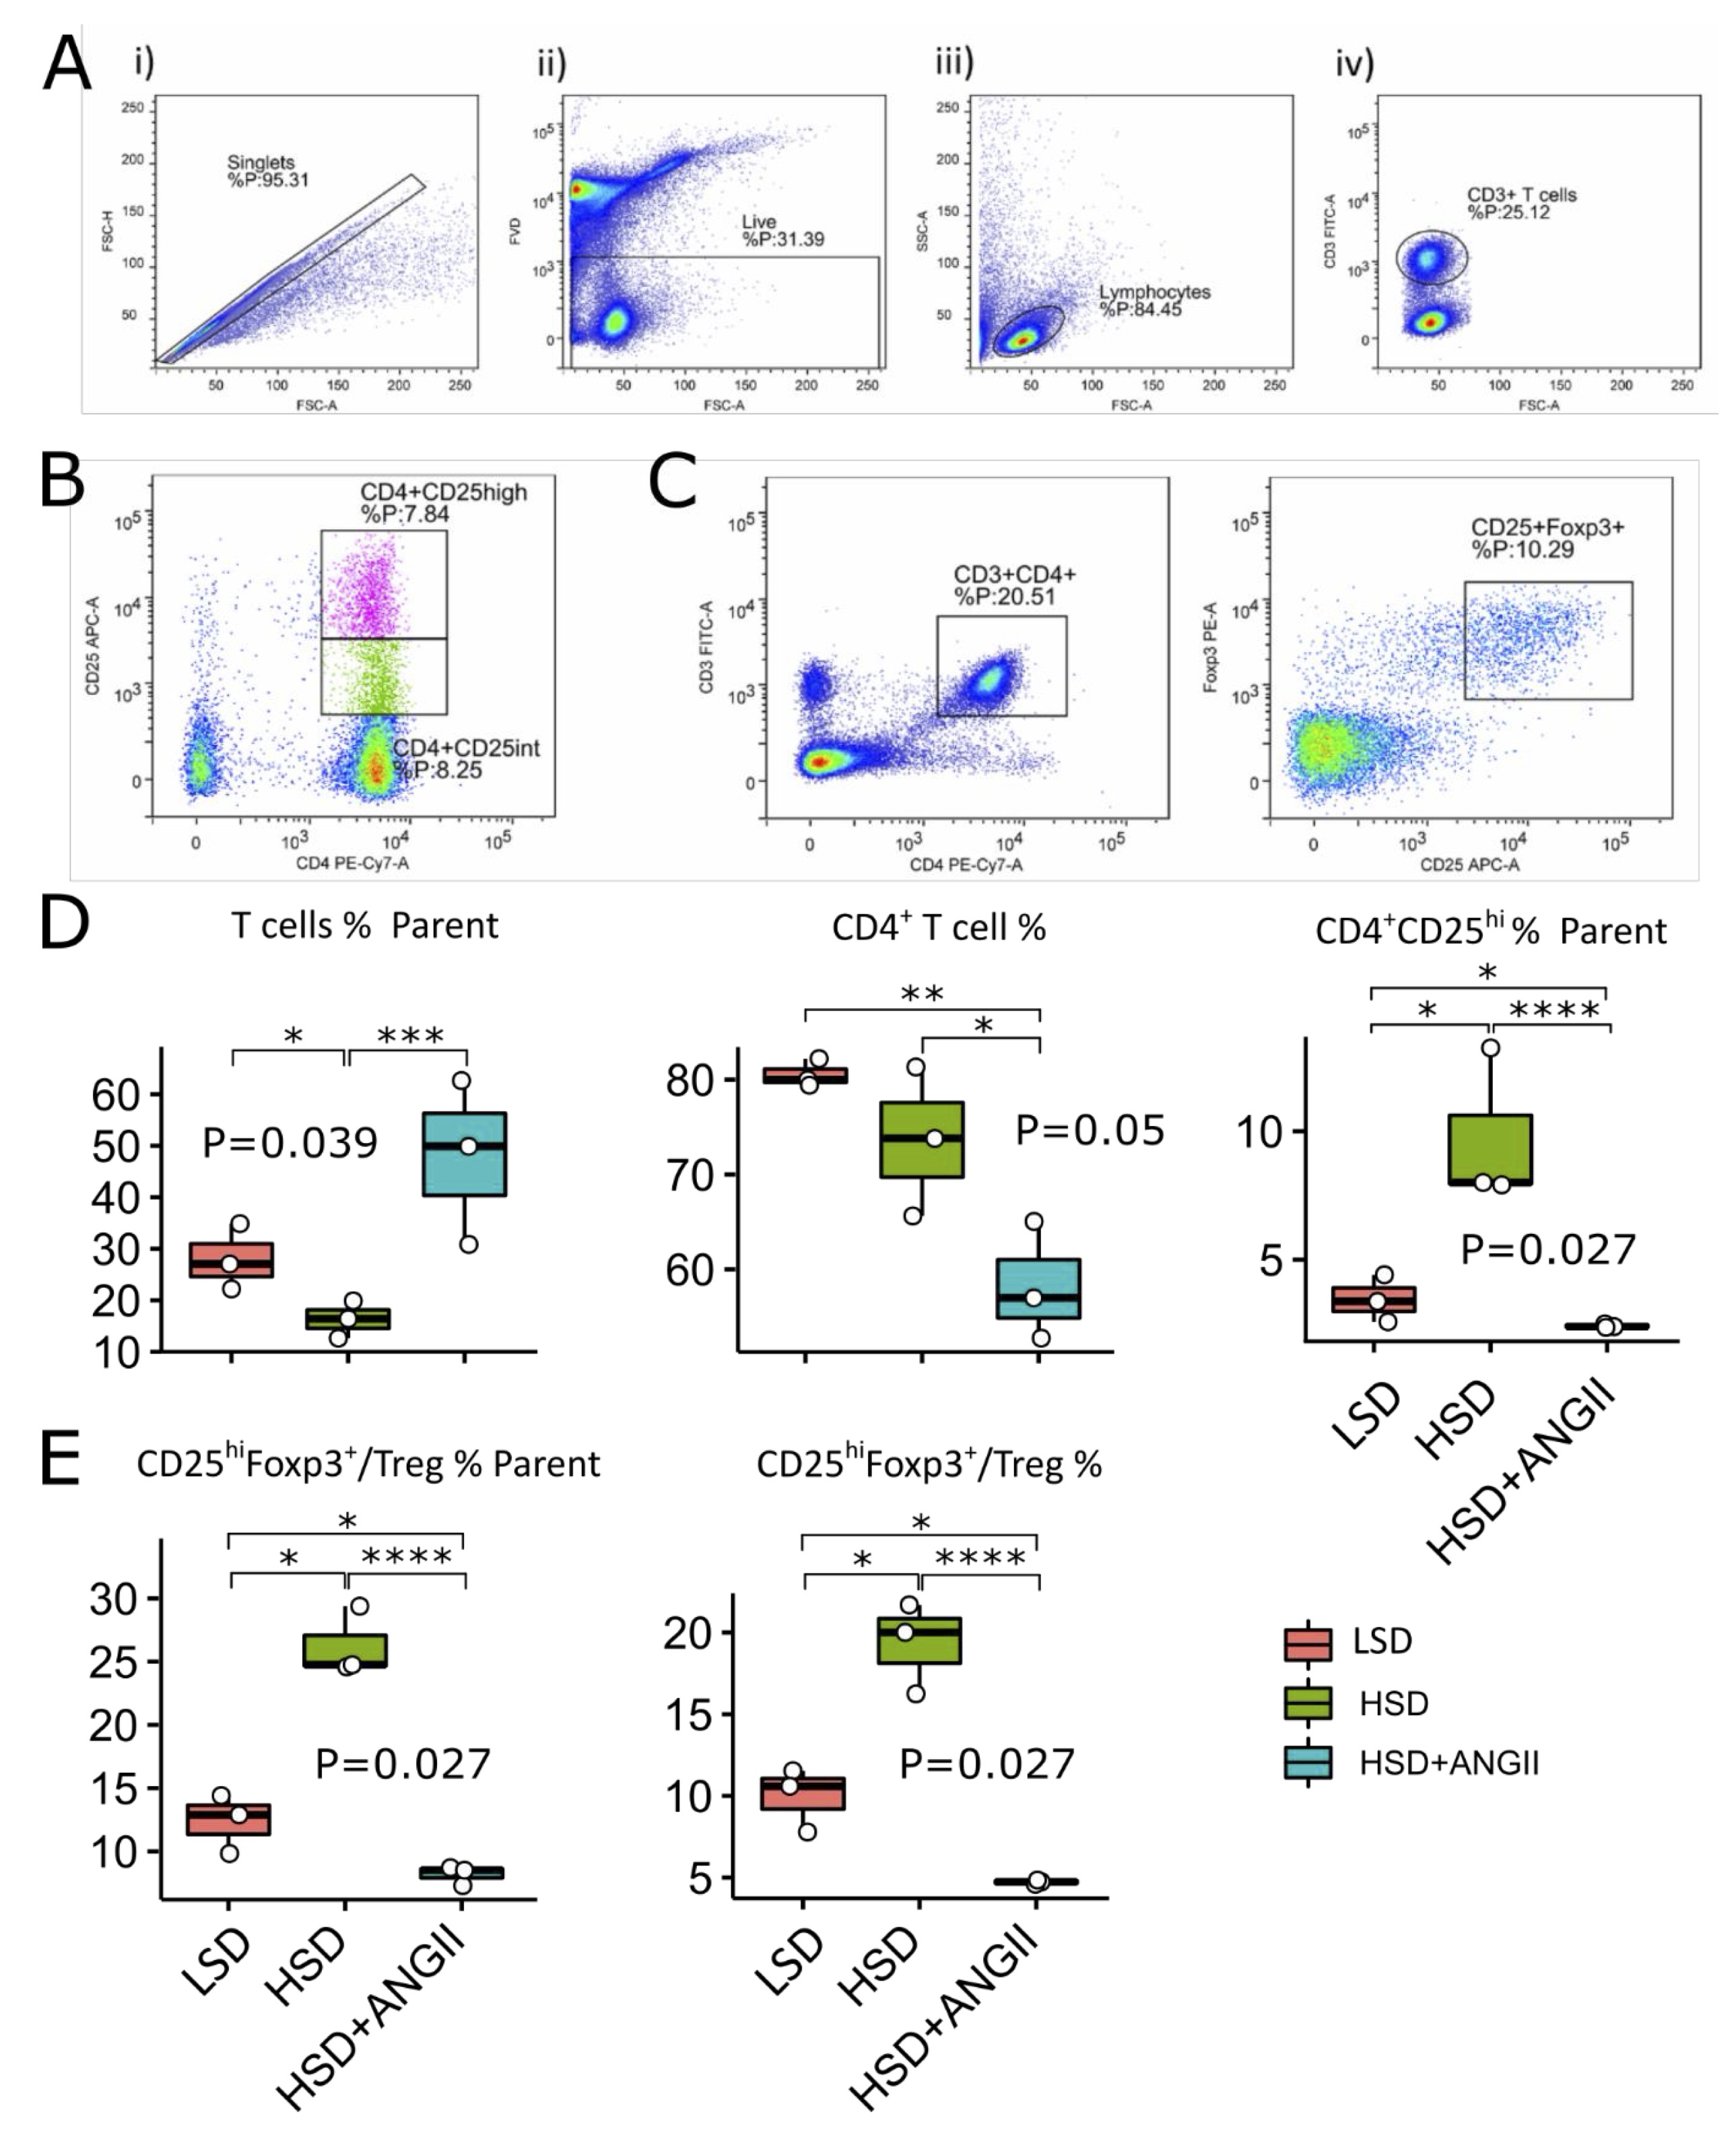
Fig. 5: Distribution of mesenteric lymph node regulatory T cells (Treg) and recently activated CD4 cells following 7-day high-salt diet with/without angiotensin II supplementation in Sprague Dawley (SD) rats. The distribution of T cell subpopulations in mesenteric lymph nodes of SD rats exposed to 7-day low-salt (LSD) or high-salt (HS) diet alone or in combination with angiotensin II (ANGII; HSD + ANGII). Panel A shows representative dot plots illustrating gating strategy, including exclusion of doublets using forward scatter area (FSC-A) versus forward scatter width (FSC-W) analysis (A-i), gating on live cells negative for amine-reactive fixable viability dye (A-ii), lymphocytes (A-iii) and CD3+ T cells (A-iv). T cells were further analyzed for CD4 and CD25 expression (CD4+CD25int – recently activated T cells and CD4+CD25high T Treg, Panel B and D or CD25 and Foxp3 expression (CD25highFoxp3+ – Treg, Panel C and E). The lower and upper edges of a box represent the first (Q1) and third quartiles (Q3), respectively; the horizontal line inside the box indicates the median (M); the whiskers extend to the most extreme values inside inner fences, M .5(Q3 − 1); and the circles represent values outside the inner fences (outliers). Each dot represents one animal. Group-wise significance was tested using the Kruskal–Wallis test (P), followed by Conover’s post-hoc test (horizontal lines, pairwise differences). *P<0.05, **P<0.01, ***P<0.005, ****P<0.001). Non-significant P-values were suppressed.
Short-term salt loading did not affect the rates of peripheral Th17 cells and Treg but induced expansion of peripheral non Th lymphocytes secreting IL-17 and recently activated Th cells
An interesting finding of this study was the expansion of CD3+ T cells within the peripheral lymphocyte pool following 7-day HSD (Fig. 6B). Treatment of HSD-fed animals with ANGII infusion had no additional effect on the size of peripheral CD3 T cell compartment (Fig. 6B). Unlike in the MLN, in the peripheral blood we did not find significant changes in Treg frequencies within the CD3+CD4+ T-cell pool (Suppl. Fig. 1B), nor was there any significant change in CD4+CD25int recently activated T-cell subpopulation following the 7-day HSD. Interestingly, the addition of ANGII to the HSD resulted in CD4+CD25int T cell expansion at the periphery (Suppl. Fig. 1B; p-values are denoted at corresponding plots). The proportion of peripheral Th17 (CD3+CD4+IL-17+) cells was slightly increased following the HSD; however, these changes did not reach statistical significance (Fig. 6C). An incidental finding of this study was the expansion of non-CD4 IL-17 secreting T cell within the lymphocyte pool (Fig. 6C). These cells probably correspond to CD8 T cells; however, this was not further explored, since our primarily focus was on the Th17/Treg balance.
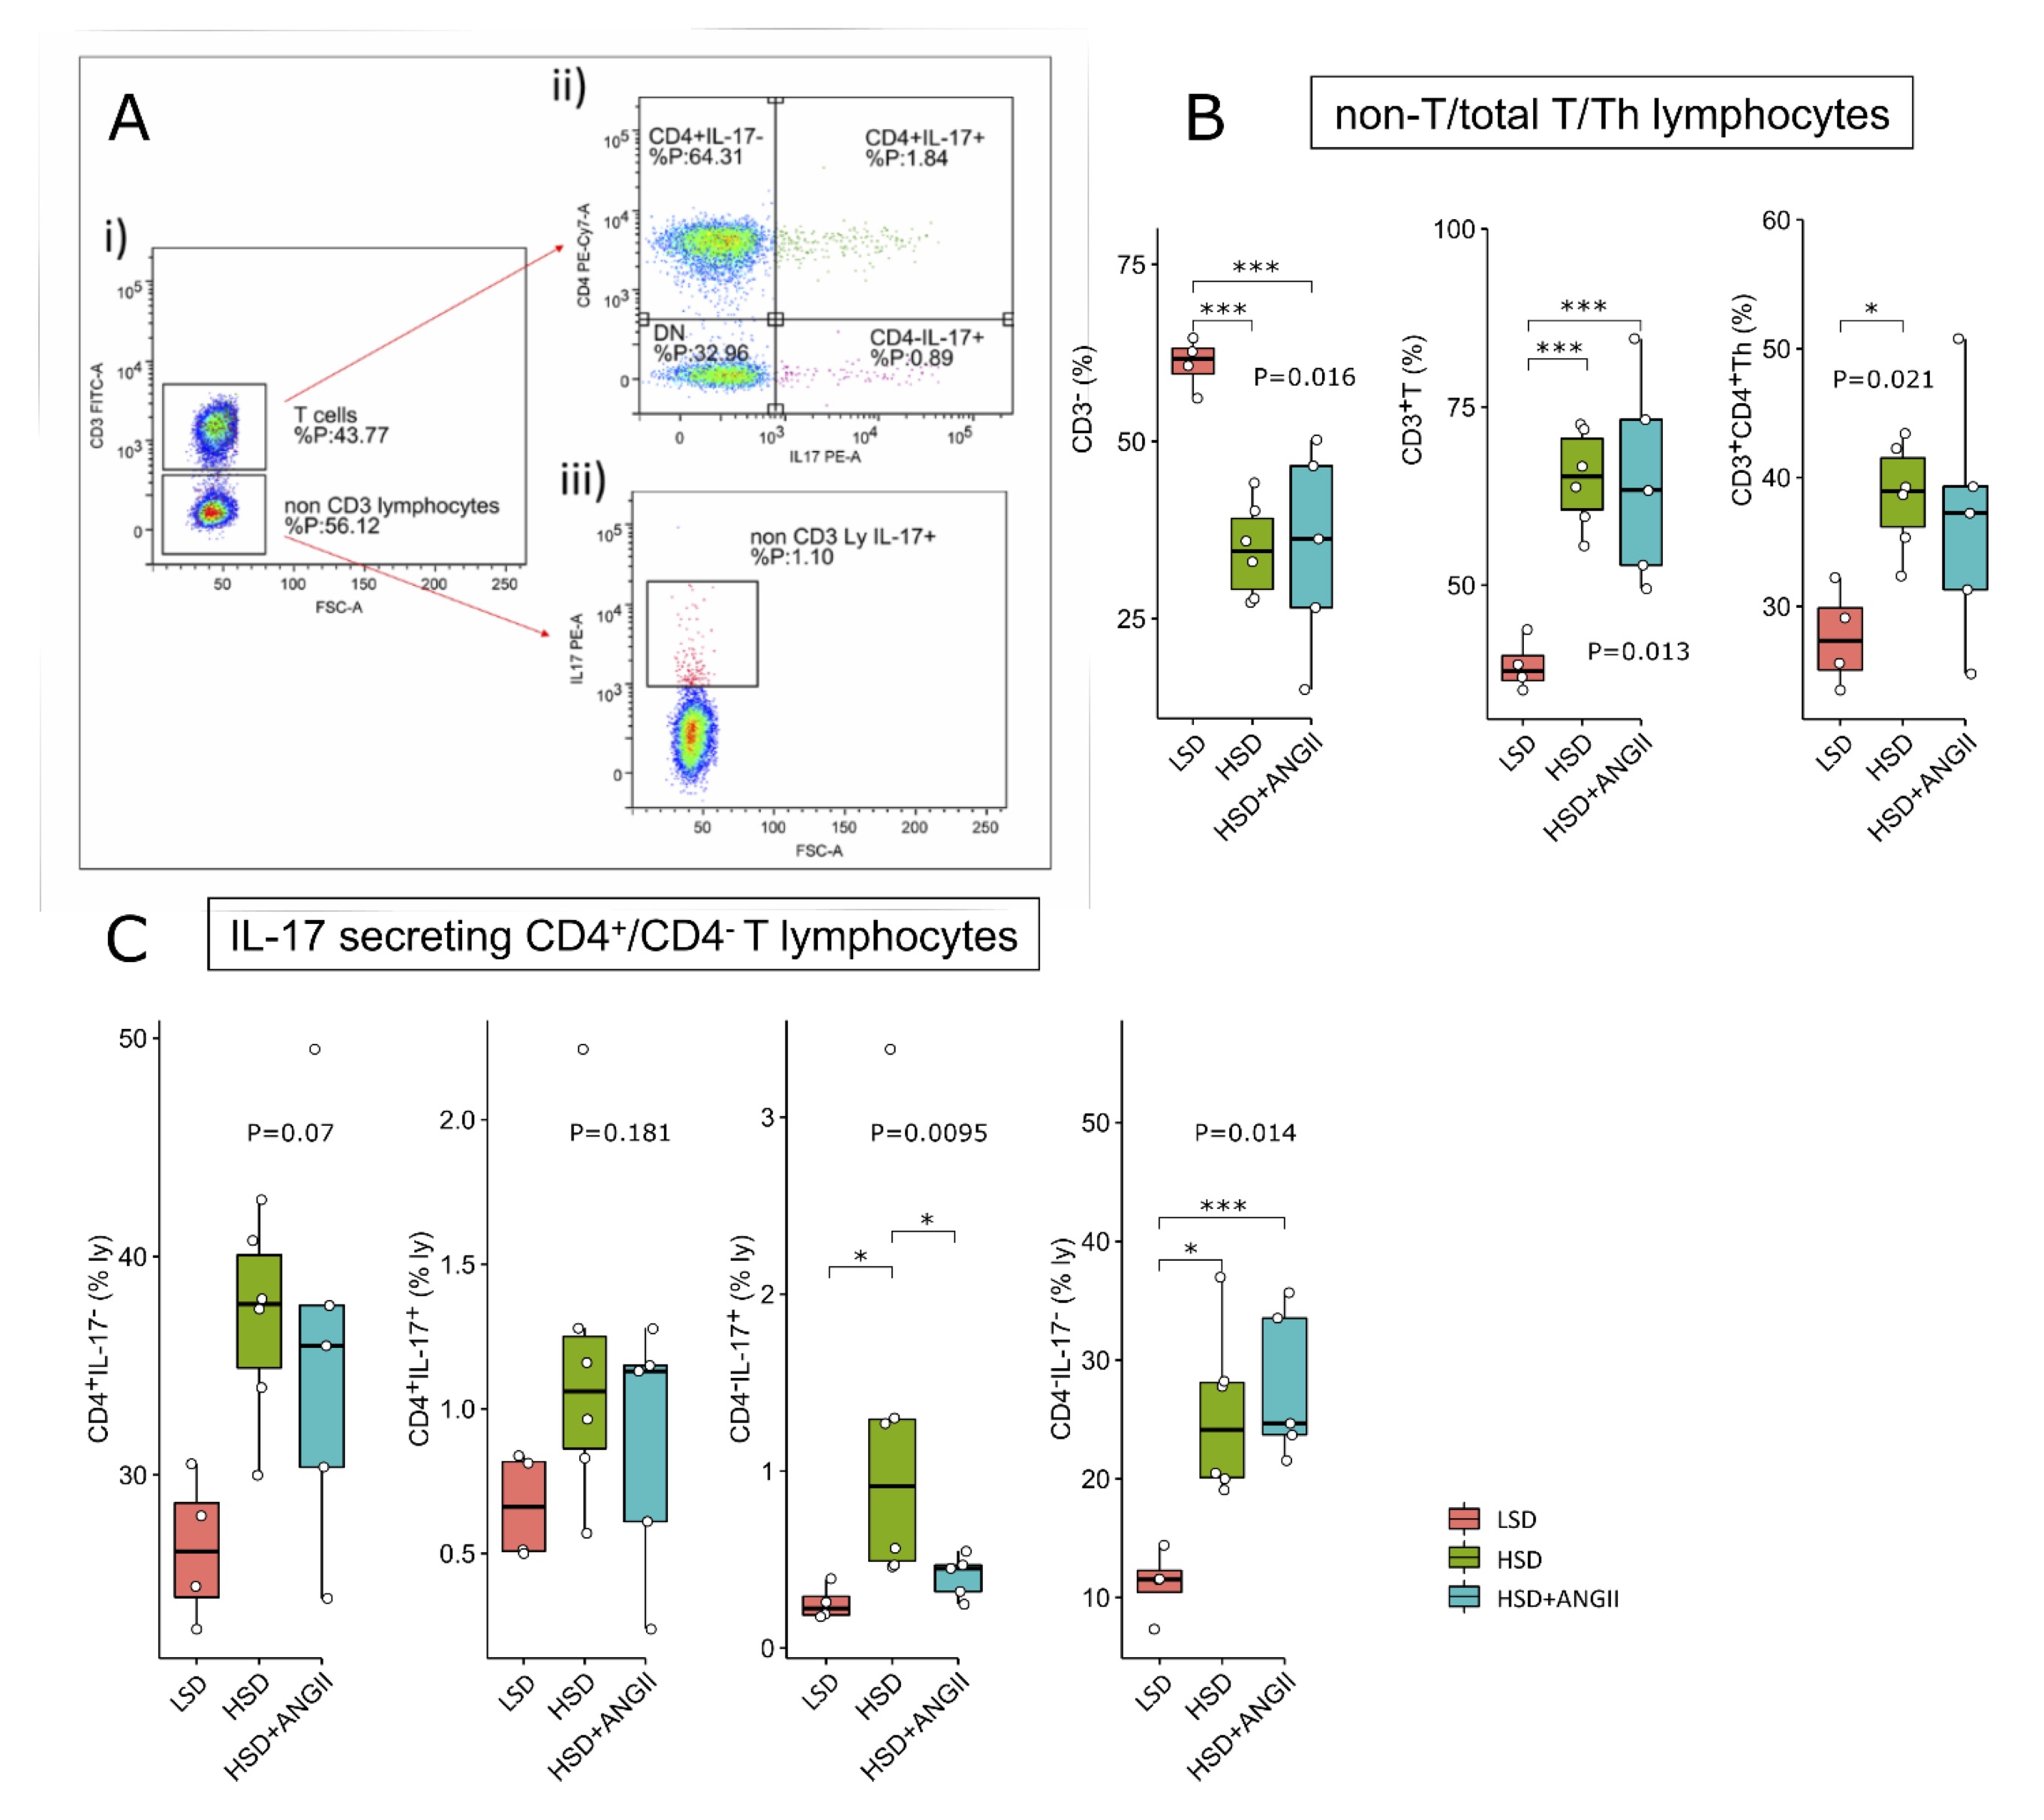
Fig. 6: Distribution of peripheral blood total T and helper (Th) lymphocyte and their IL-17 secreting subpopulations following 7-day high-salt diet in Sprague Dawley rats. The distribution of T cell subpopulations in peripheral blood of SD rats exposed to 7-day low-salt (LSD) or high-salt (HSD) diet alone or in combination with angiotensin II (ANGII; HSD + ANGII). Panel A shows representative dot plots illustrating gating strategy, including definition of CD3+ T cells (A-i) further analyzed for CD4 and IL-17 (co)expression (A-ii) or CD3- non-T cells further analyzed for IL-17 expression (A-iii). Distribution of total T, non-T and Th lymphocytes is shown in panel B, while distribution of T cell subpopulations identified based on CD4 and IL-17 expression is shown in panel C. Boxplots show the median, box edges represent the first and third quartiles. The whiskers extend to 1.5× interquartile range, and the circles represent values outside the inner fences (outliers). Each dot represents one animal. Group-wise significance was tested using the Kruskal–Wallis test (P), followed by Conovers’s post-hoc test (horizontal brackets, pairwise differences). *P<0.05, **P<0.01, ***P<0.005, ****P<0.001). Non-significant P-values were suppressed.
LFA-1 and Mac-1 expression on peripheral blood leukocyte subpopulations after 7-day HSD in Sprague Dawley rats
Expression of CD11a/LFA-1 and CD11bc/Mac-1 integrin is known to correlate with the activation status of leukocytes. Their expression level on peripheral blood leukocyte subpopulations was thus compared among the study groups (Fig. 7). The frequency of CD11a+ CD8+ T cells within the T cell compartment was not altered by HSD, yet CD8+ T cells presented with increased expression levels of cell surface CD11a (Fig. 7A-ii). The ANGII infusion resulted in reduced frequencies of total and CD11a+ CD8+T cells within the T cell pool compared to their control/LSD group and HSD-fed counterparts (Fig. 7A-i and A-ii). In addition, ANGII infusion reversed the expression of CD11a on CD8+ T cells to control values in the HSD group of rats (Fig. 7A-ii).
Peripheral granulocyte compartment was significantly enriched following HSD (Fig. 7B-i), an effect that was completely abolished by ANGII infusion. This was also reflected in the increased frequencies of CD11a+ and Cd11b/c+ granulocytes (Fig. 7bi-iii), while CD11b/c expression on the granulocyte cell surface following HSD was not significantly altered with HSD (Fig. 7B-ii).
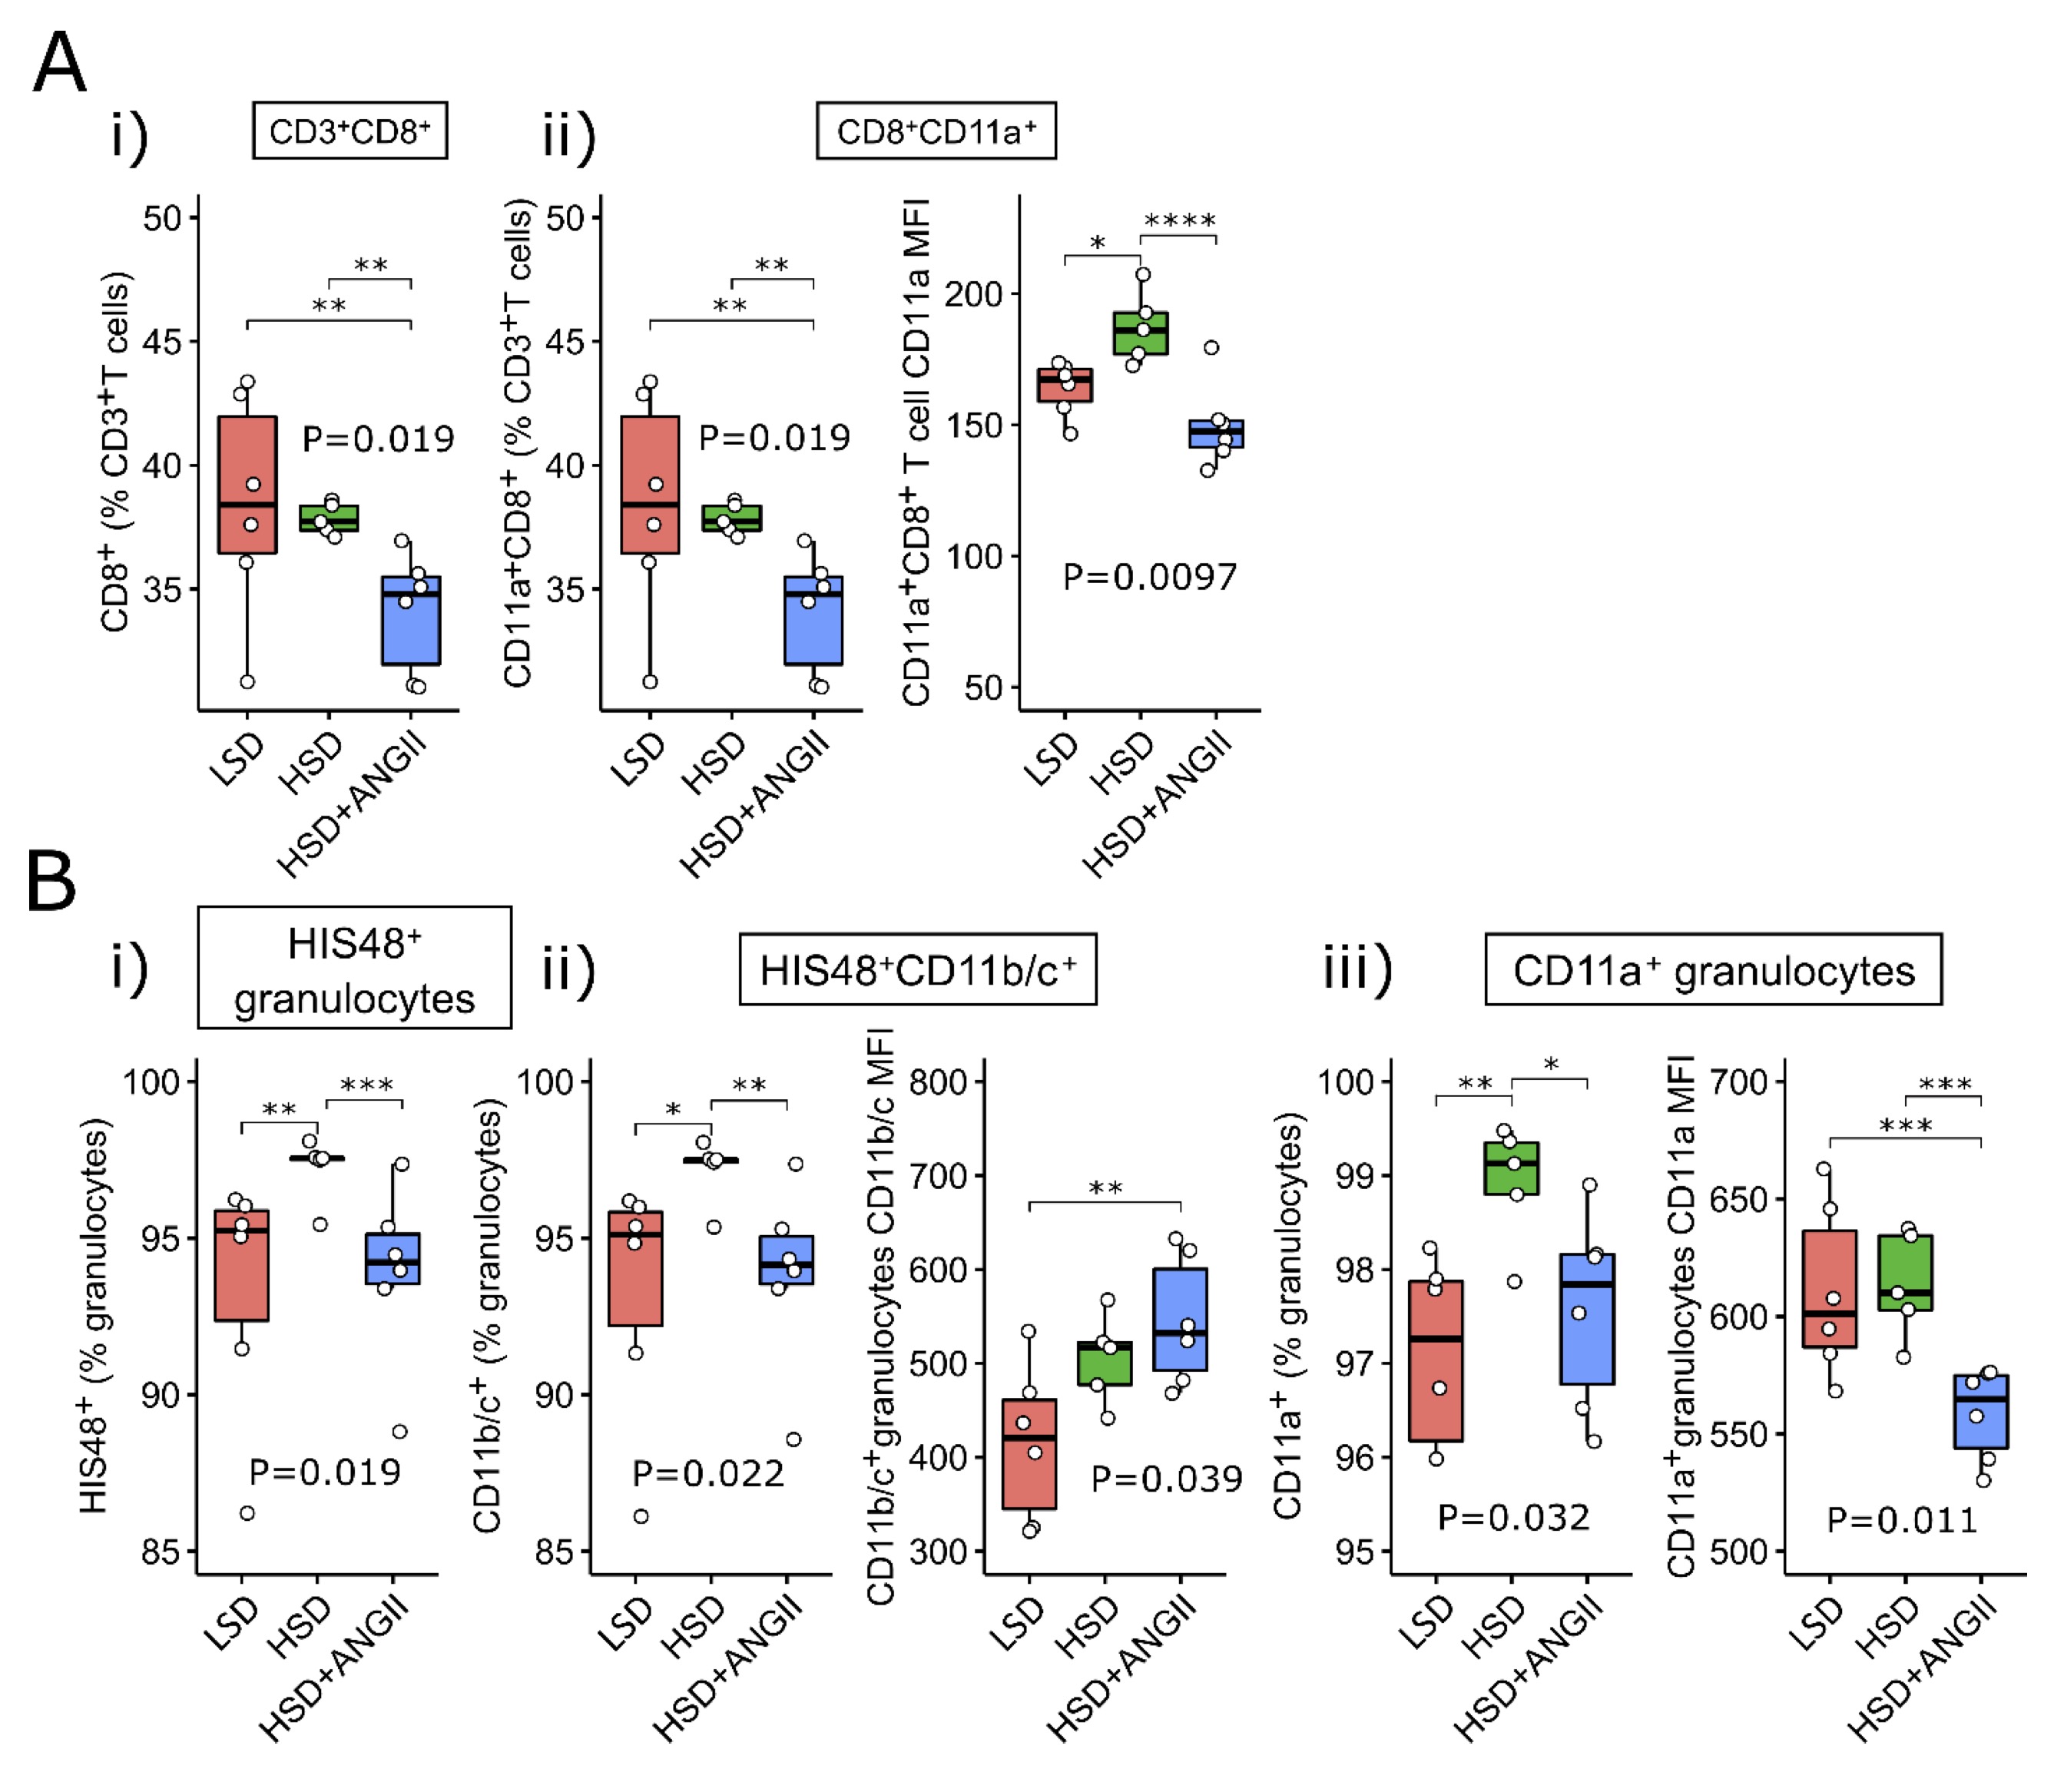
Fig. 7: Expression of LFA-1 and Mac-1 integrin on peripheral blood cytotoxic T cells and granulocytes following 7-day salt loading in Sprague Dawley (SD) rats The distribution of CD8+T cells (panel A) and granulocytes (panel B), together with their LFA-1/CD11a+ and CD11b/c+ compartments (flow cytometry) in peripheral blood of SD rats exposed to 7-day low-salt (LSD) or high-salt (HSD) diet in combination with angiotensin II (ANGII; HSD + ANGII) treatment. Box plots show the median, box edges represent the first and third quartiles. The whiskers extend to 1.5× interquartile range, and the circles represent values outside the inner fences (outliers). Each dot represents one animal. Group-wise significance was tested using the Kruskal–Wallis test (P), followed by Conover’s post-hoc test (horizontal brackets, pairwise differences). MFI: mean fluorescence intensity, geometric mean. *P<0.05, **P<0.01, ***P<0.005, ****P<0.001). Non-significant P-values were suppressed.
Short-term salt loading increases serum/glucocorticoid regulated kinase 1 expression in peripheral blood mononuclear cells of Sprague Dawley rats
The expression levels of total and phosphorylated serum/glucocorticoid regulated kinase 1 (SGK1) were determined in peripheral blood mononuclear cells and mesenteric lymph node (MLN) lysates of Sprague Dawley rats after 7-day HSD. SGK1 kinase has two phosphorylation sites, of which the Ser422 phosphorylated by mTORC2 complex was found to be responsible for activation and induction of immunomodulatory functions of SGK1 in lymphocytes.
In the present study, a significant increase in total but not phosphorylated fraction of SGK-1 kinase was found after HSD (Fig. 8; p-values are denoted at corresponding plots). This was also reflected in the reduced ratios between total and phosphorylated form of SGK-1, in both lymphoid compartments (peripheral blood and MLN).
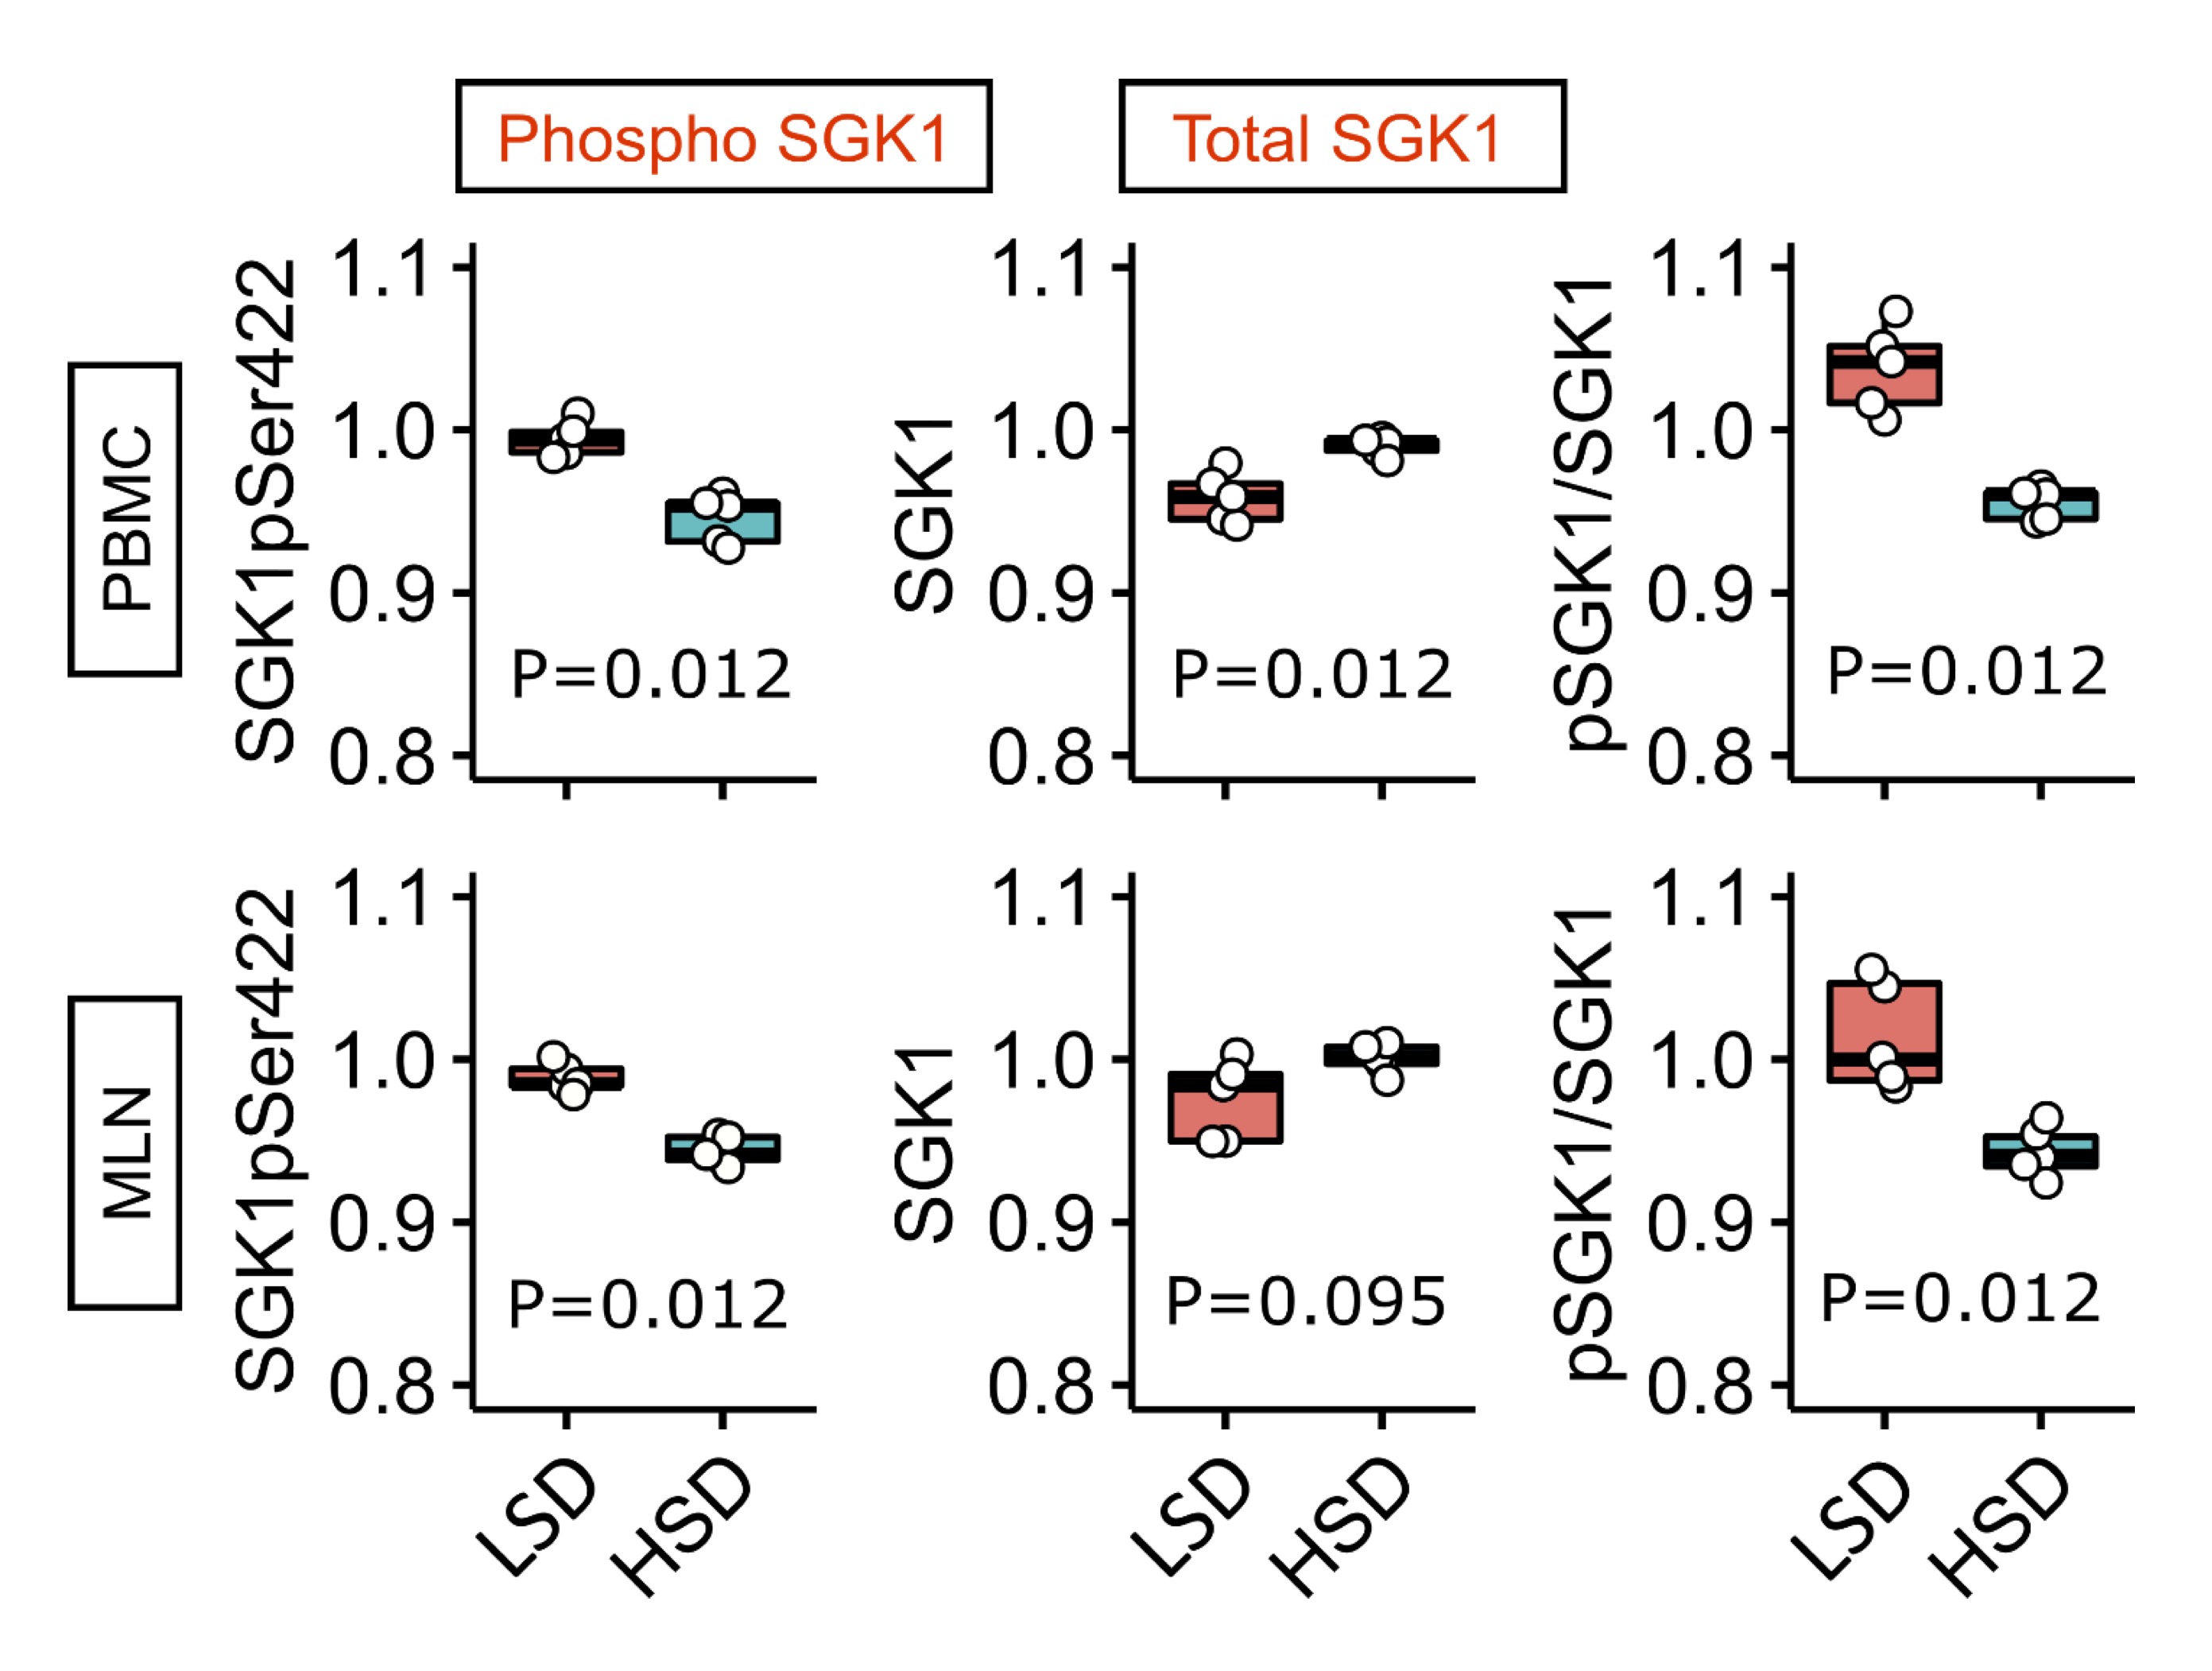
Fig. 8: Expression of total and phosphorylated serum/glucocorticoid regulated kinase 1 (SGK1) in peripheral blood mononuclear cells (PBMC) and mesenteric lymph node (MLN) cells after short-term salt loading in Sprague Dawley rats Phosphoproteome analysis of serum/glucocorticoid regulated kinase 1 (SGK1) in peripheral blood mononuclear cells (PBMC) and mesenteric lymph node (MLN) cells in Sprague Dawley rats following 7-day low-salt (LSD) or high-salt (HSD) diet. GAPDH = loading control (Mann–Whitney U test, 5 replicates).
BBV proteome analysis after short-term HSD in Sprague Dawley rats
Total proteome analysis of brain blood vessel tissue from Sprague Dawley rats exposed to LSD and HSD was determined and mutually compared. A total of 166 proteins/protein segments were identified as differentially expressed, of which only those with 10% or greater difference were chosen for further analysis (Fig. 9A). A schematic representation of differentially expressed protein interaction networks is shown in Fig. 9B. Among up-regulated proteins, there are several involved in muscle development and contraction, cytoskeleton organization, and epithelium development, suggesting an ongoing tissue remodeling process induced by HSD (Suppl. Table 2).
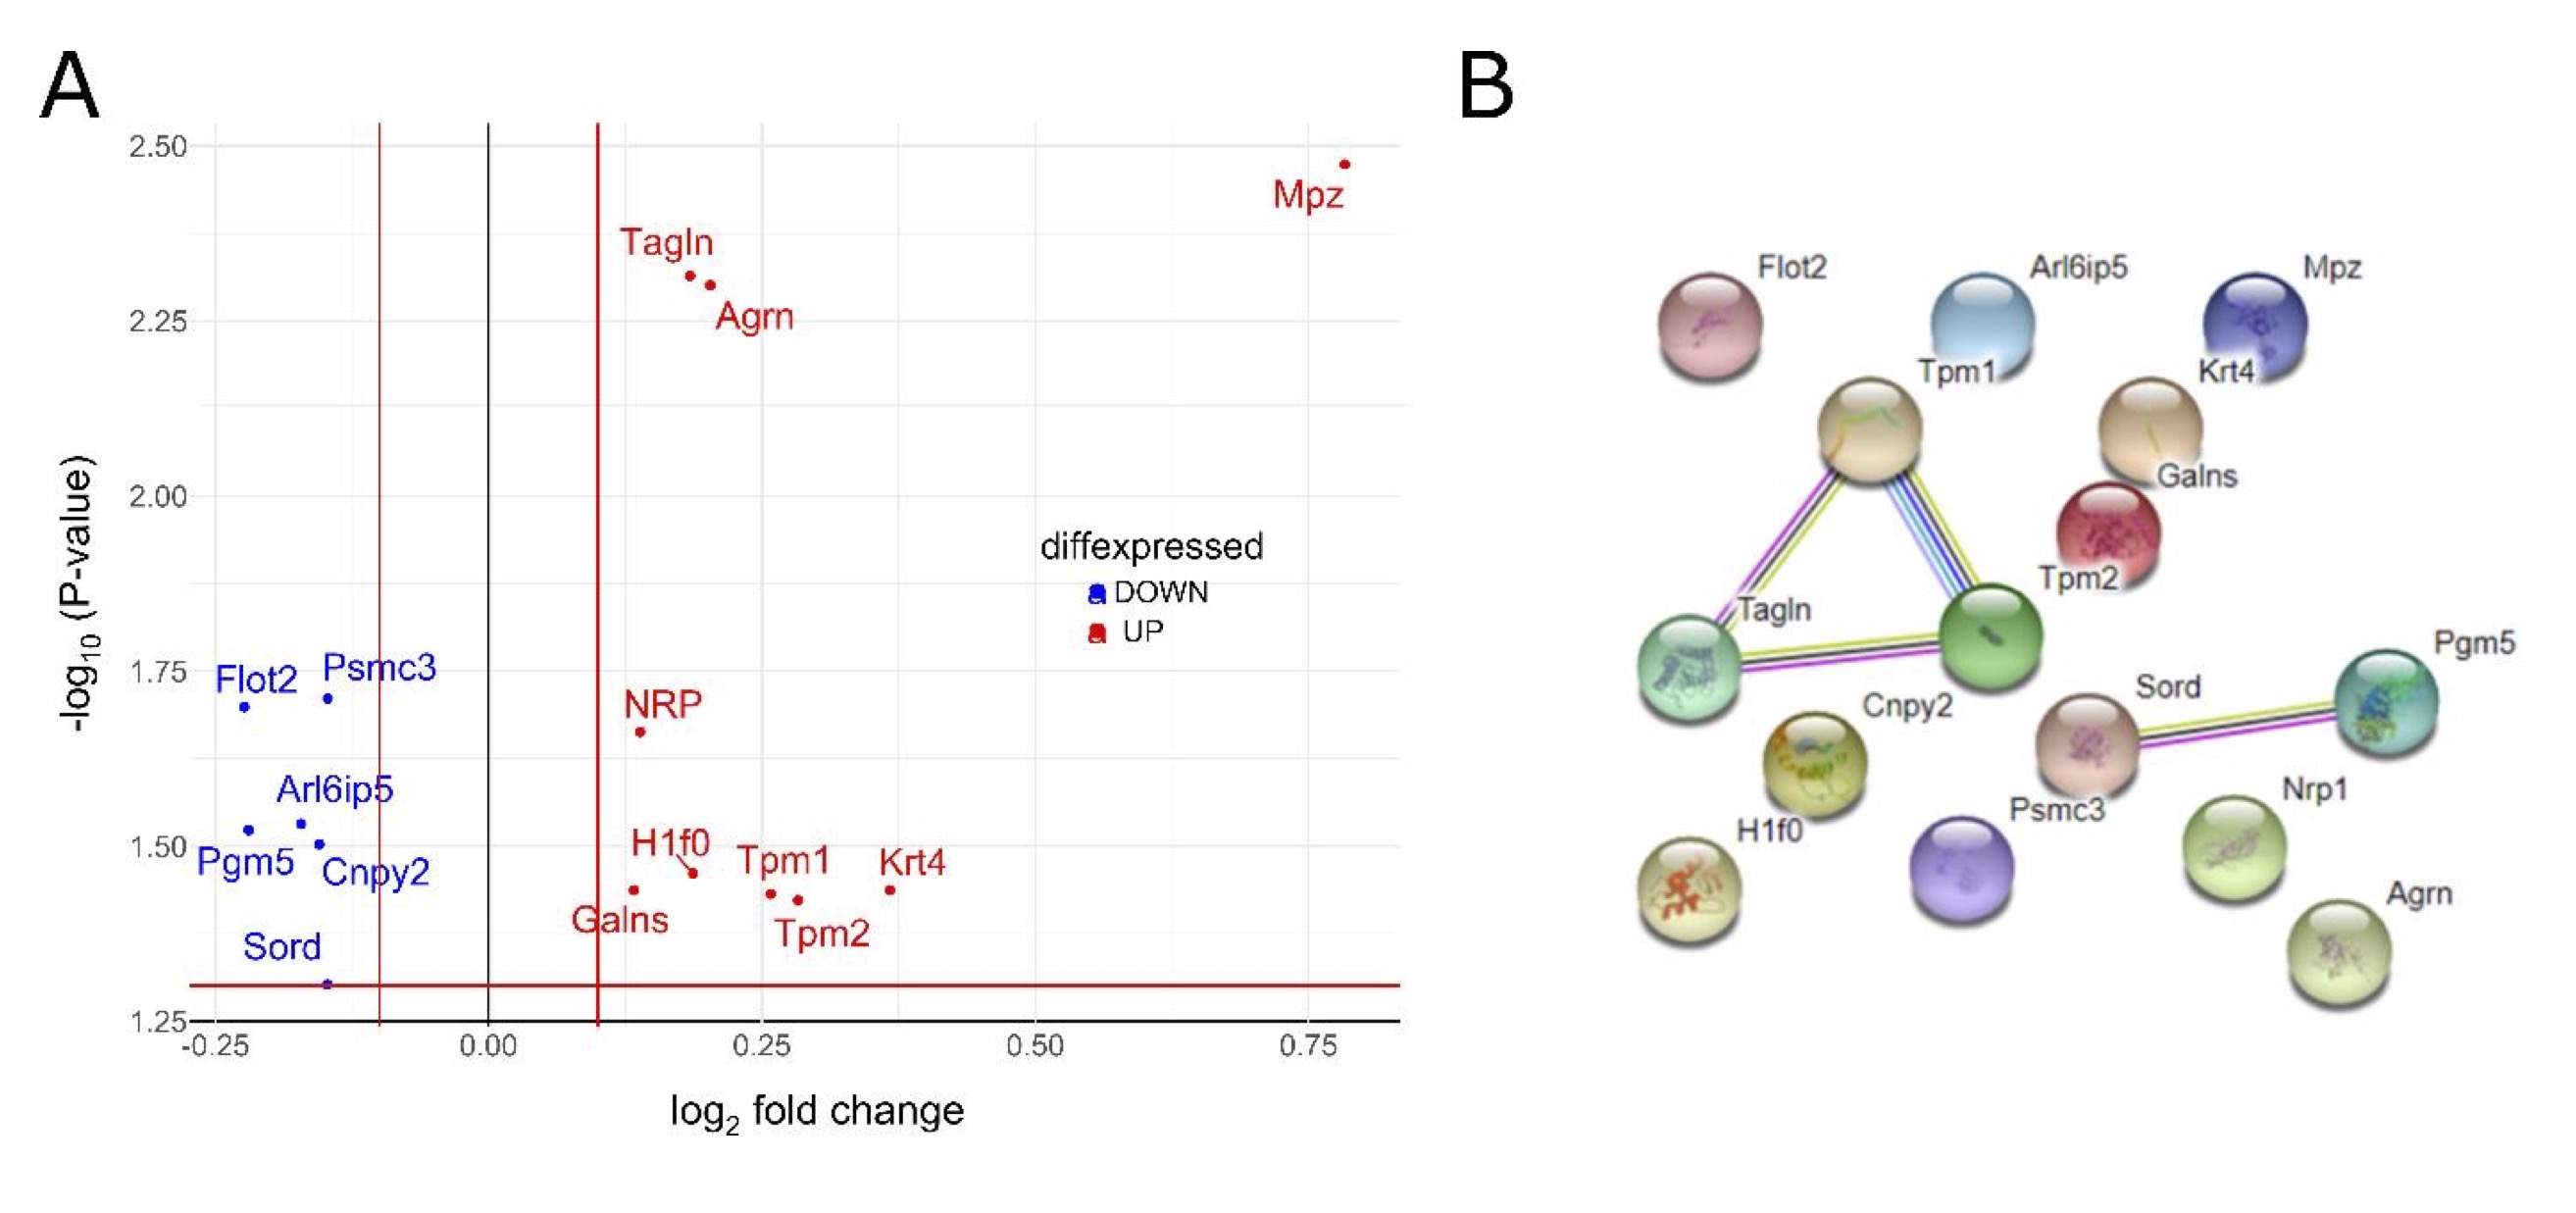
Fig. 9: Analysis of Sprague Dawley brain blood vessel tissue proteome after short-term salt loading Panel A Volcano plot, showing fold changes (FC) for proteins differentially expressed between high-salt (7 days, n = 7) and low-salt-fed animals (n = 7). The dashed horizontal line shows the statistical significance threshold (false discovery rate < 0.05). Two vertical lines show the threshold of fold change (log2FC > 0.1 or < −0.1). Non-significant results are omitted from the display. Panel B A schematic representation of protein interaction networks calculated for proteins that are differentially expressed. Interactions were visualized using the STRING website (https://string-db.org). Nodes: Network nodes represent proteins, while splice isoforms or post-translational modifications are collapsed, i.e., each node represents all the proteins produced by a single protein-coding gene locus. Node color: Colored nodes –- query proteins and first shell of interactors; white nodes – second shell of interactors. Node content: Empty nodes – proteins of unknown 3D structure; filled nodes – some 3D structure is known or predicted. Edges: Edges represent protein-protein associations, associations are meant to be specific and meaningful, i.e., proteins jointly contribute to a shared function; this does not necessarily mean they are physically binding each other. Known interactions: From curated databases (azure blue), experimentally determined (purple). Predicted interactions: Gene neighborhood (green); gene fusions (red); gene co-occurrence (blue). Others: Text mining (yellow); co-expression (black); protein homology (light blue). Galns – galactosamine (N-acetyl)-6-sulfate sulfatase; Krt4 – keratin type II cytoskeletal 4; Nrp1 – neuropilin-1; Tpm2 – tropomyosin beta chain; Tagln – transgelin; Pgm5 – phosphoglucomutase-like protein 5; Arl6ip5 – PRA1 family protein 3; Mpz – myelin protein P0; Psmc3 – 26S proteasome regulatory subunit 6A; Flot2 – flotillin-2; Sord – sorbitol dehydrogenase; Tpm1 – tropomyosin alpha-1 chain; H1f0 – histone H1.0; Agr – agrin
Discussion
The present study has examined the early blood pressure-independent immunomodulatory effects of the dietary salt intake in an animal model of Sprague Dawley (SD) rats fed HSD during a 7-day period. Additionally, it was examined whether the observed changes in the immune functions were related to RAS suppression by supplementing HSD-fed animals with ANGII. The examinations were specifically focused on inflammation within the vascular wall and the distribution of circulatory leukocyte subpopulations that could promote low-grade inflammation, endothelial activation and finally endothelial dysfunction, previously reported by our group and several other groups [6–8]. The novelty of the present study is its integrative approach utilizing methods for identification of T cell distribution and phenotype within different lymphoid compartments, targeted gene transcriptome analysis and total proteome analysis, in addition to advanced analysis of the data allowing the identification of clusters of factors leading to vascular inflammation and endothelial dysfunction. Results of present study provide the evidence for low-grade inflammation induced by short-term HSD in Sprague Dawley rats involving Th17/Treg axis dysregulation, vascular wall remodeling and a shift in fatty acids metabolism, and we elucidate the intertwining underlying mechanisms that lead to increased endothelial-leukocyte interaction promoted by the HSD.
A compelling body of evidence implies endothelial activation as a direct, early, blood pressure-independent effect of increased dietary sodium intake [8, 22–26]. As an illustration, Takahashi et al. reported increased adhesion of leukocytes to retinal vessels, which paralleled enhanced expression of Ccl2 and Icam1 in the kidneys of Dahl salt-sensitive rats following 3 days of a diet with 8% NaCl [22], and further corroborated by in vivo inhibition of endothelium-leukocyte interactions with anti-CD18 antibodies in the pre-hypertensive stage of salt loading. In line with these findings, in vitro studies employing human umbilical vein endothelial cells (HUVECs) demonstrated that increased extracellular NaCl concentration induced differential expression of transcripts related to cell adhesion, proliferation, leukocyte and lymphocyte activation, coagulation, angiogenesis and inflammatory response, even if the sodium excess was within the physiological range [27]. We have previously demonstrated differential, species-specific VLA-4, LFA-1, and Mac-1 integrin expression on peripheral leukocyte subpopulations in humans and SD rats following short-term high-NaCl dietary intake as evidence of an altered leukocyte activation status that may contribute to low-grade vascular inflammation [24]. In the present study, acute salt loading exerted an up-regulation of Il6 gene in the microcirculation of HSD-fed SD rats, accompanied by an increased serum level of TNFalpha cytokine, which suggests the onset of inflammatory process. Serum TNFalpha levels were reversed by ANGII supplementation. The lack of significant changes for other cytokines, chemokines and cell adhesion molecules in the vessel may reflect the neglectable cytokine overflow from endothelial cells to the bloodstream due to early phase of inflammation.
To date, studies examining the association between acute high salt intake and peripheral blood fatty acid composition are lacking, and currently available data (primarily on subacute/chronic salt reduction) are controversial [28, 29]. For example, Cui et al. reported a negative fat deposition regulation caused by long-term HSD in mice [30]. Transcripts related to lipolysis were up-regulated in parallel to down-regulation of genes involved in lipogenesis as a result of CREB1 phosphorylation, a key factor involved in calcium signaling and, additionally, RAS suppression during HSD [30]). In present study, the serum fatty acid profile was significantly altered following acute salt loading, and it was characterized by an increased proportion of MUFA and SFA in HSD-fed animals. Additional analysis of specific fatty acids revealed reduced levels of linoleic (C18:2 ω-6) and α-linolenic (C18:3 ω-3) acid, while the level of palmitoleic acid (C16:1 ω-7) was significantly increased in the HSD group of animals compared to LSD-fed control rats. SFA are known to promote inflammation and insulin resistance in adipose tissue, at least in part through activation of TLR4 and/or TLR2 and downstream activation of IKKβ/NFκB and JNK1/AP1 signaling pathways [31, 32]. By contrast, MUFAs possess anti-inflammatory properties by which they exert their cardiovascular risk-lowering effects [33]. Altogether, present results suggest a shift in the lipid metabolism that could facilitate HSD-induced onset of low-grade inflammation.
Salt-induced pathogenicity of Th17 cells is linked to SGK1 up-regulation in an IL-23-dependent manner [15]. SGK1 and NFAT5 belong to the p38/MAPK signaling pathway, and have a well-documented role as sensors of hyperosmotic stress in mammalian cells [34]. This has been repeatedly confirmed by introducing pharmacological blockade of p38 or shRNA-mediated silencing of SGK1 and NFAT5, resulting in abrogated IL-17 expression in Th17 cells during high salt loading [15, 17]. The present study demonstrated increased total SKG1 in peripheral blood mononuclear cells and mesenteric lymph node lysate, suggesting an increased sensitivity to tissue NaCl, which is in agreement with previously mentioned findings [15] and could, at least in a part, explain observed perturbations within the T-cell compartments.. Namely, we have found lymphoid compartment-specific effects of high salt intake on leukocyte subpopulations in mesenteric lymph nodes and peripheral blood. The frequencies of recently activated (CD4+CD25int) and regulatory (CD4+CD25highFoxp3+) T cells were increased with no changes in Th17 distribution in MLNs of SD rats on HSD. Unlike in the MLN, in the peripheral blood HSD had no significant effect on peripheral Treg and Th17 subpopulations, but induced expansion of peripheral non Th (CD3+CD4-) lymphocytes secreting IL-17 (of which the majority could correspond to cytotoxic CD8+ T cells). This is further corroborated with enhanced CD11a cell surface expression on CD8+ T cells following HSD, suggesting CD8 T cell activation. Our results are in line with previous report on altered Treg numbers and function during high salt loading, showing an increased IFNγ secretion by Tregs and their reduced suppressive functions, which could be restored by neutralization with anti-IFNγ antibodies or shRNA-mediated knockdown of IFNγ [35]. A recent study by Matthias et al. added to the complexity by their finding of dichotomous, context-dependent effects of NaCl on the T helper subsets [17, 35]. Namely, Th17 cells acquired anti-inflammatory phenotype and function characterized by Foxp3 and TGFβ up-regulation, if the cells were primed without Th17-polarizing cytokines. In addition, we have found evidence for T cell, Th lymphocyte and granulocyte compartment expansion following HSD. Importantly, most of these cell population-specific effects were abolished by ANGII, suggesting that the observed differences were, at least in a part, related to RAS suppression. In addition, increased expression of SGK1 kinase in peripheral blood leukocytes implies early changes due to hyperosmotic exposure. Finding of lymphoid compartment-specific effects of a short-term HSD may be explained by the local accumulation of NaCl in the mesenteric lymph nodes via lymphatic drainage from the gut [36]. In addition, lymph nodes represent a natural site of peripheral Treg cell activation, expansion and differentiation, as a result of direct contact with microbiota and food-born antigens [37]. The extent of Treg generation in gut-associated lymphoid tissue in early life represents an intrinsic property of lymphoid tissue. However, later in life, their generation is additionally shaped by the gut microbiota and microbiota-derived metabolites, such as short chain fatty (SCFA) acids [37]. Interestingly, increased dietary salt intake changes the gut microbiome by increasing strains related to blood pressure, in addition to the alteration of SCFA composition [38]. This is in line with our finding of Treg expansion within the MLN compartment and increased serum SFA.
Previous studies have demonstrated angiotensin type 1 receptor (AT1R) expression on various types of leukocytes, including polymorphonuclear leukocytes, monocytes, T lymphocytes and B lymphocytes; however the expression pattern is peculiar to each subset, possibly suggesting distinct roles in the various cell types [39]. This led to an increasing interest in the role of ANGII as an auxiliary signal that modulates T-cell development and function. Several previous studies showed that ANGII promotes T-cell activation, particularly in response to canonical T-cell receptor signaling. In line with this, Nataraj et al. demonstrated angiotensin II induced T-cell proliferation, and diminished proliferation of T cells lacking the AT1R in a mixed lymphocyte assay, even in the absence of added ANGII [40]. Furthermore, it has been shown that ANGII increases cytokine production of CD8+ cells via cell surface AT1R, and their expression is increased by T-cell receptor ligation with anti-CD3 antibody [41]. Furthermore, in an in vivo experimental autoimmune encephalomyelitis (EAE) model of MS suppression of ANGII with ACE inhibitors or inhibiting ANGII signaling with AT1R blockers resulted in reduced frequencies of autoreactive Th1 and Th17 T cells parallel to an expansion of antigen-specific CD4+FoxP3+ regulatory Treg cells trough inhibition of the canonical NF-κB1 transcription factor complex and activation of the alternative NF-κB2 pathway, and this effect was of sufficient potency to reverse paralytic EAE [42]. This is partially in line with our observation of increased frequencies of regulatory (CD4+CD25highFoxp3+) T cells with no changes in Th17 subpopulation in mesenteric lymph nodes of Sprague Dawley rats on a HSD, presenting a complex effect of suppressed ANGII in parallel to increased local tissue accumulation of NaCl, both effects seemingly able to affect T cell differentiation and function. The role of AT1R in T cell function seems to be even more complex, as revealed in an animal model of hypertension induced by unilateral nephrectomy and administration of high-dose ANGII (1000 ng/kg/ min) where AT1R receptors on T cells s were shown to protect the kidney from target organ damage by favorably modulating T helper cell differentiation [43].
While salt-induced changes in blood pressure, in conjunction with other underlying processes, are expected to induce reactive changes in the vascular wall, here we provide evidence of the earliest structural and metabolic changes in response to short-term salt loading, without changes in blood pressure levels. Namely, complete proteome analysis of the brain blood vessel tissue is indicative of an ongoing tissue remodeling process and perturbations in the energy metabolism induced by HSD. This is in accordance with the previous finding of sodium-induced impairment of the endothelial glycocalyx contributing to endothelial cell stiffening and subsequent endothelial dysfunction [44–46], as well as the finding of long-term salt loading induced vascular remodeling and cardiac fibrosis in stroke-prone spontaneously hypertensive rats [47].
In conclusion, the present study demonstrates mechanistic evidence for complex perturbations in the immune system and lipid metabolism induced by HSD that may represent the earliest events in the cascade of vascular inflammation, endothelial activation and dysfunction – early signs of vascular remodeling that may ultimately contribute to the development of atherosclerosis. This is of practical importance since salt consumption beyond the recommended amounts may be considered a modifiable risk factor not only in the development of atherosclerosis and adverse cardiovascular events, but also in the frame of the complex pathogenesis of immune-mediated inflammatory diseases.
Acknowledgements
Author Contributions
Conception and design of the work, I.D., M.M., A.S.; acquisition of data Z.M., N.K., R.F., B.T., A.H., I.J., A.M.; statistical analysis of data M.S.; interpretation of data M.S., M.M., I.D.; drafting the work, M.M., M.S.; revising it critically for important intellectual content Z.M., N.K., R.F., B.T., A.H., I.J., A.S., A.M., I.D. All authors have approved the final version of the manuscript, agree to be accountable for all aspects of the work in ensuring that questions related to the accuracy or integrity of any part of the work are appropriately investigated and resolved, and confirm that all persons designated as authors qualify for authorship and that all those who qualify for authorship are listed.
Funding Sources
This study was supported by the Croatian Science Foundation Project Grant IP-2014-09-6380 (PI I. Drenjančević) and institutional grants IP1-MEFOS-2020 (PI I. Drenjančević), IP1-MEFOS-2019 (PI I. Drenjančević), VIF-MEFOS09-2018 (PI I. Drenjančević).
Statement of Ethics
Experimental procedures conformed with the European Guidelines for the Care and Use of Laboratory Animals (Directive 86/609) and were approved by the local Ethical Committee (Faculty of Medicine, Josip Juraj Strossmayer University of Osijek, class: 602-04/14-08/06, no.: 2158-61-07-14-04) and by the Ministry of Agriculture, Croatia (HR-POK-005).
Disclosure Statement
The authors have no conflicts of interest to declare.
References
| 1 | Partearroyo T, Samaniego-Vaesken M de L, Ruiz E, Aranceta-Bartrina J, Gil Á, González-Gross M, et al. Sodium Intake from Foods Exceeds Recommended Limits in the Spanish Population: The ANIBES Study. Nutrients. 2019 Oct;11(10):2451.
https://doi.org/10.3390/nu11102451 |
| 2 | GBD 2017 Diet Collaborators. Health effects of dietary risks in 195 countries, 1990-2017: a systematic analysis for the Global Burden of Disease Study 2017. Lancet 2019;393:1958–1972.
|
| 3 | Farquhar WB, Edwards DG, Jurkovitz CT, Weintraub WS. Dietary sodium and health: more than just blood pressure. J Am Coll Cardiol 2015;65:1042–1050.
https://doi.org/10.1016/j.jacc.2014.12.039 |
| 4 | Patik JC, Lennon SL, Farquhar WB, Edwards DG. Mechanisms of Dietary Sodium-Induced Impairments in Endothelial Function and Potential Countermeasures. Nutrients 2021;13:270.
https://doi.org/10.3390/nu13010270 |
| 5 | Durand MJ, Lombard JH. Low-Dose Angiotensin II Infusion Restores Vascular Function in Cerebral Arteries of High Salt–Fed Rats by Increasing Copper/Zinc Superoxide Dimutase Expression. Am J Hypertens. 2013 ;26:739–747.
https://doi.org/10.1093/ajh/hpt015 |
| 6 | Cosic A, Jukic I, Stupin A, Mihalj M, Mihaljevic Z, Novak S, et al. Attenuated flow-induced dilatation of middle cerebral arteries is related to increased vascular oxidative stress in rats on a short-term high salt diet. J Physiol (Lond) 2016 01;594:4917–4931.
https://doi.org/10.1113/JP272297 |
| 7 | Matic A, Jukic I, Stupin A, Baric L, Mihaljevic Z, Unfirer S, et al. High salt intake shifts the mechanisms of flow-induced dilation in the middle cerebral arteries of Sprague-Dawley rats. Am J Physiol Heart Circ Physiol 2018;315:718–730.
https://doi.org/10.1152/ajpheart.00097.2018 |
| 8 | Barić L, Drenjančević I, Matić A, Stupin M, Kolar L, Mihaljević Z, et al. Seven-Day Salt Loading Impairs Microvascular Endothelium-Dependent Vasodilation without Changes in Blood Pressure, Body Composition and Fluid Status in Healthy Young Humans. Kidney Blood Press Res 2019;44:835–847.
https://doi.org/10.1159/000501747 |
| 9 | Cosic A, Jukic I, Stupin A, Mihalj M, Mihaljevic Z, Novak S, et al. Attenuated flow-induced dilatation of middle cerebral arteries is related to increased vascular oxidative stress in rats on a short-term high salt diet. J Physiol (Lond) 2016 01;594:4917–4931.
https://doi.org/10.1113/JP272297 |
| 10 | Incalza MA, D’Oria R, Natalicchio A, Perrini S, Laviola L, Giorgino F. Oxidative stress and reactive oxygen species in endothelial dysfunction associated with cardiovascular and metabolic diseases. Vascul Pharmacol 2018;100:1–19.
https://doi.org/10.1016/j.vph.2017.05.005 |
| 11 | Scrivo R, Perricone C, Altobelli A, Castellani C, Tinti L, Conti F, et al. Dietary Habits Bursting into the Complex Pathogenesis of Autoimmune Diseases: The Emerging Role of Salt from Experimental and Clinical Studies. Nutrients 2019;11:1013.
https://doi.org/10.3390/nu11051013 |
| 12 | Leavy O. T cells: Salt promotes pathogenic TH17 cells. Nat Rev Immunol 2013;13:225.
https://doi.org/10.1038/nri3432 |
| 13 | Jung SM, Kim Y, Kim J, Jung H, Yi H, Rim YA, et al. Sodium Chloride Aggravates Arthritis via Th17 Polarization. Yonsei Med J 2019;60:88–97.
https://doi.org/10.3349/ymj.2019.60.1.88 |
| 14 | Wei Y, Lu C, Chen J, Cui G, Wang L, Yu T, et al. High salt diet stimulates gut Th17 response and exacerbates TNBS-induced colitis in mice. Oncotarget 2017;8:70–82.
https://doi.org/10.18632/oncotarget.13783 |
| 15 | Wu C, Yosef N, Thalhamer T, Zhu C, Xiao S, Kishi Y, et al. Induction of pathogenic TH17 cells by inducible salt-sensing kinase SGK1. Nature 2013;496:513–517.
https://doi.org/10.1038/nature11984 |
| 16 | Karlsen TV, Nikpey E, Han J, Reikvam T, Rakova N, Castorena-Gonzalez JA, et al. High-Salt Diet Causes Expansion of the Lymphatic Network and Increased Lymph Flow in Skin and Muscle of Rats. Arteriosclerosis, Thrombosis, and Vascular Biology 2018;38:2054–2064.
https://doi.org/10.1161/ATVBAHA.118.311149 |
| 17 | Matthias J, Heink S, Picard F, Zeiträg J, Kolz A, Chao Y-Y, et al. Salt generates antiinflammatory Th17 cells but amplifies pathogenicity in proinflammatory cytokine microenvironments. J Clin Invest 130:4587–4600.
https://doi.org/10.1172/JCI137786 |
| 18 | Matic A, Jukic I, Mihaljevic Z, Kolobaric N, Stupin A, Kozina N, et al. Low-dose angiotensin II supplementation restores flow-induced dilation mechanisms in cerebral arteries of Sprague-Dawley rats on a high salt diet. J Hypertens 2022;40:441–452.
https://doi.org/10.1097/HJH.0000000000003030 |
| 19 | Wang LY, Summerhill K, Rodriguez-Canas C, Mather I, Patel P, Eiden M, et al. Development and validation of a robust automated analysis of plasma phospholipid fatty acids for metabolic phenotyping of large epidemiological studies. Genome Med 2013;5:39.
https://doi.org/10.1186/gm443 |
| 20 | Stupin A, Mihalj M, Kolobarić N, Šušnjara P, Kolar L, Mihaljević Z, et al. Anti-Inflammatory Potential of n-3 Polyunsaturated Fatty Acids Enriched Hen Eggs Consumption in Improving Microvascular Endothelial Function of Healthy Individuals—Clinical Trial. Int J Mol Sci 2020;21:4149.
https://doi.org/10.3390/ijms21114149 |
| 21 | Knezović A, Kolobarić N, Drenjančević I, Mihaljević Z, Šušnjara P, Jukić I, et al. Role of Oxidative Stress in Vascular Low-Grade Inflammation Initiation Due to Acute Salt Loading in Young Healthy Individuals. Antioxidants (Basel). 2022;11:444.
https://doi.org/10.3390/antiox11030444 |
| 22 | Takahashi H, Nakagawa S, Wu Y, Kawabata Y, Numabe A, Yanagi Y, et al. A high-salt diet enhances leukocyte adhesion in association with kidney injury in young Dahl salt-sensitive rats. Hypertens Res. 2017;40:912–920.
https://doi.org/10.1038/hr.2017.31 |
| 23 | Afsar B, Kuwabara M, Ortiz A, Yerlikaya A, Siriopol D, Covic A, et al. Salt Intake and Immunity. Hypertension 2018;72:19–23.
https://doi.org/10.1161/HYPERTENSIONAHA.118.11128 |
| 24 | Mihalj M, Matić A, Mihaljević Z, Barić L, Stupin A, Drenjančević I. Short-Term High-NaCl Dietary Intake Changes Leukocyte Expression of VLA-4, LFA-1, and Mac-1 Integrins in Both Healthy Humans and Sprague-Dawley Rats: A Comparative Study. Mediators Inflamm 2019;2019:6715275.
https://doi.org/10.1155/2019/6715275 |
| 25 | Ma P, Zha S, Shen X, Zhao Y, Li L, Yang L, et al. NFAT5 mediates hypertonic stress-induced atherosclerosis via activating NLRP3 inflammasome in endothelium. Cell Commun Signal 2019;17:102.
https://doi.org/10.1186/s12964-019-0406-7 |
| 26 | Wenstedt EFE, Verberk SGS, Kroon J, Neele AE, Baardman J, Claessen N, et al. Salt increases monocyte CCR2 expression and inflammatory responses in humans. JCI Insight 2019;4:e130508.
https://doi.org/10.1172/jci.insight.130508 |
| 27 | Dmitrieva NI, Burg MB. Elevated Sodium and Dehydration Stimulate Inflammatory Signaling in Endothelial Cells and Promote Atherosclerosis. PLoS One 2015;10:e0128870.
https://doi.org/10.1371/journal.pone.0128870 |
| 28 | Obarzanek E, Sacks FM, Vollmer WM, Bray GA, Miller ER, Lin PH, et al. Effects on blood lipids of a blood pressure-lowering diet: the Dietary Approaches to Stop Hypertension (DASH) Trial. Am J Clin Nutr 2001;74:80–89.
https://doi.org/10.1093/ajcn/74.1.80 |
| 29 | Harsha DW, Sacks FM, Obarzanek E, Svetkey LP, Lin P-H, Bray GA, et al. Effect of dietary sodium intake on blood lipids: results from the DASH-sodium trial. Hypertension 2004;43:393–398.
https://doi.org/10.1161/01.HYP.0000113046.83819.a2 |
| 30 | Cui H, Yang S, Zheng M, Liu R, Zhao G, Wen J. High-salt intake negatively regulates fat deposition in mouse. Sci Rep 2017;7:2053.
https://doi.org/10.1038/s41598-017-01560-3 |
| 31 | Kennedy A, Martinez K, Chuang C-C, LaPoint K, McIntosh M. Saturated fatty acid-mediated inflammation and insulin resistance in adipose tissue: mechanisms of action and implications. J Nutr 2009;139:1–4.
https://doi.org/10.3945/jn.108.098269 |
| 32 | Glass CK, Olefsky JM. Inflammation and Lipid Signaling in the Etiology of Insulin Resistance. Cell Metabolism 2012;15:635–645.
https://doi.org/10.1016/j.cmet.2012.04.001 |
| 33 | Rocha DM, Bressan J, Hermsdorff HH. The role of dietary fatty acid intake in inflammatory gene expression: a critical review. Sao Paulo Med J 2017;135:157–168.
https://doi.org/10.1590/1516-3180.2016.008607072016 |
| 34 | Lang F, Stournaras C, Zacharopoulou N, Voelkl J, Alesutan I. Serum- and glucocorticoid-inducible kinase 1 and the response to cell stress. Cell Stress 2019;3:1–8.
https://doi.org/10.15698/cst2019.01.170 |
| 35 | Hernandez AL, Kitz A, Wu C, Lowther DE, Rodriguez DM, Vudattu N, et al. Sodium chloride inhibits the suppressive function of FOXP3+ regulatory T cells. J Clin Invest 2015;125:4212–4222.
https://doi.org/10.1172/JCI81151 |
| 36 | Li J, Sun F, Guo Y, Fan H. High-Salt Diet Gets Involved in Gastrointestinal Diseases through the Reshaping of Gastroenterological Milieu. DIG 2019;99:267–274.
https://doi.org/10.1159/000493096 |
| 37 | Wiechers C, Zou M, Galvez E, Beckstette M, Ebel M, Strowig T, et al. The microbiota is dispensable for the early stages of peripheral regulatory T cell induction within mesenteric lymph nodes. Cell Mol Immunol 2021;18:1211–1221.
https://doi.org/10.1038/s41423-021-00647-2 |
| 38 | Bier A, Braun T, Khasbab R, Di Segni A, Grossman E, Haberman Y, et al. A High Salt Diet Modulates the Gut Microbiota and Short Chain Fatty Acids Production in a Salt-Sensitive Hypertension Rat Model. Nutrients 2018;10:1154.
https://doi.org/10.3390/nu10091154 |
| 39 | Rasini E, Cosentino M, Marino F, Legnaro M, Ferrari M, Guasti L, et al. Angiotensin II type 1 receptor expression on human leukocyte subsets: a flow cytometric and RT-PCR study. Regul Pept 2006;134:69–74.
https://doi.org/10.1016/j.regpep.2006.01.007 |
| 40 | Nataraj C, Oliverio MI, Mannon RB, Mannon PJ, Audoly LP, Amuchastegui CS, et al. Angiotensin II regulates cellular immune responses through a calcineurin-dependent pathway. J Clin Invest 1999;104:1693–1701.
https://doi.org/10.1172/JCI7451 |
| 41 | Maeda A, Okazaki T, Inoue M, Kitazono T, Yamasaki M, Lemonnier FA, et al. Immunosuppressive effect of angiotensin receptor blocker on stimulation of mice CTLs by angiotensin II. Int Immunopharmacol 2009;9:1183–1188.
https://doi.org/10.1016/j.intimp.2009.06.006 |
| 42 | Platten M, Youssef S, Hur EM, Ho PP, Han MH, Lanz TV, et al. Blocking angiotensin-converting enzyme induces potent regulatory T cells and modulates TH1- and TH17-mediated autoimmunity. Proc Natl Acad Sci U S A 2009;106:14948–14953.
https://doi.org/10.1073/pnas.0903958106 |
| 43 | Zhang J, Patel MB, Song Y-S, Griffiths R, Burchette J, Ruiz P, et al. A novel role for type 1 angiotensin receptors on T lymphocytes to limit target organ damage in hypertension. Circ Res 2012;110:1604–1617.
https://doi.org/10.1161/CIRCRESAHA.111.261768 |
| 44 | Oberleithner H, Peters W, Kusche-Vihrog K, Korte S, Schillers H, Kliche K, et al. Salt overload damages the glycocalyx sodium barrier of vascular endothelium. Pflugers Arch 2011;462:519–528.
https://doi.org/10.1007/s00424-011-0999-1 |
| 45 | Korte S, Wiesinger A, Straeter AS, Peters W, Oberleithner H, Kusche-Vihrog K. Firewall function of the endothelial glycocalyx in the regulation of sodium homeostasis. Pflugers Arch 2012;463:269–278.
https://doi.org/10.1007/s00424-011-1038-y |
| 46 | Bkaily G, Simon Y, Jazzar A, Najibeddine H, Normand A, Jacques D. High Na+ Salt Diet and Remodeling of Vascular Smooth Muscle and Endothelial Cells. Biomedicines 2021;9:883.
https://doi.org/10.3390/biomedicines9080883 |
| 47 | Endemann DH, Touyz RM, Iglarz M, Savoia C, Schiffrin EL. Eplerenone prevents salt-induced vascular remodeling and cardiac fibrosis in stroke-prone spontaneously hypertensive rats. Hypertension 2004;43:1252–1257.
https://doi.org/10.1161/01.HYP.0000128031.31572.a3 |