Curbing Breast Cancer by Altering V-ATPase Action on F-Actin, Heterochromatin, ETV7 and mTORC2 Signaling
Keywords
Abstract
Background/Aims:
Motivated by the vacuolar proton pump’s importance in cancer, we investigate the effects of proton pump inhibition on breast cancer cell migration and proliferation, F-actin polymerization, lamin A/C, heterochromatin, and ETV7 expressions, nuclear size and shape, and AKT/mTOR signaling.Methods:
Lowly metastatic MCF7 and highly metastatic MDA-MB-231 breast cancer cells were treated with 120 nM of proton pump inhibitor Bafilomycin A1 for 24 hours. Cell migration was studied with wound- scratch assays, ATP levels with a chemiluminescent assay; cell proliferation was quantified by a cell area expansion assay. Nuclear size and shape were determined using DAPI nuclear stain and fluorescence microscopy. The levels of F-actin, lamin A/C, heterochromatin, and ETV7 were quantified using both immunocytochemistry and western blots; p-mTORC1, p-mTORC2, mTOR, p-AKT, and AKT were measured by western blots.Results:
We reveal that proton pump inhibition reduces F-actin polymerization, cell migration, proliferation, and increases heterochromatin in both lowly and highly metastatic cells. Surprisingly, Bafilomycin decreases lamin A/C in both cell lines. Inhibition has different effects on ETV7 expression in lowly and highly metastatic cells, as well as nuclear area, perimeter, and circularity. Bafilomycin also significantly decreases p-mTORC1, p-MTORC2, and MTOR expression in both cell lines, whereas it significantly decreases p-AKT in lowly metastatic cells and surprisingly significantly increases p-AKT in highly metastatic cells. Our proton pump inhibition protocol reduces V-ATPase levels (~25%) within three hours. V-ATPase levels vary in time for both control and inhibited cells, and inhibition reduces cellular ATP.Conclusion:
Proton pumps promote F-actin polymerization and decrease heterochromatin, facilitating invasion. These pumps also upregulate both mTORC1 and mTORC2, thus highlighting the relevance of vacuolar proton pumps as metastatic cancer targets.Introduction
The vacuolar H+-ATPase (V-ATPase) is among the most essential enzymes in nature [1]. It is universally found in eukaryotic organisms’ organelle membranes, where its proton-pumping action controls the organelle pH, such as in lysosomes [2]. When located at the plasma membrane, as is common in metastatic cancer cells, particularly breast cancer [3–5] – as well as specialized acid-secreting cells including osteoclasts and kidney epithelial cells – proton pumps acidify the extracellular environment and activate proteases. These degrade extracellular matrices (ECM), facilitating cell migration [6, 7]. Their important roles in physiological processes in numerous cell types have implicated them in several maladies including renal disease, bone disease, and tumor metastasis (by degrading the extracellular environment via acidification [8]). V-ATPase is additionally involved with regulating several pathways overexpressed in cancers [9]. We hypothesize that V-ATPase controls both cellular and nuclear mechanical properties in tumor cells promoting migration and metastasis by altering F-actin polymerization, and lamin A/C and heterochromatin expressions (illustrated in Fig. 1). We explore these proposed new connections using the potent V-ATPase inhibitor Bafilomycin A1 (BAF) [10, 11] and breast cancer cells because breast cancer is the most common worldwide cause of cancer death for women [12].
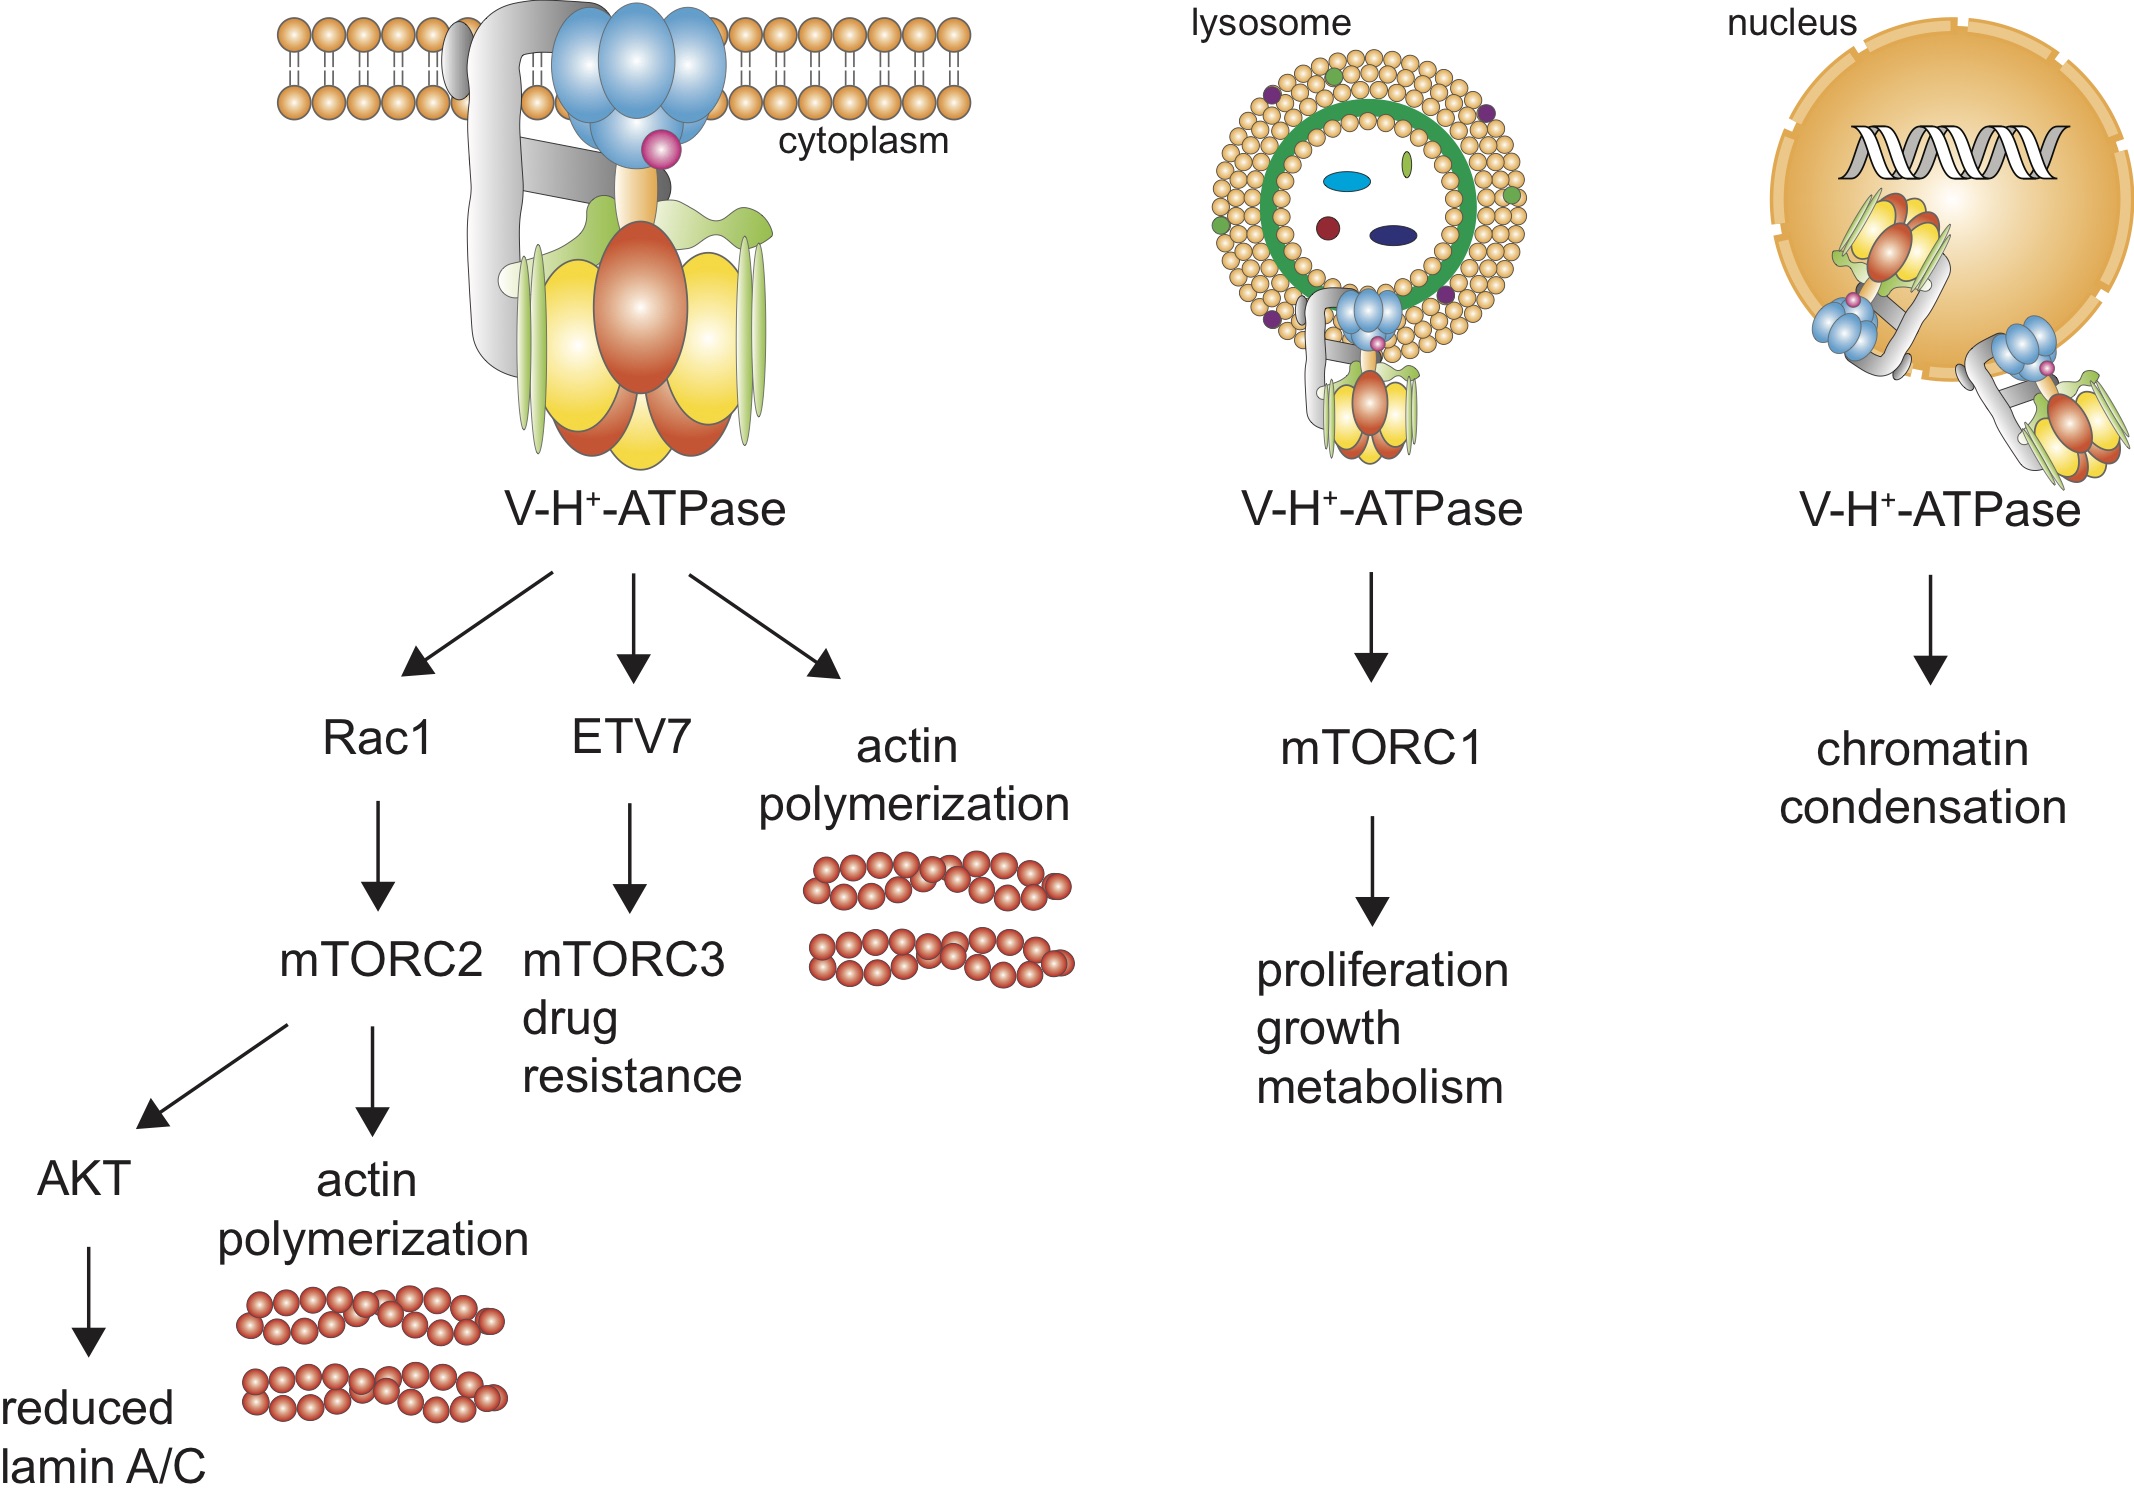
Fig. 1: Pathways for our hypothesized V-ATPase’s actions in cancer cells. (A) Plasma membrane V-ATPase is depicted. (B) lysosomal V-ATPase, and (C) nuclear envelope V-ATPases.
mTOR (mechanistic target of rapamycin) is dysregulated in many cancers [13]. This protein kinase forms at least three independent complexes (mTORC1, mTORC2, mTORC3) with distinct roles [13, 14]. Because of their importance in our study we will first review mTORC1 and mTORC2. V-ATPase is a critical regulator of mTORC1; it stimulates Rag (short for “recombination activating gene”) to recruit mTORC1 to lysosome surfaces where it is activated by Rheb (name for “Ras homolog enriched in brain”) [15, 16]. mTORC1 is overexpressed in many cancers including breast, colon, lung, uterine corpus endometrioid, and ovarian [15, 17]; it regulates cell growth, proliferation, and metabolism [6, 18, 19] – resulting in increases in cell size, invasion, metastasis, and protein synthesis [20].
At the cell plasma membrane, V-ATPase may activate Rac1, demonstrated by pharmacological inhibition or knockdown of V-ATPase causing reduced Rac1 signaling (in breast and pancreatic cancer cells) [21, 22]. Rac1, a Rho- GTPase enzyme, regulates the actin cytoskeleton in lamellipodia and hence cell morphology and motility [21, 23], and can regulate mTORC2 (in osteoclasts) [24]. mTORC2 activates cancer cell glucose and lipid metabolism, and controls complex cytoskeletal changes via phosphorylation of AGC kinase PKC-α [13], promoting cancer cell migration [13, 15]. mTORC2 is stimulated by nutrients, growth factors, hormones, hypoxia, and physical connection with ribosomes [20, 25, 26]. mTORC2 activity and function was previously speculated to be independent of V-type proton pumps [27] – however, we show that V-ATPase is a key player in mTORC2 activation using BAF. As mTORC2 lies upstream of AKT, it can activate AKT [28]. AKT is a key regulator of proliferation and survival pathways, where its mutations lead to pathogenesis and tumorigenesis in several cancer types [28]. We also show below that proton pump inhibition has differential effects on AKT signaling in lowly and highly metastatic breast cancer cells.
We speculate that V-ATPase is involved in activating the newest member of the mTOR family – mTOR complex 3. A recent study demonstrated that mTOR binds with the ETS (E26 transformation-specific) transcription factor ETV7 in the cytoplasm and assembles a new complex, mTORC3, that does not contain key mTORC1 and mTORC2 components Raptor and Rictor. This assembly is independent of ETV7’s transcriptional activity in the nucleus – ETV7 cannot perform transcription outside of the nucleus and mTORC3 does not assemble in the nucleus [14]. While this newly discovered complex’s importance in cancer is yet to be revealed, its role in drug resistance has been demonstrated: mTORC1 is rapamycin sensitive, mTORC2 is also but only to long-term treatment, while mTORC3 is not [14]. ETV7 has been identified as an oncogene in hematological malignancies [29] and has recently been implicated in breast cancer chemoresistance [30]. This factor has been rarely studied due to its lack of expression in mice. Harwood et al.’s [14] analysis of Oncomine gene expression data showed that ETV7 is in the top 10% of up-regulated genes in many cancers including leukemia, brain, bladder, and gastric cancers. Most members of the broader ETS family have been shown to play key roles in integrin signaling pathways [31]. ETV7 acts in an additional pathway – it can be phosphorylated by the JNK1 and p38α mitogen-activated protein kinases [32], members of the MAPK signaling family, that play a key role in the translation of extracellular signals to cellular responses via binding with transcription factors and altering gene transcription [33]. MAPK is activated by integrin binding with appropriate substrates [34], thereby providing a possible interaction with V-ATPase. The vacuolar pump has a β 1 integrin binding site [35], suggesting a role for V-ATPase in β 1 integrin expression, localization, and function. Indeed, we have shown that prostate cancer cells exposed to shear stress increase both V-ATPase and β 1 integrin expression [9]. Furthermore, treating cells with BAF and shear stress reduced β 1 integrin expression significantly – by approximately 50% – in comparison with control cells exposed to shear stress [9]. Another study has also shown that proton pump inhibition reduces β 1 integrin expression in urinary carcinoma cells [36]. These findings imply that V-ATPase regulates β 1 integrin expression. Here we show that V-ATPase inhibition reduces ETV7 in highly metastatic breast cancer cells, but increases it in lowly metastatic cells – the primary emphasis of our work.
Polymerized F-actin is the principal determinant of the cytoplasm’s mechanical properties [37, 38]. Therefore, proteins and pharmacological treatments which alter it regulate cell migration and invasiveness. Imaging of breast cancer cells [5, 39] and osteoclasts [40] show that V-ATPase co-localizes with actin in the cortex in an asymmetric manner – the proton pumps were clustered in one location in the plasma membrane, which has been shown to be the leading edge of migrating cancer cells [10, 41]. This asymmetric pump distribution can create an internal pH gradient that polymerizes F-actin more quickly in the alkali conditions at the leading edge of the migrating cell [42]. Additionally, V-type proton pumps have two F-actin binding sites in the V1 domain, on the B subunits in mouse marrow cells, and C subunits in tobacco hornworm cells [43, 44]. Vitavska et al. addressed the physical effects of V-ATPase on F-actin, in addition to simply binding. They showed that subunit C stabilizes rabbit muscle F-actin in in vitro conditions that would promote depolymerization (using an actin depolymerizing buffer). They also showed that subunit C promotes F-actin polymerization in a concentration-dependent manner, and that co-incubation of subunit C with polymerized F-actin increases the formation of branched cross-linked structures [44]. Recent conflicting findings on the effects of proton pump inhibition on F-actin in different cancer cell types mandate further careful studies [5, 9, 41, 45]. Hence, we investigate the effect of V-ATPase inhibition on breast cancer cell F-actin polymerization and cellular migration.
Cell deformability and migration significantly depend on the nucleus, since it is the largest and stiffest organelle [46, 47]. Reducing nuclear deformability may decrease confined cell migration through narrow spaces, suppressing metastasis. Nuclear deformability depends on several structural proteins and associated pathways, where the main focus has been on the contribution of lamins and chromatin [48].
Lamins are nuclear envelope intermediate filaments with two subtypes – A-type (A, C, C2) and B-type (B1-3) – both forming separate but interlaced networks [46]. Micropipette aspiration and cell stretching experiments show that nuclear stiffness strongly scales with A-type levels [48–50]. Additionally, cells with low lamin A/C levels have more deformable nuclei and migrate faster through confining spaces than cells with normal levels [51, 52].
Chromatin, composed of DNA wrapped around histone octamers, occupies the majority of the nucleus’ interior volume, also affects nuclear deformability [47]. Chromatin can be in an open decondensed configuration referred to as euchromatin; this configuration is transcriptionally active as it can be accessed by transcription factors. It can also be in a closed condensed configuration – heterochromatin – associated with inactive genes [48]. Pharmacological chromatin decondensation results in softer and more deformable nuclei [46, 47], whereas pharmacological condensation results in stiffer nuclei [46]. V-ATPase pumps have recently been discovered on the nuclear envelope (NE) [53] – their purpose was ascribed as independently regulating nuclear pH. We hypothesize that NE V-ATPase controls cancer migration and invasiveness by altering nuclear deformability. NE V-ATPase can directly affect chromatin condensation by setting the nuclear pH, since chromatin aggregates and condenses at low pH in vivo within the physiological range of 5.4-8.3 [54]. V-ATPase pumps may additionally affect biochemical pathways that control lamin A/C expression such as the AKT signaling pathway [55]. We investigate the role of V-ATPase on lamin A/C and chromatin in breast cancer cells using proton pump inhibition.
We find that proton pump inhibition via treatment of a non-toxic dose of BAF for 24 hours reduces F-actin polymerization, cell migration, and increases heterochromatin in lowly metastatic MCF7 and highly metastatic MDA-MB- 231 (MB231) cells. Also, BAF surprisingly decreases lamin A/C in both lowly and highly metastatic breast cancer cells. We further find that BAF increases ETV7 expression in lowly metastatic, but decreases ETV7 expression in highly metastatic cells. Proton pump inhibition significantly decreases p-mTORC1, p-MTORC2, and MTOR expression in both MCF7 and MB231 cells, whereas it differentially affects AKT signaling; decreasing p-AKT in lowly metastatic MCF7 cells and increasing p-AKT in highly metastatic MB231 cells. These findings establish the relevance of vacuolar proton pumps as targets for further cancer research.
Materials and Methods
Cell culture
MCF7 and MDA-MB-231 breast cancer cells were purchased from the ATCC (Manassas, VA) and were cultured at 37° C and 5% CO2. The cells were cultured in DMEM medium (Gibco 11965092, Thermo Fisher Scientific, Massachussets, USA), supplemented with 10% fetal bovine serum (FBS) (Gibco 16000044) and 1% penicillin-streptomycin (Gibco 15140122). For every passage and experiment, cells were harvested by incubating with trypsin (Gibco 25200072 – 3 ml per flask) at 37° C for 3 minutes. Trypsin was inhibited by adding 10 ml of culture media. Cells were centrifuged for 5 minutes at 1000 rpm (Eppendorf Centrifuge 5804R, Hauppauge, New York, USA), the supernatant was removed, cells were suspended in 2 ml of fresh medium, and counted with trypan blue (Gibco 15250061) using an automated cell counter (TC20, Bio-Rad, Berkeley, California, USA).
Bafilomycin A1 treatment
We used Bafilomycin A1, a well-known V-type proton pump inhibitor that binds to subunits a and c of the proton pump’s V0 domain inhibiting proton transport in addition to reducing expression of three V-ATPase genes [10]. Breast cancer cells were cultured until 80% confluent. Bafilomycin A1 (BAF, LC Laboratories, B-1080) cells were exposed to 120 nM for 24 hours in cell culture media (unless otherwise stated) and control (CTRL) cells were exposed to cell culture media containing the equivalent volume of DMSO as BAF treated cells (0.01% by volume) for 24 hours. DMSO was used as a loading control because Bafilomycin A1 is dissolved in DMSO. Cell counting with trypan blue revealed no differences in the number of viable cells between CTRL and BAF conditions (data not shown).
ATP assay
We performed an ATP assay to see the effect of BAF on metabolic flux. MCF7 and MB231 cells were seeded at a density of 2 x 10⁴ cells per well in a 96 well plate and cultured with serum-free media for 24 hours. Cells were then treated with 120 nM BAF or DMSO (control) for 24 hours prior to performing the assay (see above). We used Cell Titer Glo 2.0 (Promega) according to the manufacturer’s instructions. In brief, 100 µ l of Cell Titer Glo reagent was added to 100 µ l of medium containing cells, the contents were mixed for 2 minutes in the dark on a rocking shaker to lyse cells, the plate was incubated at room temperature for 10 minutes in the dark, and the assay was imaged using a chemiluminescent blot image analyzer (ChemiDocMP, Bio-Rad) with an exposure time of 15 s. An image of the assay is shown in Fig. 4. The image was inverted, and greyscale values from each well were measured using ImageJ.
Extracellular pH assay
An extracellular pH assay was performed to examine the effects of our BAF treatment on V-ATPase activity. MCF7 and MB231 cells were seeded at a density of 4 x10⁵ cells per well in six well plates (R37605, Thermo Fisher Scientific) in serum free media. BAF or DMSO (controls) were added as described above. The pH of the media was measured using an Orion Versa Star pH meter (VSTAR10, Thermo Fisher Scientific) at t = 0, 3, 6, 12, and 24 hours. Results are displayed as ∆pH = pH at the current time - pH at t = 0 [56].
Cell migration assay
Cells were seeded on 6 well plates (R37605, Thermo Fisher Scientific) and grown until confluent. A scratch was made in each well with a 200 µ l pipette tip, cells were rinsed with DPBS (Gibco 14190144) and vigorously shaken to remove cells from the edges of the wounds. Control and BAF treated cells were treated as described above with DMSO or BAF in serum-free media, the wound was imaged using an EVOS microscope with a black and white camera with 10x magnification (EVOS XL, AMEX1000, Thermo Fisher Scientific), incubated for 24 hours, and imaged again. 10 images were taken of each wound for three replicates. Wound width was measured using ImageJ.
Cell proliferation assay
1 x 10⁵ cells were seeded into six well plates and treated with BAF or DMSO (controls) for 24 hours. Cells were fixed with 95% ethanol and 5% acetic acid, washed with PBS, and stained with Giemsa (diluted 1:20 with RO water, 32884, Millipore Sigma) for 60 minutes, rinsed with RO water 5 times, left to air dry, and imaged at 20x magnification with an EVOS microscope. 10 images per replicate for three replicates were recorded. To determine the % area occupied by cells, an Otsu threshold was applied to each image, the number of pixels below the threshold were counted, divided by the total number of pixels in each image, and multiplied by 100. ImageJ was used for image analysis.
Immunocytochemistry
Cells were cultured on coverslips until sub-confluent, treated with BAF or CTRL as described above for 24 hours, then fixed with 4% paraformaldehyde. Cells were quenched with Phosphate Buffer Saline (PBS) and 50 mM NH4Cl (Sigma-Aldrich, 213330) for 10 minutes, permeabilized with 0.1% PBS- Triton for 10 minutes, and blocked with 1% PBS-BSA (Sigma-Aldrich, A2153) for 15 minutes. Samples were incubated with primary antibodies against V-H+-ATPase subunit c (Developmental Studies Hybridoma Bank or DSHB, 224-256-2-s, 1:50 dilution), ETV7 (DSHB PCRP-ETV7-1A1-s, 1:50), lamin A/C (DSHB MANLAC1(4A7), 1:50), and HP1α for heterochromatin (Cell Signaling Technology or CST, 2616, 1:100) for 1 hour at room temperature. The coverslips were then washed 7 times and incubated with secondary antibodies (anti-mouse R37121, or anti-rabbit R37117, ThermoFisher Scientific) conjugated with alexa fluor 594, and alexa fluor phalloidin 488 (dilution 1:100 in PBS-BSA, Molecular probes by Life Technologies, A12379) that specifically stains F-actin, for 1 hour. After staining, the coverslips were washed 7 times with PBS and mounted on glass slides using Prolong Gold antifade reagent with DAPI nuclear stain (Molecular probes by Life Technologies, P36935). Images were obtained at 40x magnification using a Nikon Eclipse fluorescence microscope, except for Fig. 3 where images were obtained at 20x magnification. MB231 cells were imaged with an Andor Zyla 4.2 sCmos camera, and MCF7 cells were imaged with a Hamamatsu ORCA-FLASH 4.0 LTS+ SCMO camera.
The cells’ corrected cell fluorescence density, taking into account background fluorescence, was calculated as: CCFD = CID - MBI x Area , where CCFD is the corrected cell fluorescence density, CID is the integrated cell fluorescence density (the product of average cell grayscale and cell area), MBI is the average background intensity (averaged over 8 regions near the cell), and Area is the cell area [57]. CCFD was calculated from raw fluorescence images. Images were analyzed using ImageJ. For quantification of ETV7 nuclear fluorescence, DAPI nuclear images were used as a mask. The DAPI images were thresholded with the Otsu method, where nuclear pixels had a value of 1 and background pixels had a value of 0. The mask image was multiplied by ETV7’s TXRED image, thus isolating the ETV7 signal to the nucleus. Nuclei were measured using ImageJ’s particle analysis package, where nuclear area and average fluorescence intensity were measured. The nuclear CCFD was calculated, where the background fluorescence was determined close to but outside of each cell. For displaying images, backgrounds were subtracted using ImageJ’s 50 pixel rolling ball radius. False pseudocolor images were produced using Adobe Photoshop, by selecting a color range for each linearly contrast enhanced inverted image (from ImageJ), then using the color range package to create a new adjustment layer which was then colorized.
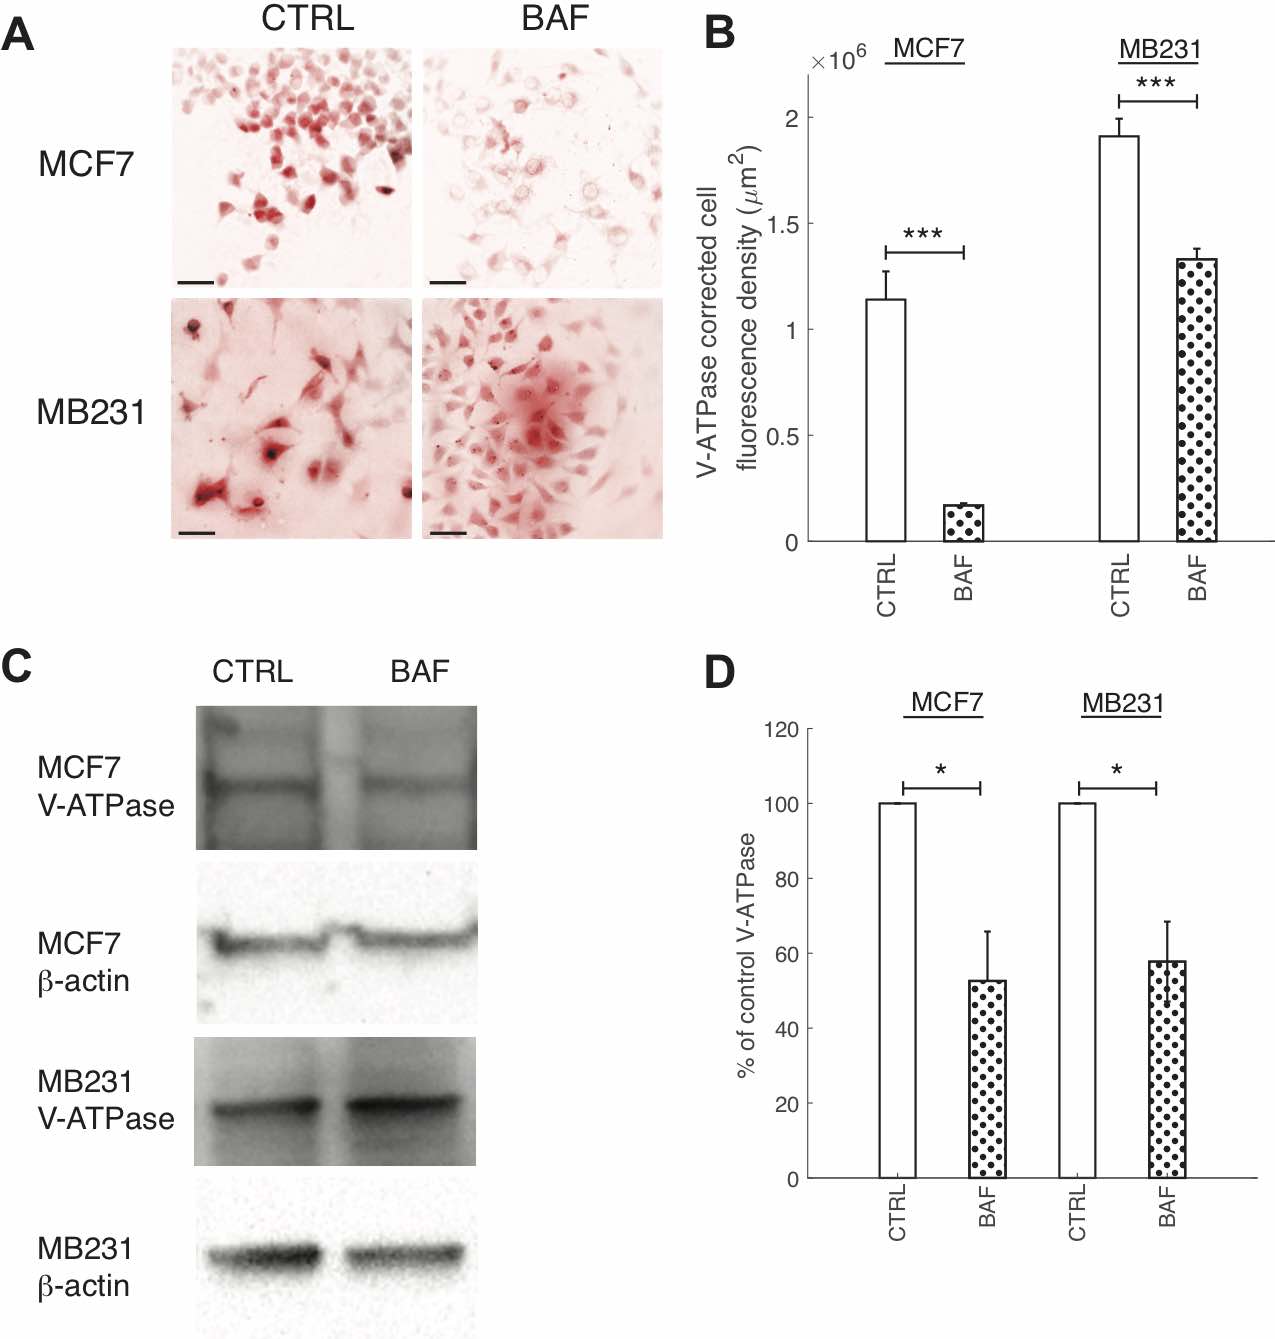
Fig. 2: BAF reduces V-ATPase expression. (A) Representative ICC images of V- ATPase in CTRL and BAF treated MCF7 and MB231 cells shown as inverted contrast enhanced fluorescence image with red pseudocolor; greyscale values in the range of [0, 2000] for MCF7 and [0, 9472] for MB231 were linearly rescaled to [0, 65535]. Different ranges were rescaled for the different cell lines because different cameras were used to image each cell line. Scale bars are 20 μm. (B) Average corrected cell fluorescence density of V-ATPase SEM of CTRL and BAF treated MCF7 and MB231 cells. MCF7 CTRL N = 271, MCF7 BAF N = 289, MB231 CTRL N = 325, MB231 BAF N = 341. *** P < 1 x 10⁻⁵. (C) Representative western blots for V-ATPase in MCF7 and MB231 CTRL and BAF treated cells. β-actin was used as a loading control. (D) Average V-ATPase band densities normalized by β-actin and expressed as % of CTRL SEM. For MCF7 and MB231 N = 4. * P<0.05. Statistical comparisons used the two-sample Kolmogorov-Smirnov test.
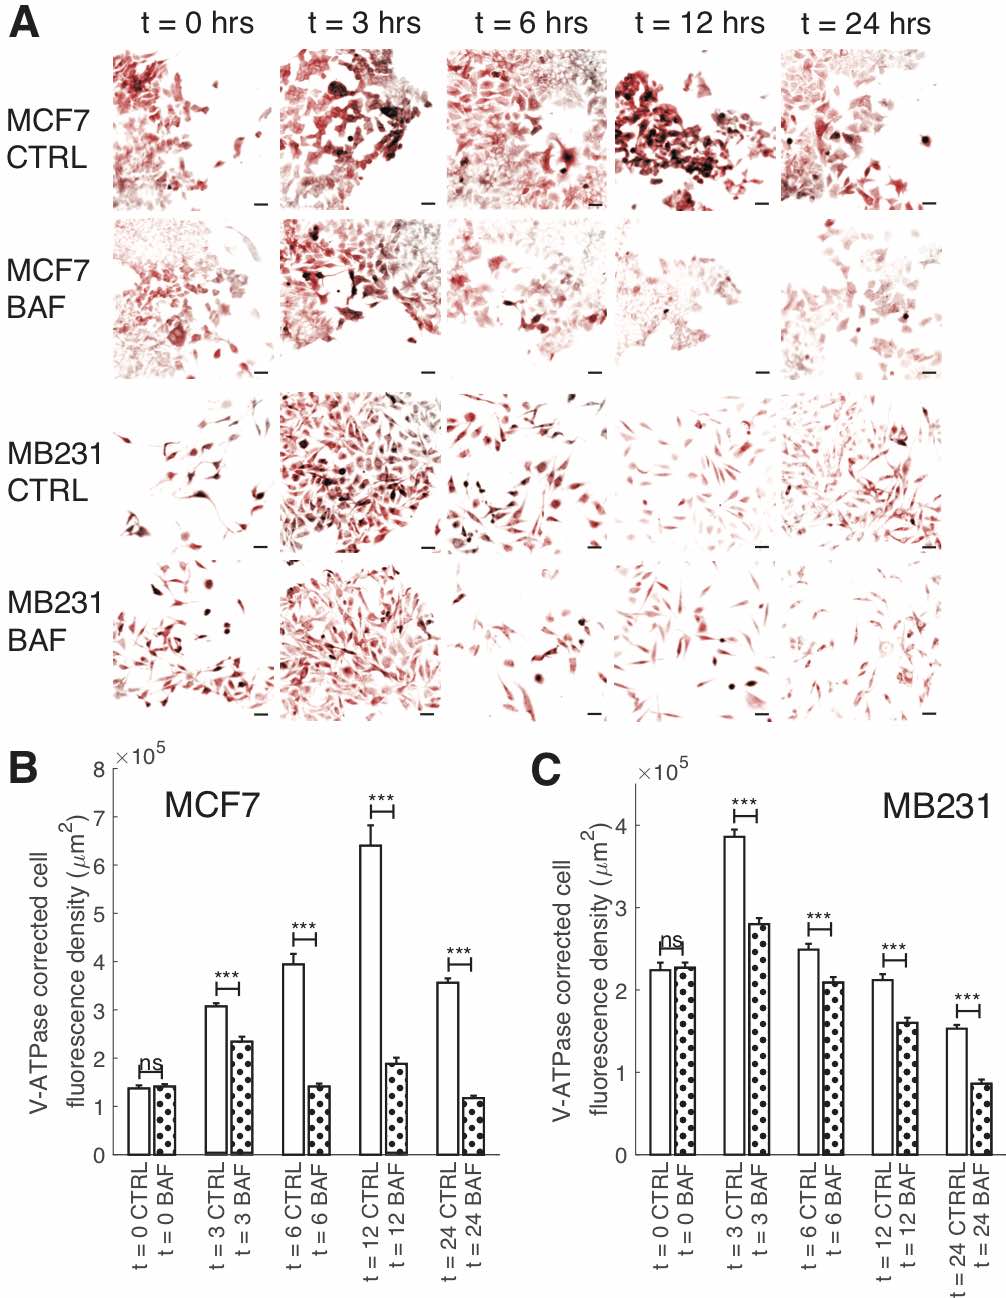
Fig. 3: Reduction of V-ATPase fluorescence over time by BAF. (A) Representative ICC images of V-ATPase in CTRL and BAF treated MCF7 and MB231 cells at selected time points shown as inverted contrast enhanced fluorescence images with red pseudocolor; greyscale values in the range of [124, 1492] were linearly rescaled to [0, 65535]. Scale bars are 40 μm. (B) Average corrected cell fluorescence density of V-ATPase SEM of CTRL and BAF treated MCF7 cells. MCF7 CTRL: t = 0 N = 391; t = 3 hrs N = 393; t = 6 hrs N = 397; t = 12 hrs N = 394; t = 24 hrs N = 417. MCF7 BAF: t = 0 N = 382; t = 3 hrs N = 400; t = 6 hrs N = 404; t = 12 hrs N = 421; t = 24 hrs N = 431. (C) Average corrected cell fluorescence density of V-ATPase SEM of CTRL and BAF treated MB231 cells at selected time points. MB231 CTRL: t = 0 N = 337; t = 3 hrs N = 417; t = 6 hrs N = 446; t = 12 hrs N = 291; t = 24 hrs N = 412. MB231 BAF: t = 0 N = 334; t = 3 hrs N = 433; t = 6 hrs N = 401; t = 12 hrs N = 321; t = 24 hrs N = 355. Cells were imaged from three replicates. *** P < 1 x 10⁻⁵, ns P ≥ 0.05. Statistical comparisons used the two-sample Kolmogorov-Smirnov test.
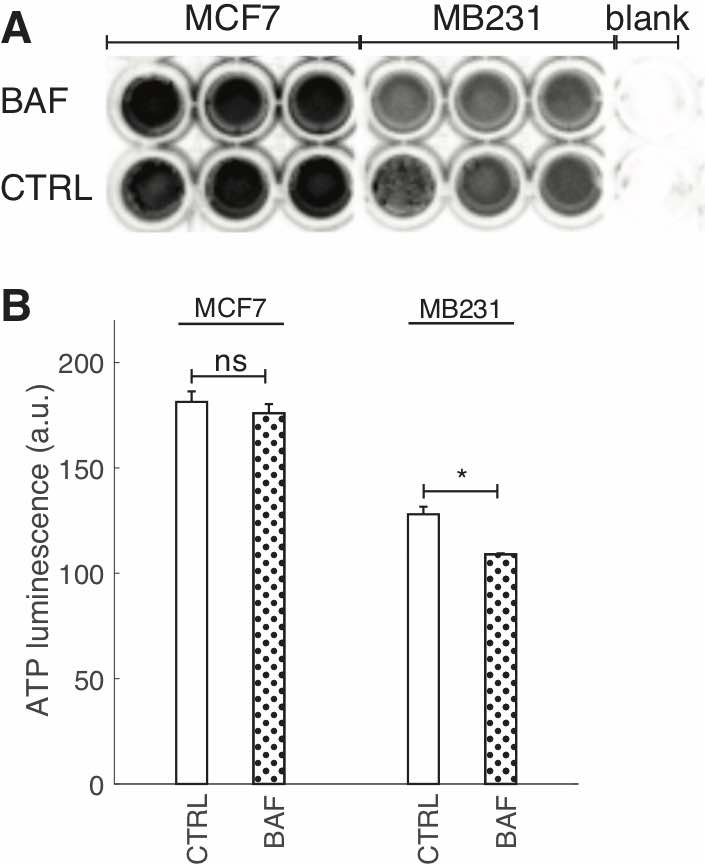
Fig. 4: BAF reduces cellular ATP. (A) Image of ATP luminescence in a 96 well plate for MCF7 CTRL and BAF treated, MB231 CTRL and BAF treated, and blank wells. (B) Average ATP luminescence (inverted) ± SEM from (A), N = 3 for both cell lines. * P<0.05, ns P ≥ 0.05. Statistical comparisons used the two-sample Kolmogorov-Smirnov test.
Western Blots
1 x 10⁶ cells were grown in T-75 flasks until 80% confluent and treated with BAF or DMSO (controls) in cell culture media for 24 hours. After trypsinization, cells were lysed with Pierce lysis buffer (87788, ThermoFisher Scientific) with Halt’s protease and phosphatase inhibitor cocktail (78440, ThermoFisher Scientific) following the manufacturer’s instructions. Protein concentrations were determined using the Pierce 660 colorimetric assay (22660, ThermoFisher Scientific) and a spectrophotometer/fluorometer (DeNovix, DS11 FX+, USA) using the nano drop function at 280 nm and was calibrated with dilutions of BSA standard (2 mg/ml, 500-0206, Bio-Rad). 40 µ g of protein was diluted in 4x laemmli sample buffer (1610747, Bio-Rad) with β -mercaptoethanol (1610710, Bio-Rad), placed in 4-20% gradient acrylamide gels (456-8094, Bio- Rad), and separated by electrophoresis. Proteins from the gels were transferred to PVDF membranes (1704156, Bio-Rad) using the Trans-Blot Turbo system (1704150, BioRad). Membranes were stained with Ponceau S (P3504, Millipore Sigma) solution for 5 minutes to verify protein transfer and washed three times with TBST (Tris Buffer Saline, 100 mM Tris-HCl pH 7.6, 150 mM NaCl, and 0.1% Tween, 170-6531, Bio-Rad).
Membranes were blocked with 5% BSA in TBS-T at room temperature for 1 hour, and subsequently incubated with primary antibodies overnight at 4◦ C, washed three times, and then incubated with anti-mouse or anti-rabbit IgG conjugated to horseradish peroxidase (1:10, 000, 115-035-068 or 111-036-003, Jackson-Immuno Research) in TBS-T for 2 h at room temperature. Primary antibodies for actin (DSHB JLA20- s), lamin A/C (DSHB MANLAC1(4A7)), HP1α for heterochromatin (CST 2616), ETV7 (DSHB PCRP-ETV7-1A1-s), V-ATPase (DSHB 224-256-2-s), p-mTORC1 (Ser2448) (CST 5536), p-mTORC2 (Ser2481) (CST 2974), mTOR (DSHB CPTC-MTOR-1-s), p-AKT (Ser473) (CST 4060), and AKT (DSHB CPTC-AKT1-2-s) were used. DSHB antibodies were diluted 1:100 and CST antibodies were diluted 1:500 in 5% TBST. A β -actin antibody conjugated to peroxidase was used as loading control (dilution 1:50, 000, A3854, Millipore Sigma). The blots were developed using a horseradish peroxidase chemiluminescent substrate reagent kit (1705060, Bio-Rad) and visualized using a blot image analyzer (ChemiDocMP, Bio-Rad). Expression levels were quantified using ImageJ software. Non-phosphorylated proteins were normalized by the β -actin loading control; phosphorylated proteins were normalized by the corresponding non-phosphorylated protein.
Our PVDF membranes were stripped after visualization for further probing as follows. Membranes were washed in TBS-T for 5 mins, incubated with Restore PLUS Western Blot Stripping Buffer (46430, Thermo Scientific) for 30 mins, washed with TBS-T for 5 minutes, then blocked for 1 h – all at room temperature – prior to using the membrane with additional antibodies. We verified that the secondary antibodies do not have non-specific adhesion for proteins on our stripped and blocked membranes – see Supplementary Figures 1(A-B). Our stripping protocol was also confirmed to remove blot’s signal – see Supplementary Fig. 1(C).
Statistical Analysis
The results are expressed as means ± S.E.M. All statistical comparisons used the two-sample Kolmogorov-Smirnov test, where comparisons were considered significant at P < 0.05.
Results
The effects of Bafilomycin A1 on V-ATPase expression and ATP production
We quantified the effects of Bafilomycin A1 (BAF) on reducing V-ATPase expression with ICC and western blots. Our dosage (120 nM) and exposure time (24 hrs) were confirmed to significantly reduce V-ATPase fluorescence in ICC and expression in western blots – see Fig. 2. BAF reduces V-ATPase fluorescence in MCF7 cells by 85% (P < 1 x 10⁻⁵) and in MB231 by 43% (P < 1 x 10⁻⁵) in comparison with controls (Figures 2A,B), while in western blots it reduces V-ATPase expression by 45% in MCF7 (P < 0.05) and by 46% in MB231 cells (P < 0.05) (Figures 2C,D). Extracellular pH measurements were performed at different times to determine if the V-ATPase that remains in the breast cancer cell lines after BAF treatment was inhibited (see the appendix, Fig. 1) [56]. We observe that ∆pH – the difference in pH between t = 0 and the specified time point – is lower in magnitude with a higher value (less acidic) for BAF treated cells in comparison with CTRL. However, these differences in ∆pH are not statistically significant (P ≥ 0.05), suggesting that the remaining V-ATPase is not inhibited.
To examine the effects of BAF on V-ATPase over the course of 24 hours – the treatment time used for our experiments – we performed ICC on BAF treated and control (CTRL) MCF7 and MB231 cells at distinct time points (Fig. 3). We find that BAF treatment has no effect on V-ATPase fluorescence at t = 0 for both cell lines (103% MCF7, 101% MB231, P ≥ 0.05), whereas it significantly decreases V-ATP fluorescence at t = 3 hrs (76% MCF7, P < 1 x 10− 5; 73% MB231, P < 1 x 10− 5), t = 6 hrs (36% MCF7, P < 1 x 10− 5;84% MB231, P < 1 x 10− 5), t = 12 hrs (29% MCF7, P < 1 x 10− 5; 76% MB231, P < 1 x 10− 5), and t = 24 hrs (33% MCF7, P < 1 x 10− 5; 56% MB231, P < 1 x 10− 5) relative to CTRL. Note that V-ATPase fluorescence levels vary in time for both CTRL and BAF treated cells; we speculate that this may be due to varying glucose levels at cellular surfaces over the time course in cell culture as glucose regulates V-ATPase assembly and function [58]. It is possible that glucose additionally regulates V-ATPase protein expression and future studies should address this.
An ATP assay was performed to determine the effects of proton pump inhibition on metabolic flux – see Fig. 4. We find that 24 hrs BAF treatment did not significantly affect ATP production in MCF7 cells, however it significantly decreased ATP by ~15% in MB231 cells (Fig. 4C, P < 0.05). Some other studies have examined the effects of proton pump inhibition on ATP production in cancer cells; 100-1000 nM Archazolid (24 hours) had no effect on ATP levels in SKBR3 breast cancer cells, whereas 100 nM concanamycin had no effect but 300-1000 nM (24 hours) reduced ATP levels significantly [59]. Another study found that 250 nM of BAF (5 hours) had no effect on ATP levels in colon cancer HCT116 cells [60]. Perhaps our observed reduction in ATP in BAF treated MB231 cells but not MCF7 cells is due to the more aggressive cell line’s dependence on glucose for proliferation and growth – that was not observed for MCF7 cells [61, 62]. V-ATPase inhibition has been shown to alter HIF-1 signaling, where HIF-1 is a glycolysis regulator [63]. It is therefore possible that V-ATPase inhibition by BAF in MB231 cells resulted in reduced glycolysis leading to lower ATP production [59].
Proton pump inhibition reduces breast cancer cell migration and proliferation
We study the effect of proton pump inhibition on cell migration; our experimental approach is validated by prior extensive studies, which establish what we also show, that such inhibition reduces cell migration [56, 64–66]. Our result shows that 120 nM, 24 hours BAF significantly reduces (p< 0.05) lowly metastatic MCF7 cell migration in a wound scratch assay by 27%, and MB231 migration is significantly reduced (P< 0.05) by 10% in comparison with control – see Fig. 5. We will show here that such migration reduction is possible if proton pump inhibition reduces F-actin polymerization, promoted by plasma membrane proton pumps [10].
Although it is known that proton pump inhibition [10, 64, 67–69] reduces cancer cell proliferation significantly, here we demonstrate that our treatment protocol also reduces breast cancer cell proliferation (using a 24 hour cell area expansion assay); see Fig. 6. We find that BAF treatment significantly (P< 0.05) reduces both lowly metastatic MCF7 cell area coverage by 22% and highly metastatic MB231 cell area coverage by 14%.
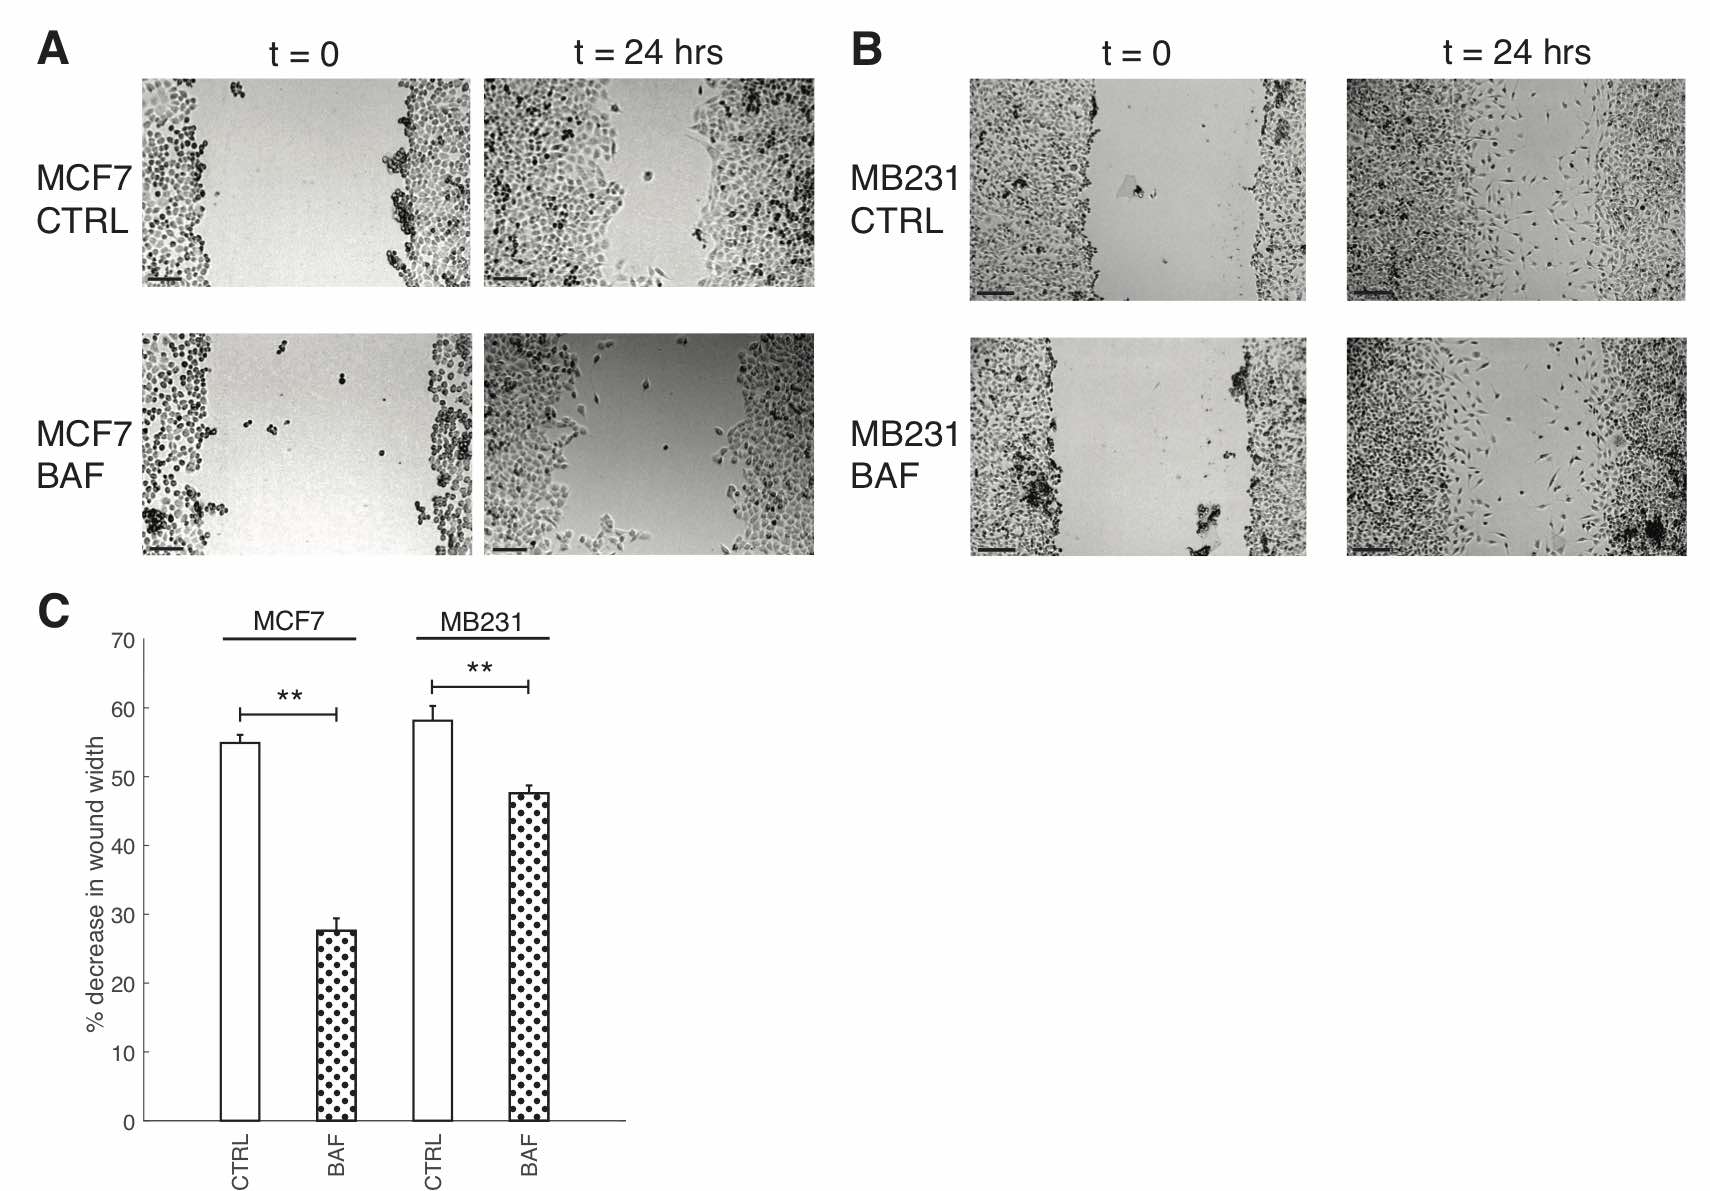
Fig. 5: Proton pump inhibition reduces breast cancer cell migration. (A) Representative images of control (CTRL) MCF7 cells and MCF7 cells treated with 120 nM of Bafilomycin A1 for 24 hours (BAF), imaged at 0h and 24h. Grayscale values in the range of: [44,78] CTRL t=0; [71, 99] CTRL t = 24 hrs; [71, 104] BAF t = 0; [42, 77] BAF t = 24 hrs are linearly rescaled to [0, 255]. (B) Representative images of control (CTRL) MB231 cells and MB231 cells treated with 120 nM of Bafilomycin A1 for 24 hours (BAF), imaged at 0h and 24h. Grayscale values in the range of: [47, 100] CTRL t=0; [81, 132] CTRL t = 24 hrs; [37, 75] BAF t = 0; [69, 109] BAF t = 24 hrs are linearly rescaled to [0, 255]. Different greyscale value ranges were selected to rescale each image to enhance cell visualization. All scale bars are 200 μm. (C) Average % decrease in wound width SEM over 24 hrs. Averages were performed over three independent replicates with three images taken per replicate. ** P<0.01 where the statistical comparisons used the two-sample Kolmogorov-Smirnov test.
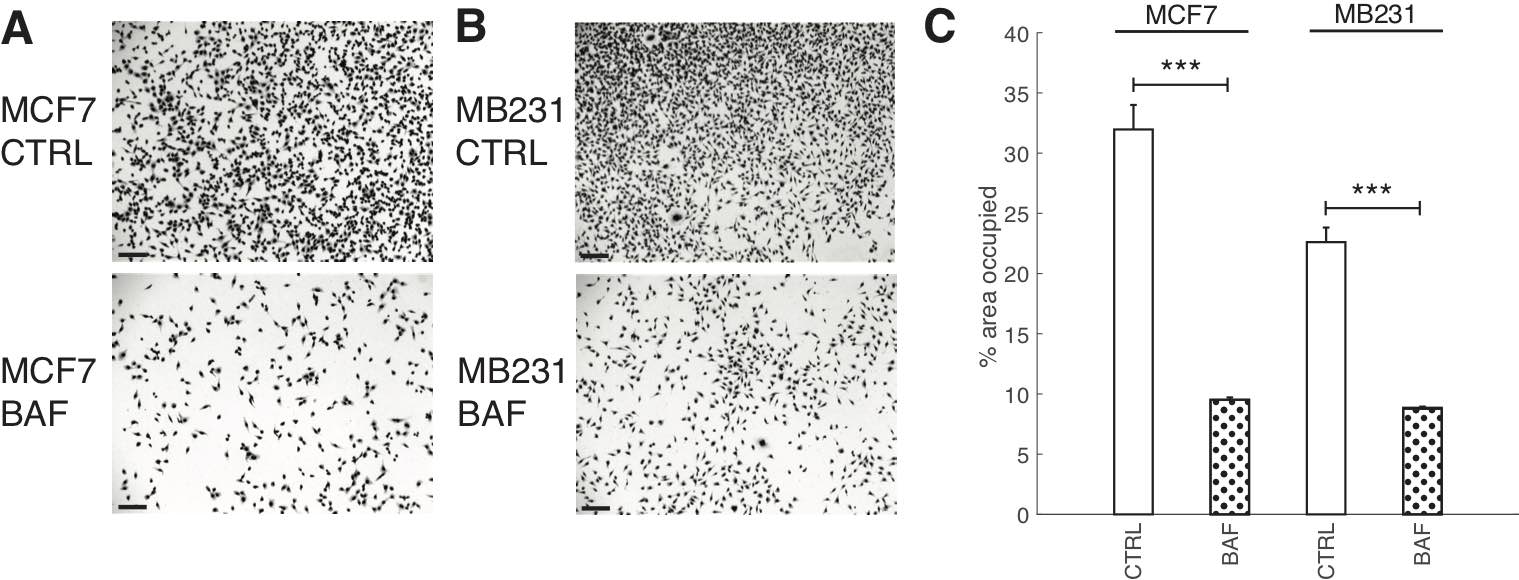
Fig. 6: Proton pump inhibition reduces cell proliferation. Representative images of CTRL and BAF treated MCF7 cells (A) and MB231 cells (B) proliferated for 24 hrs; stained with Giemsa solution. All scale bars are 100 μm. (C) Average % area SEM occupied by cells, calculated using ImageJ. Averages were taken over three independent replicates, with ten images taken per replicate. *** P < 1 x 10⁻⁵, the statistical comparisons used the two-sample Kolmogorov-Smirnov test.
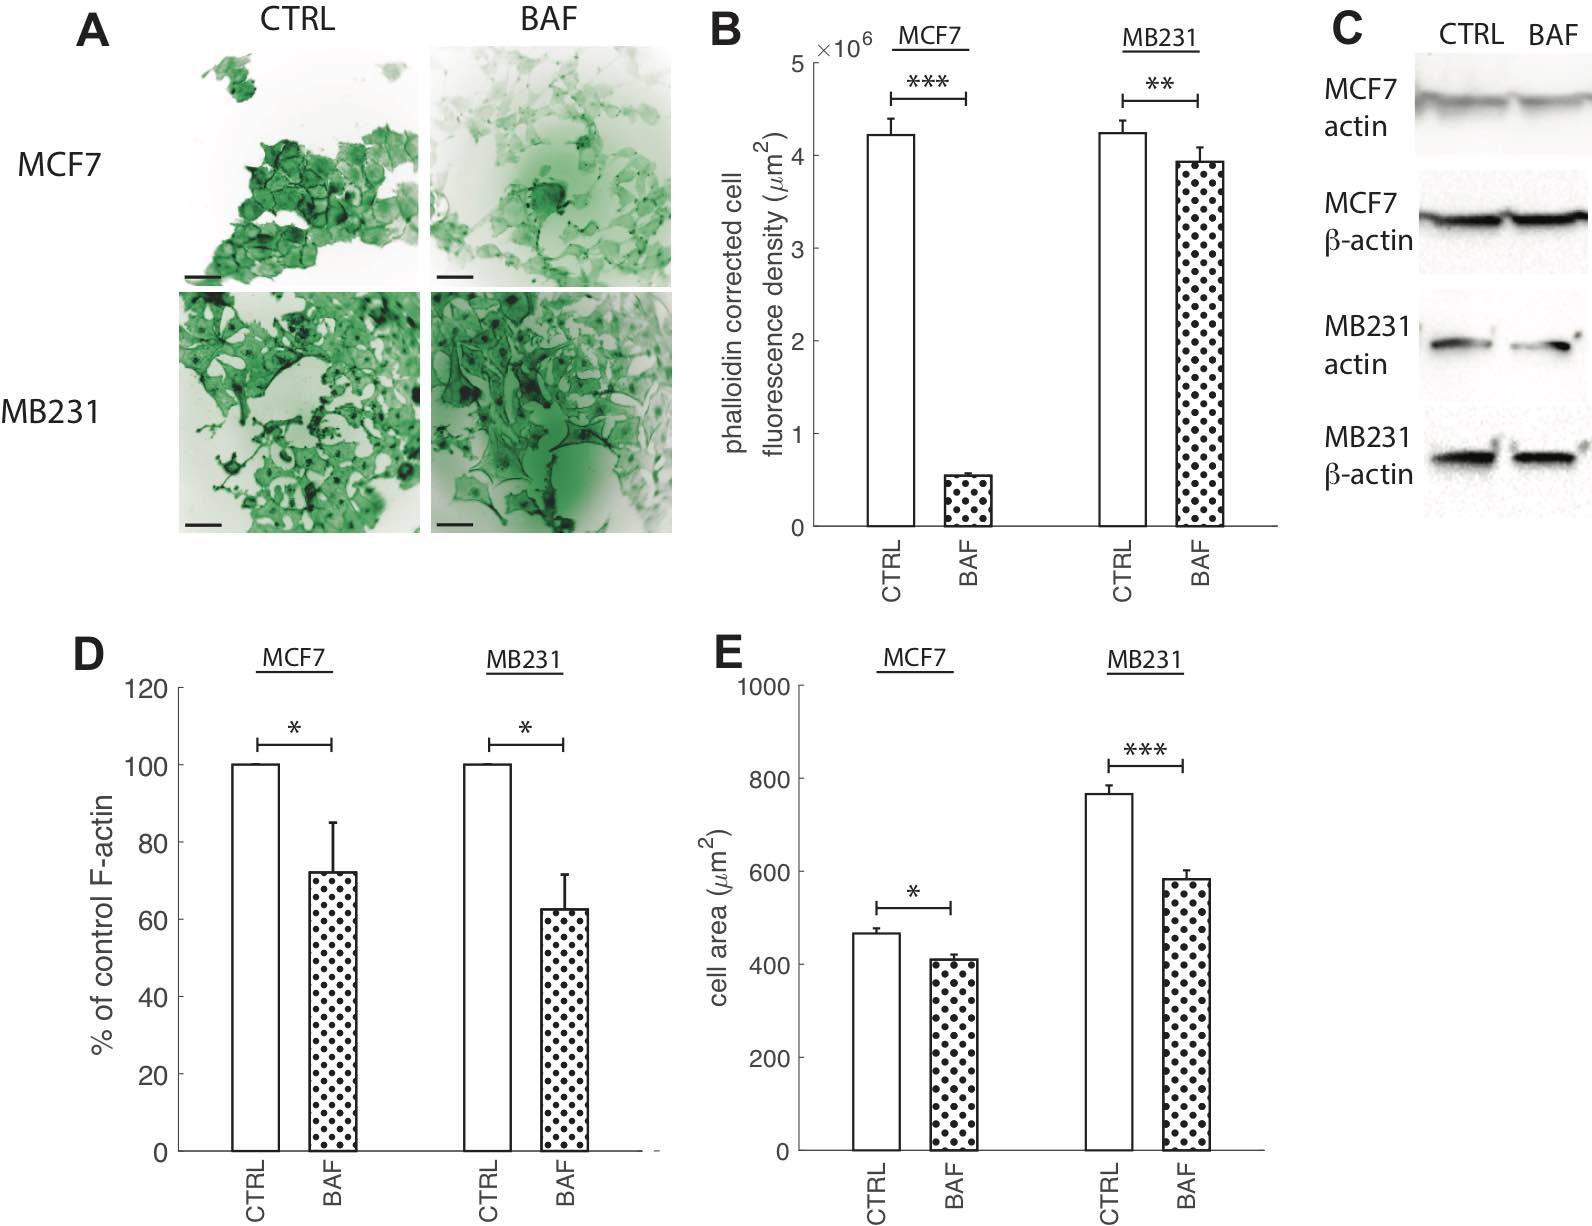
Fig. 7: Proton pump inhibition reduces F-actin polymerization. (A) Representative ICC images of phalloidin stained CTRL and BAF treated MCF7 and MB231 cells displayed as inverted contrast enhanced fluorescence images with green pseudocolor, where greyscale values in the range of [3, 45] MCF7 and [0, 90] MB231 were linearly rescaled to [0, 255]. Different ranges were rescaled for different cell lines because different cameras were used for imaging. Images were obtained at 40x magnification. Scale bars are 20 μm. (B) Average corrected cell fluorescence density of phalloidin SEM of CTRL and BAF treated MCF7 and MB231 cells. MCF7 CTRL N = 352, MCF7 BAF N = 344, MB231 CTRL N = 359, MB231 BAF N = 357. (C) Representative western blots for actin in MCF7 and MB231 CTRL and BAF treated cells. β-actin was used as a loading control. (D) Average actin band densities normalized by β-actin and expressed as % of CTRL SEM. For MCF7 and MB231 N = 4. (E) Average cell area, calculated from the phalloidin images, SEM. *** P < 1 x 10⁻⁵, ** P<0.01, * P<0.05. Statistical comparisons used the two-sample Kolmogorov-Smirnov test.
Proton pump inhibition reduces F-actin
Actin re-organization plays a vital role in cancer cell migration. Without its polymerization at the leading edge and depolymerization at the cell rear the cell would not be able to migrate [41]. Actin polymerization has been suggested to be pH dependent with higher pH promoting polymerization [42]. Therefore, the V-ATPase located at the leading edge in cancer cells and translocating protons across the plasma membrane lowering the internal pH promotes F-actin [10, 41]. Hence, although proton pump inhibition should reduce F-actin polymerization, prior experimental studies have shown controversial results [5, 9, 41, 45]. Prompted by this controversy, as well as by the importance of V-ATPase in cancer aggressiveness, we visualized F-actin with phalloidin for control cells and after V-ATPase inhibition. Fig. 7 shows that 24 hours of BAF treatment (120 nM) significantly (p< 0.05) reduces F-actin in both lowly metastatic MCF7 cells by 87% and highly metastatic MB231 cells by 7% (Fig. 7B) in comparison with controls. Western blots with an antibody specific to multiple actin isoforms support this finding (Fig. 7C), as blot analysis shows that BAF reduces actin in both MCF7 cells by 30% (P< 0.05) and MB231 cells by 38% (P< 0.05, Fig. 7D). We additionally measured changes in cell size from phalloidin images as a metric for changes in cell morphology due to BAF treatment, and find that treatment reduces cell size by 12% in MCF7 and 23% in MB231 cells in comparison with controls (P< 0.05).
The effect of proton pump inhibition on lamin A/C expression in breast cancer cells
Due to the importance of lamin A/C in controlling nuclear stiffness [70, 71], and its possible downregulation by the AKT/mTOR signaling pathway [55] which we hypothesize is regulated by V-ATPase, we examine the effect of BAF treatment on lamin A/C expression. Western blots (Fig. 8A) show that lamin A/C significantly (P< 0.05) decreases by 50% in MCF7 cells. The ~25% increase in MB231 cells is not statistically significant (P≥0.05) (Fig. 8B). On the other hand, ICC shows that lamin A/C significantly (P< 0.05) increases in BAF treated lowly metastatic MCF7 cells by 158%, whereas it significantly (P< 0.05) decreases in BAF treated highly metastatic MB231 cells by 16% in comparison with controls –see Figures 2A, B in Appendix 1. While quantitative use of ICC staining and analysis is not as efficient as western blotting [72], differences in antibody binding efficiency due to a denatured (western blotting) versus a native state (ICC) may be responsible for this observed discrepancy [73]. Lamin A/C epitope accessibility and binding efficiency in ICC may additionally depend on additional nucleoskeletal complexes, binding partners, and cytoskeletal forces [72].
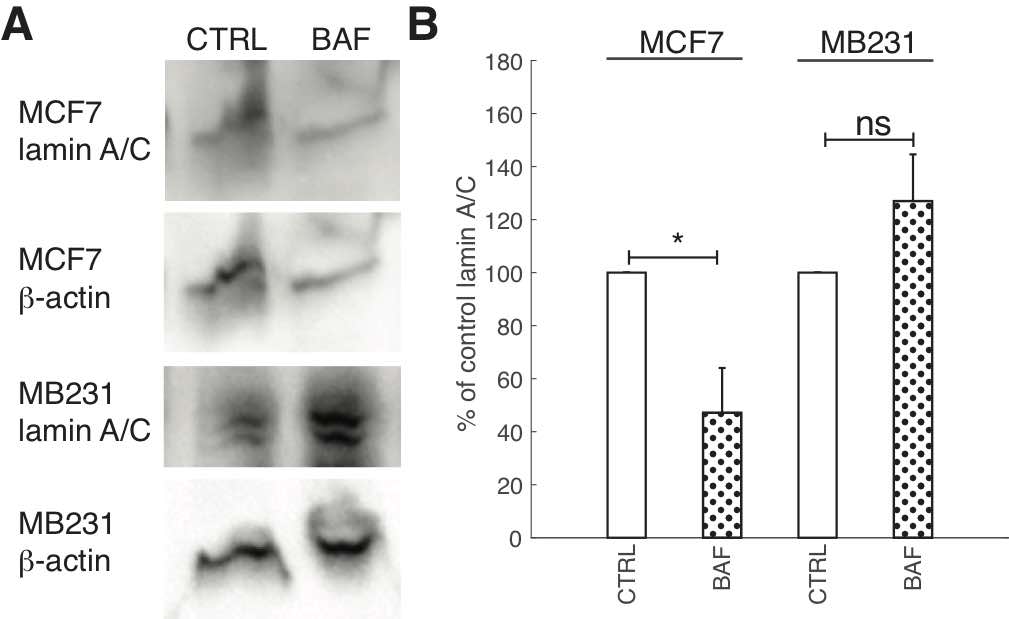
Fig. 8: Proton pump inhibition reduces lamin A/C expression in lowly metastatic breast cancer cells. (A) Representative western blots for lamin A/C in MCF7 and MB231 CTRL and BAF treated cells. β-actin was used as a loading control. (B) Average lamin A/C band densities normalized by β-actin and expressed as % of CTRL SEM. For MCF7 and MB231 N = 4. * P<0.05. Statistical comparisons used the two-sample Kolmogorov-Smirnov test.
Proton pump inhibition increases heterochromatin
Chromatin condensation, in addition to lamin A/C, regulates nuclear stiffness and deformability, where open decondensed euchromatin leads to a softer nucleus, and closed condensed heterochromatin leads to a stiffer nucleus [47, 74]. Since the discovery of proton pumps nuclear membranes’ localization [53], the role of proton pump inhibition on heterochromatin expression or conformation due to pH changes, where chromatin aggregates and condenses at low pH [54], has not yet been explored. Therefore, we measured heterochromatin in BAF treated and control highly and lowly metastatic breast cancer cells – see Fig. 9. ICC reveals that BAF treatment significantly (P< 0.05) increases heterochromatin in both MCF7 and MB231 cells – by 40% in MCF7 and by 22% in MB231 cells in comparison with controls (Fig. 9A, B). Western blot analysis (Fig. 9C) reveals that heterochromatin levels are 190% higher in BAF treated MCF7 and 236% higher in BAF treated MB231 cells in comparison with controls (P< 0.05).
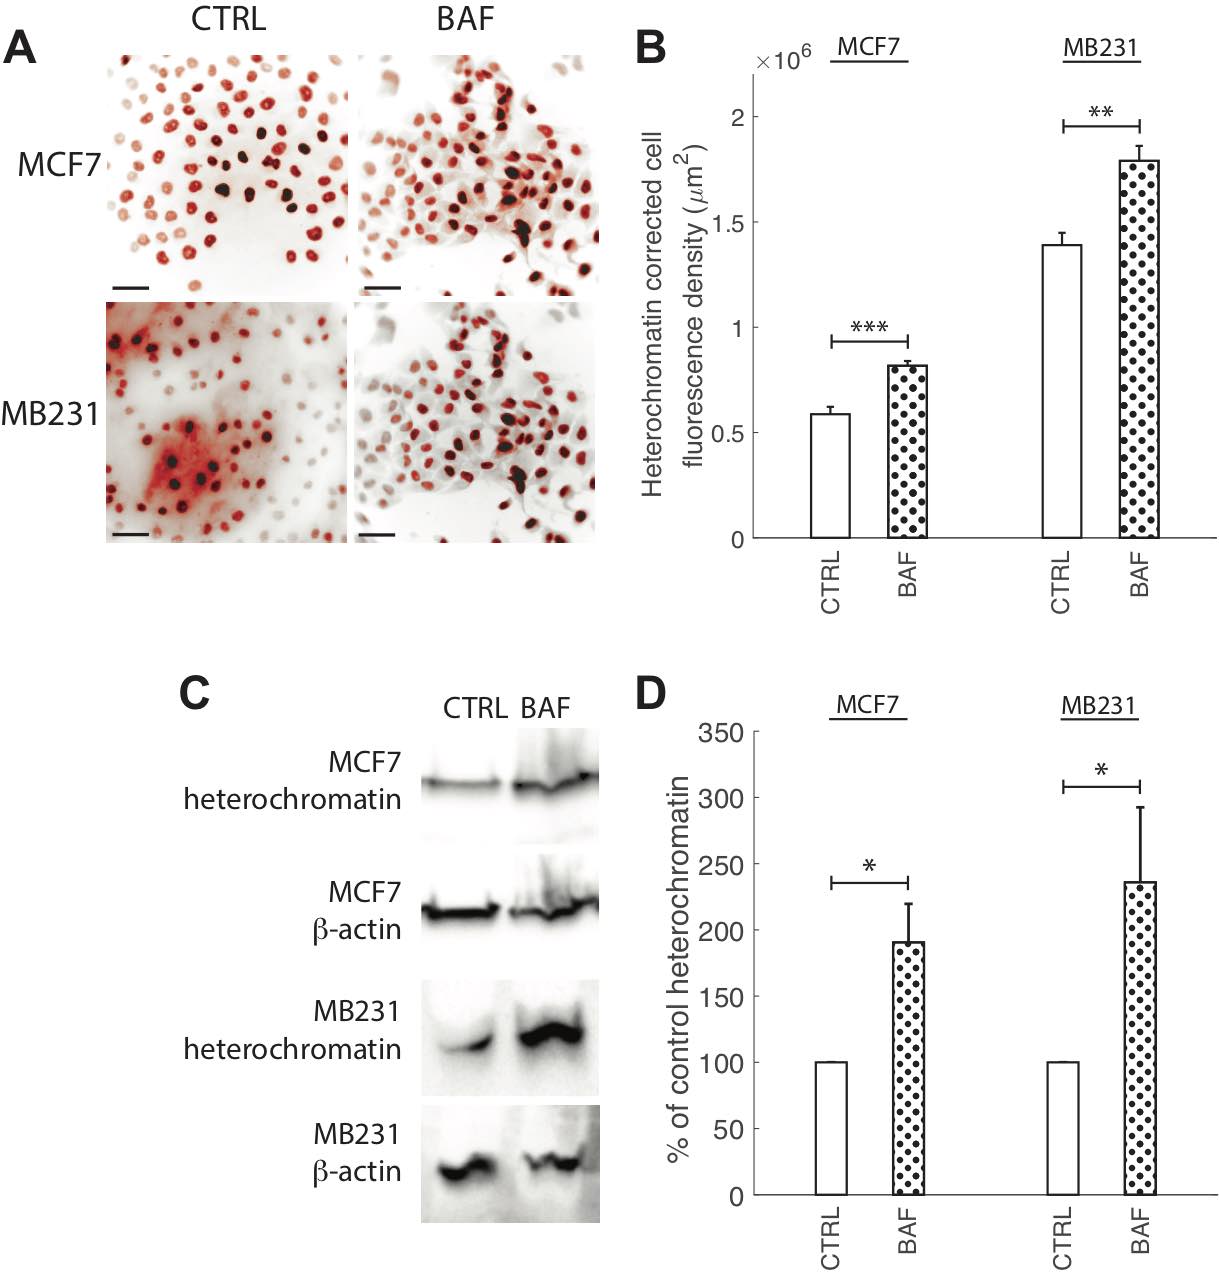
Fig. 9: Proton pump inhibition increases heterochromatin. (A) Representative ICC images of heterochromatin in CTRL and BAF treated MCF7 and MB231 cells shown as inverted contrast enhanced fluorescence images with red pseudocolor; greyscale values in the range of [0, 108] MCF7, [0, 129] MB231 were linearly rescaled to [0, 255]. Different grayscale ranges were chosen for rescaling the two different cell lines because different cameras were used. Scale bars are 20 μm. (B) Average corrected cell fluorescence density of heterochromatin SEM of CTRL and BAF treated MCF7 and MB231 cells. MCF7 CTRL N = 403, MCF7 BAF N = 364, MB231 CTRL N = 316, MB231 BAF N = 308. (C) Representative western blots for heterochromatin in MCF7 and MB231 CTRL and BAF treated cells. β-actin was used as a loading control. (D) Average heterochromatin band densities normalized by β-actin and expressed as % of CTRL SEM. For MCF7 and MB231 N = 4. *** P < 1 x 10⁻⁵, ** P<0.01, * P<0.05. Statistical comparisons used the two-sample Kolmogorov-Smirnov test.
The role of proton pump inhibition on ETV7 expression
Prompted by ETV7’s role as a binding partner for mTOR in the newly found mTORC3 [14], V-ATPase’s known interaction with mTOR in the activation of mTORC1 [15, 16], and our hypothesized role of V-ATPase’s activation of mTORC2 (see below), the effect of BAF on ETV7 expression was explored; see Fig. 10. We find that BAF has different effects on lowly and highly metastatic cells: ICC shows that BAF significantly (P< 0.05) increases ETV7 in MCF7 cells by 164% in comparison with control, whereas BAF significantly (p< 0.05) decreases ETV7 in MB231 cells by 34% (Figures 10A, B). These trends are confirmed by western blots (Fig. 10C), revealing that proton pump inhibition increases (P< 0.05) ETV7 expression in MCF7 cells by 30% and decreases (P< 0.05) ETV7 in MB231 cells by 27% (Fig. 10D). We additionally studied ETV7 nuclear fluorescence, as it cannot bind with mTOR when inside the nucleus [14]. This was done by using DAPI nuclear images as a mask for ETV7 ICC images; see Materials and Methods and Fig. 10D for representative overlay images. The effect of proton pump inhibition on ETV7 nuclear fluorescence follows a similar trend as whole-cell fluorescence; it is significantly (P< 0.05) increased by 85% in MCF7 and decreased (P< 0.05) by 17% in MB231 cells (Fig. 10E).
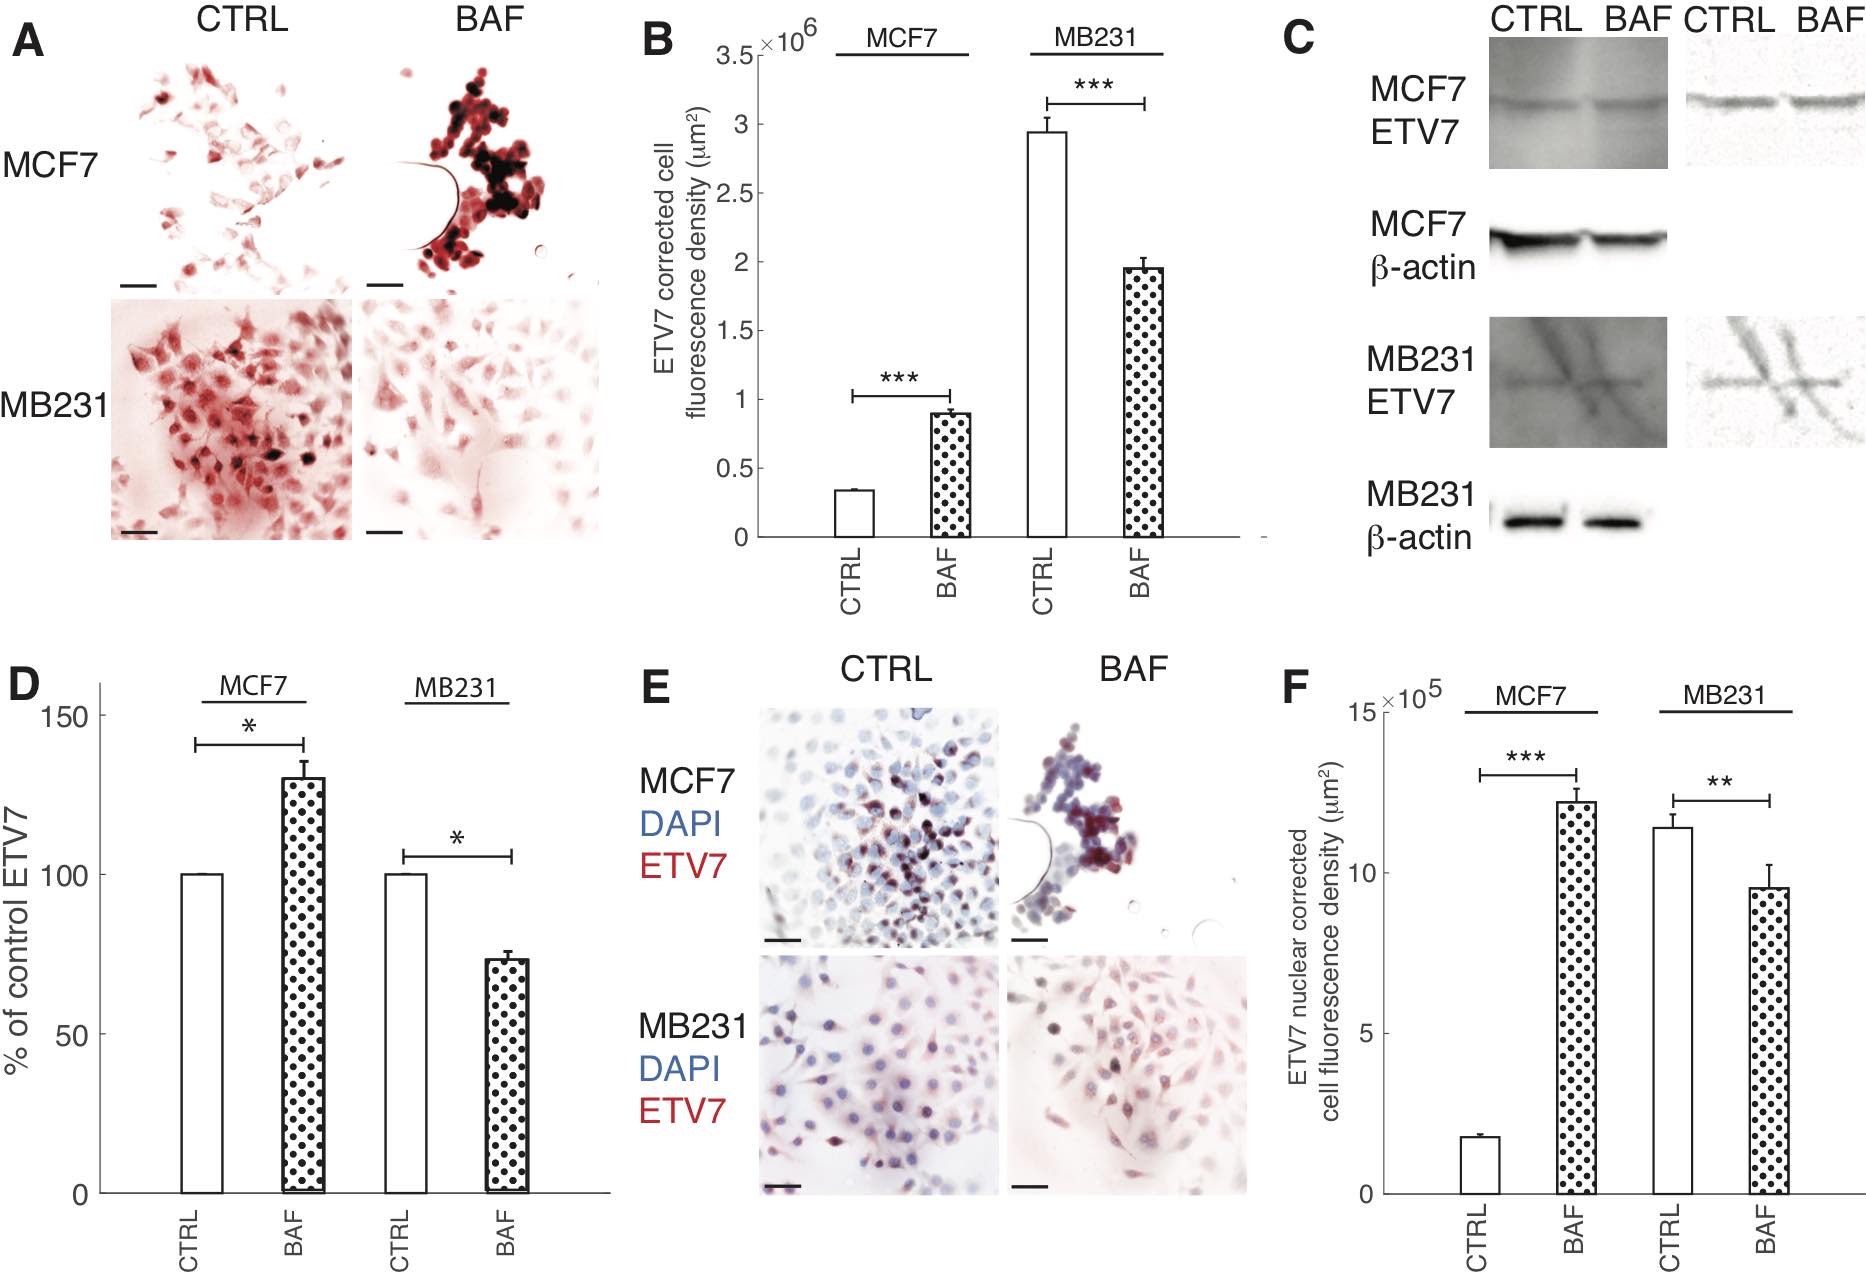
Fig. 10: Proton pump inhibition decreases ETV7 expression in highly metastatic breast cancer cells. (A) Representative ICC images of ETV7 in CTRL and BAF treated MCF7 and MB231 cells shown as inverted contrast enhanced fluorescence images with red pseudocolor; greyscale values in the range of [5, 150] were linearly rescaled to [0, 255]. Scale bars are 20 μm. (B) Average corrected cell fluorescence density of ETV7 SEM of CTRL and BAF treated MCF7 and MB231 cells. MCF7 CTRL N = 306, MCF7 BAF N = 298, MB231 CTRL N = 360, MB231 BAF N = 338. (C) Left column: Representative western blots for ETV7 in MCF7 and MB231 CTRL and BAF treated cells. β-actin was used as a loading control. Right column: background subtracted (10 point rolling ball with smoothing paraboloid) and contrast enhanced ([180-255] linearly rescaled to [0 255]) ETV7 blots. (D) Average ETV7 band densities normalized by β-actin and expressed as % of CTRL SEM. For MCF7 and MB231 N = 4. (E) Merged inverted fluorescence images of ETV7 (red) and nuclei (DAPI, blue) for CTRL and BAF treated MCF7 and MB231 cells. Scale bars are 20 μm. (F) Average nuclear ETV7 corrected fluorescence density SEM. *** P < 1 x 10⁻⁵, ** P<0.01, * P<0.05. Statistical comparisons used the two-sample Kolmogorov-Smirnov test.
The role of proton pump inhibition on breast cancer cell nuclei
Having shown that proton pump inhibition alters lamin A/C and heterochromatin expressions, as well as transcription factor ETV7 expression, we also investigated the effect of BAF on nuclear size (area, perimeter) and shape (circularity) because lamin A/C and heterochromatin can alter nuclear size and shape [75, 76] (Fig. 11). Nuclear size and shape are also frequently used clinically as markers of cancer aggressiveness [77]. We find that BAF has different effects on these metrics in lowly and highly metastatic breast cancer cells. BAF significantly (P< 0.05) increases nuclear size in MCF7 cells by 35%, whereas it has no significant effect (P≥0.05) on nuclear size in MB231 cells in comparison with controls (Fig. 11B). BAF significantly (P< 0.05) increases nuclear perimeter in MCF7 cells by 25% in comparison with control, likely associated with the increase in area, whereas it significantly (P< 0.05) decreases nuclear perimeter in MB231 cells by 20%, likely by smoothing the nuclear boundary (Fig. 11C). Proton pump inhibition also significantly (P< 0.05) decreases nuclear circularity in MCF7 cells by 14% and significantly (P< 0.05) increases nuclear circularity in MB231 cells by 13%.
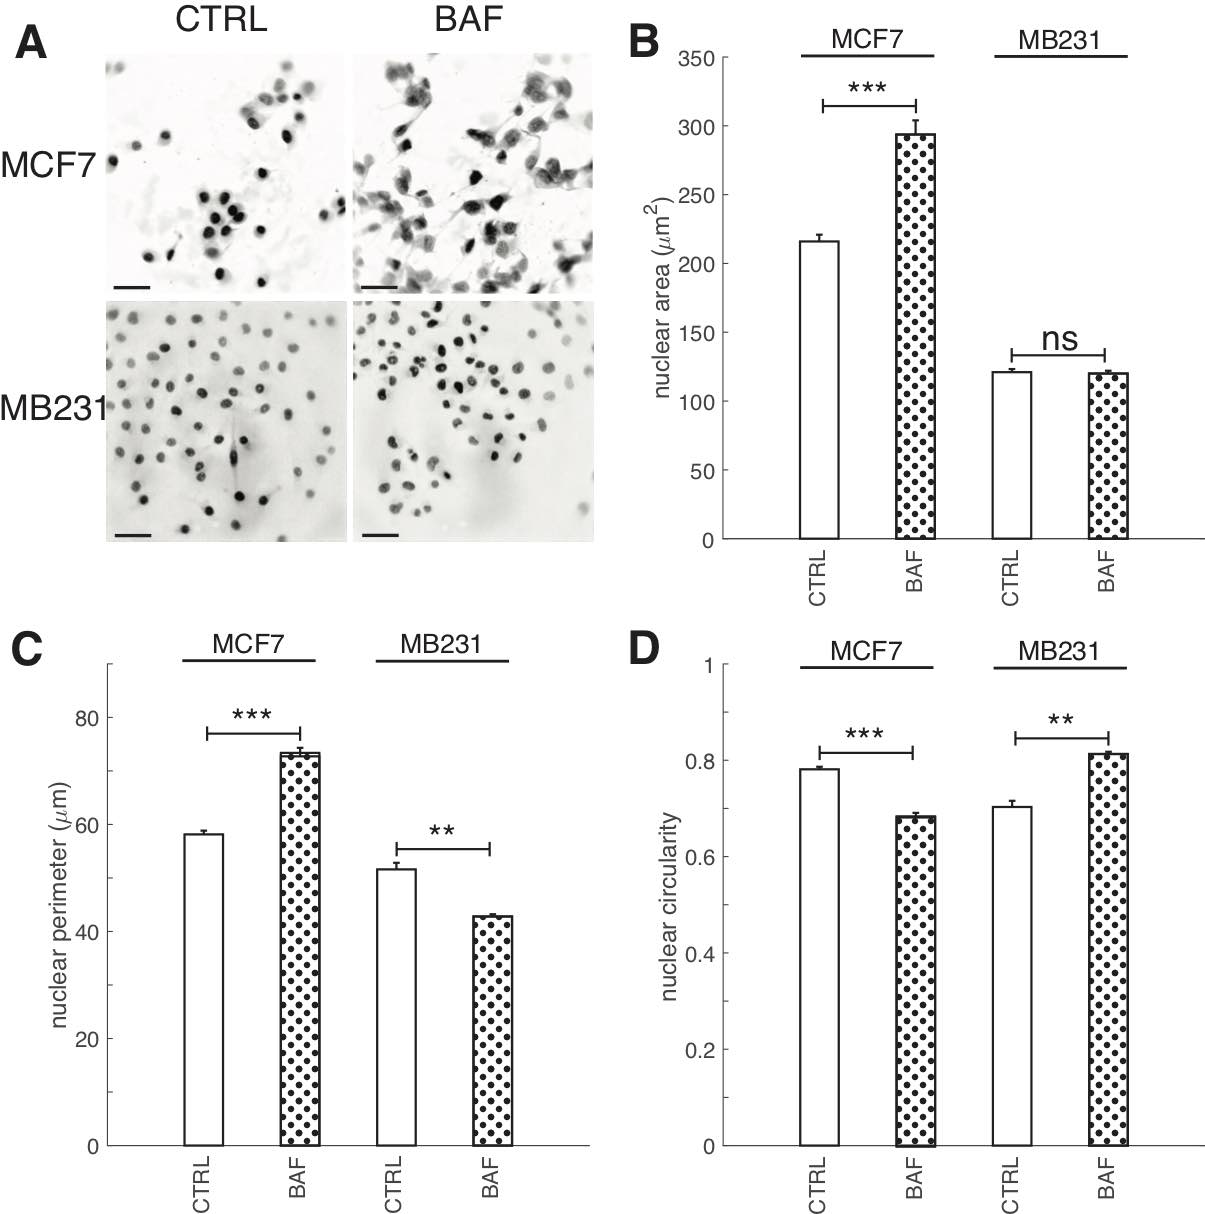
Fig. 11: Proton pump inhibition increases nuclear area and perimeter in lowly metastatic breast cancer cells. (A) Representative DAPI stained inverted nucleus images for CTRL and BAF treated MCF7 and MB231 cells, where greyscale values in the range of [0, 140] for MCF7 and [0, 135] for MB231 were linearly rescaled to [0, 255]. Scale bars are 20 μm. (B) Average nuclear area SEM, (C) average nuclear perimeter SEM, and average nuclear circularity SEM. For MCF7 CTRL N = 343, MCF7 BAF N = 382, MB231 CTRL N = 374, MB231 BAF N = 392. *** P < 1 x 10⁻⁵, ** P<0.01, ns P ≥ 0.05. Statistical comparisons used the two-sample Kolmogorov-Smirnov test.
Effects of proton pump inhibition on mTOR and AKT signaling
While V-ATPase’s role in mTORC1 activation is well established [78], its role in mTORC2 activation is unclear [27]. Additionally, studies of V-ATPase’s role in AKT signaling in cancer cells using inhibitors have had conflicting findings [45, 79, 80]. The antibody for phosphorylation of mTOR at Ser2448 was used as a specific marker of mTORC1 activation [81]. Similarly, the antibody of phosphorylation of mTOR at Ser2481 was used to monitor p-mTORC2 activation [82]. Western blots of BAF treated and control breast cancer cells reveal that p-mTORC1 is significantly (P< 0.05) reduced by BAF in lowly metastatic MCF7 (by 25%) and highly metastatic MB231 (by 51%) cells (Figures 12A,B). BAF also significantly (P< 0.05) reduces p-mTORC2 in both MCF7 (by 12%) and MB231 (by 48%) cells (Fig. 12A,B). We also find that BAF reduces total mTOR in both cell lines – by 22% in MCF7 (P< 0.05) and by 22% in MB231 cells (P≥ 0.05) (Figures 12A,B). Our findings for the effect of BAF on p-AKT expressions in lowly metastatic MCF7 and highly metastatic MB231 cells – unexpected due to the observed reductions in p-mTORC2 – BAF significantly (P< 0.05) decreased p-AKT in MCF7 cells (by 22%), and significantly increased p-AKT (by 154%) in MB231 cells (Figures 12C,D). BAF also significantly decreased total AKT levels in MCF7 cells (P<0.05, by 53%) while it non-significantly increased AKT in MB231 cells (P≥0.05, by 306%) (Figures 12C,D).
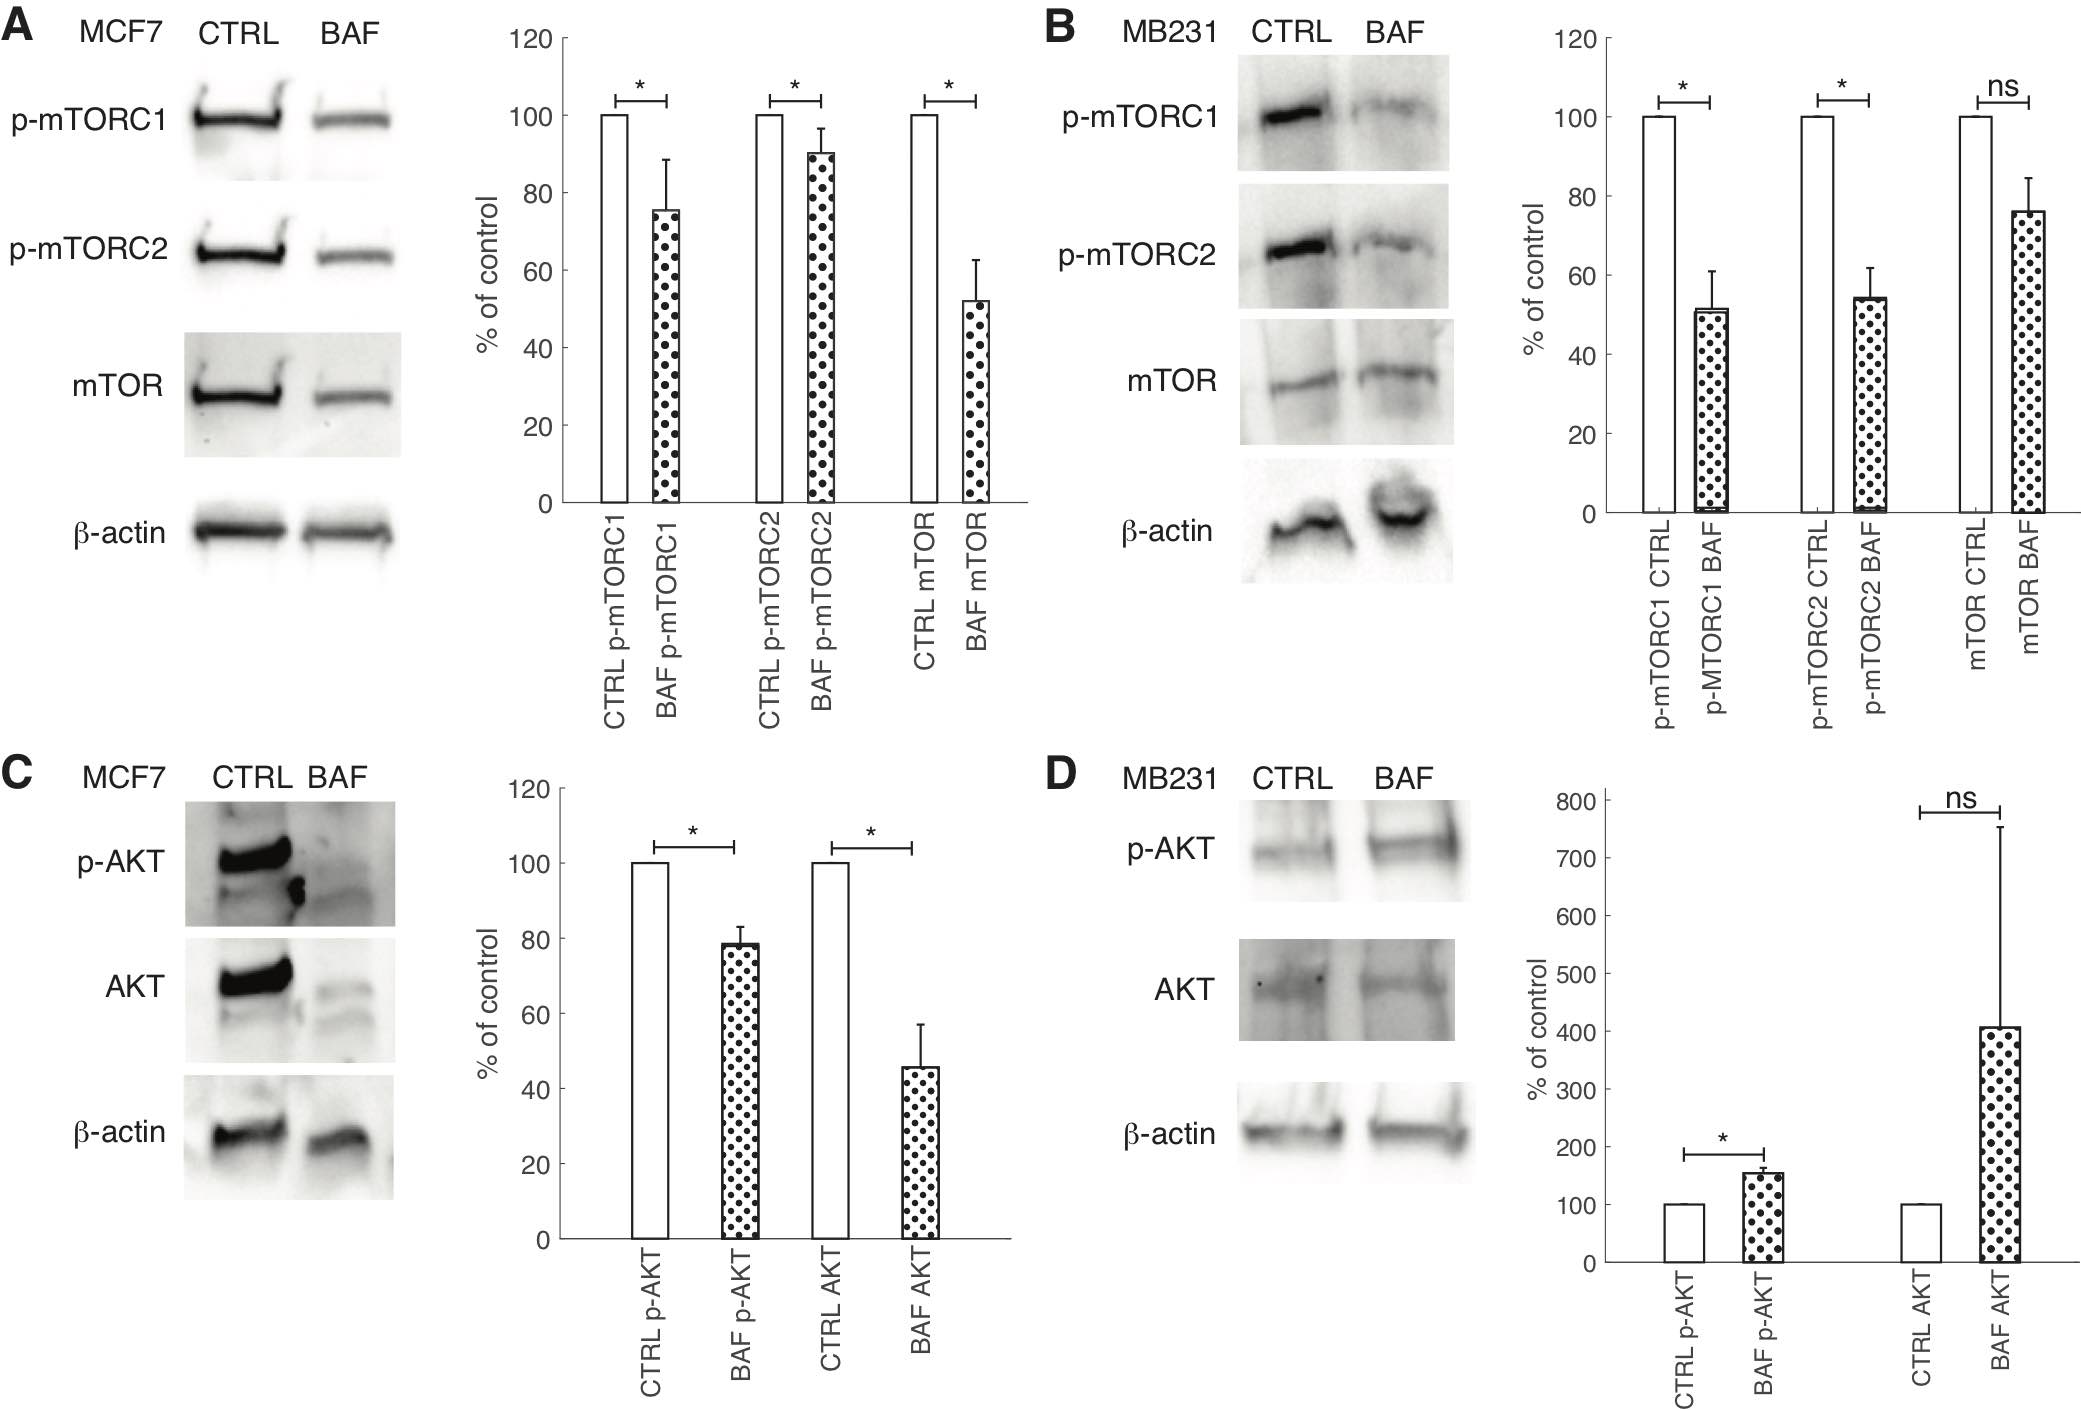
Fig. 12: Proton pump inhibition reduces mTOR signaling but has variable effects on AKT. (A, B) Left: Representative cropped western blots for p-mTORC1, p- mTORC2, mTOR and β-actin loading control in CTRL and BAF treated lowly metastatic MCF7 (A) and highly metastatic MB231 cells (B). Right: average band densities SEM of p- mTORC1, p-mTORC2, and mTOR proteins for CTRL and BAF treated MCF7 (A) and MB231 cells (B), expressed as percent of control. p-mTORC1 and p-mTORC2 were normalized by mTOR; mTOR was normalized by β-actin. (C, D) Left: Representative cropped western blots for p-AKT, AKT, and β-actin loading control in CTRL and BAF treated MCF7 (C) and MB231 cells (D). Right: average band densities of p-AKT and AKT SEM for CTRL and BAF treated MCF7 (C) and MB231 cells (D), expressed as percent of control. p-AKT was normalized by AKT; AKT was normalized by β-actin. * P<0.05, N = 4, statistical comparisons used the two-sample Kolmogorov-Smirnov test.
Discussion
The effects of proton pump inhibition on V-ATPase levels over time and cellular metabolism in breast cancer cells are understudied. We have shown that V-ATPase levels in both control and BAF treated breast cancer cells are unexpectedly not constant over time in both MCF7 and MB231 cells (see Fig. 3), with ICC fluorescence peaks occurring between 3 and 12 hours of observation. This may be due to changes in glucose metabolism over time where glucose is provided by the culture media [59]. Future experiments involving shaking the cultures (to prevent cells locally depleting the media of glucose), changing the media (to refresh the cells’ glucose supply), or adding glucose at different time points may clarify the mechanism for the increase and subsequent decrease in V-ATPase expression. Our investigation of the effects of proton pump inhibition on ATP production (Fig. 4) showed that ATP was reduced in highly metastatic MB231 cells. This result also suggests that the effects of V-ATPase on glycolysis and cellular energy production and metabolism should be further explored [59, 63].
Plasma membrane V-ATPase promotes metastasis and migration by: acidifying extracellular environments and activating proteases that degrade extracellular matrices [6, 83], and activating signaling pathways that promote migration (PI3K/AKT/mTOR, Rac1) [21, 84]. Proton pump inhibition has already been shown to inhibit cancer cell migration, including in breast cancer cells [56, 64–66]. Our proton pump inhibition protocol for lowly metastatic MCF7 and highly metastatic MB231 cells – 120 nM BAF, 24 hours – supports these findings as wound healing was significantly reduced (Fig. 5). V-ATPase promotes tumor growth and tumor cell proliferation through mTORC1 signaling [85], and proton pump inhibitors, including BAF, reduce tumor cell proliferation [10]. Our breast cancer treatments with BAF significantly reduce cell proliferation in both lowly and highly metastatic breast cancer cells (Fig. 6).
Although V-ATPase binds with and promotes F-actin polymerization [43, 44], prior studies revealed major contradictions. Hepatocellular carcinoma cells showed no effect on their actin cytoskeletons with V-ATPase inhibitor Archazolid (24 hours, up to 10 nM) [45]. Also, lowly and highly metastatic breast cancer cells treated with 50 nM and 100 µ M of BAF and concanamycin for 30 minutes had unaltered cytoskeletal actin filaments [5]. In comparison, a prostate cancer study showed that exposure to 5 nM of concanamycin or 50 µ M of chloroquine resulted in F-actin rearrangement from stress fibers into ring structures and reduced filopodial extensions [41]. Furthermore, we have shown that shear stressed moderately metastatic prostate cancer cells with 60 nM BAF for 24 hours reduces F-actin polymerization [9]. These contradictions prompted us to study the effect of BAF on F-actin (Fig. 7). We find that BAF significantly reduced F-actin polymerization in both lowly metastatic MCF7 and highly metastatic MB231 cells. This suggests that their reduced migration is attributable to this reduction, possibly in tandem with downregulation of a pro-migratory signaling pathway (such as mTOR).
Although proton pumps localize in the nuclear membrane of prostate cells (even cancer), thus independently regulating nuclear pH [53], the role of proton pump inhibition on nuclear proteins’ expressions (through various signaling pathways) or conformation (due to pH changes [54]) does not seem to have been explored. Proton pump inhibition with BAF significantly increases heterochromatin in the nucleus in both lowly metastatic MCF7 and highly metastatic MB231 cells, thus decreasing their invasiveness by decreasing transcription activity [86] and possibly increasing nuclear stiffness [9, 46]. BAF also affects nuclear structural protein lamin A/C expression in breast cancer cells, significantly decreasing its expression in the MCF7 cell line as evidenced by western blots. This may be caused by increased AKT signaling (which it was not here for MCF7, unexpectedly) [55], or if another alternative pathway affecting expression is activated such as that of caspase-6 [87]. During apoptosis, caspase-6 typically localizes in the nucleus and cleaves lamin proteins [88]. Ovarian cancer cells that highly expressed caspase-6 had no or low levels of lamin A/C, whereas inhibition of caspase-6 activity in an ovarian cancer cell line increased lamin A expression [87], suggesting that caspase-6 can regulate lamin A/C expression in cancer cells, in addition to AKT signaling. Interestingly, knockdown of a V-ATPase c-subunit in breast cancer cells significantly increases caspase-3 and -7 activities, but the effect on caspase-6 was not quantified [89]. However, as it is often activated by caspase-3 [88], caspase-6 activity may be upregulated due to V-ATPase knockdown or inhibition.
Increased nuclear size is used as a biomarker of many cancers. Some treatments that rectify nuclear size changes in cancer cells also reduce cell migration, possibly linking nuclear size alterations and metastatic potential [75]. Clinical studies have shown that nuclear size increases with breast cancer severity [90, 91]. We have shown, unexpectedly, that proton pump inhibition significantly increases both nuclear area and perimeter in lowly metastatic MCF7 cells, but had no significant effect on these metrics in highly metastatic MB231 cells. These increases may be due to increased heterochromatin as greater chromatin compaction can exert larger intranuclear forces on the nuclear envelope thereby promoting nuclear growth [75]. Nuclear size can also be altered by lamin, where low levels result in larger nuclei and higher levels yield smaller nuclei in Xenopus egg and embryo cells, lung fibroblasts, and HeLa cells [76]. Reduced lamin levels may contribute to the increased nuclear area and perimeter in BAF treated MCF7 cells. Why altered heterochromatin and lamin levels have no effect on highly metastatic MB231 nuclear size is unknown.
Further to nuclear size, its circularity has also been used as a breast cancer grading marker where normal and lowly metastatic cells have higher circularity than highly metastatic cells [92]. We have observed surprising different effects of proton pump inhibition in lowly and highly metastatic cells, where circularity is significantly decreased in MCF7 cells, but notably increased in MB231 cells. In Xenopus egg cells, F-actin was observed to exert forces on the nucleus giving it a lobed shape, whereas lamin A yields a round shape [93]. Decreasing heterochromatin (or increasing euchromatin) frequently leads to an irregular nuclear shape in human cancer cells [94]. According to these studies, the increased heterochromatin and decreased F-actin we have observed due to proton pump inhibition may have resulted in increased nuclear circularity in both cell lines, whereas the decreased lamin A/C we have observed may contribute to a decreased nuclear circularity. Considering that these lamin A/C, F-actin, and heterochromatin trends significantly affect both cell lines, the reason for different effects of BAF on nuclear circularity is also unknown. Surprisingly, a large number of genes (429 identified) can regulate nuclear shape in MCF10A breast epithelial cells, thus increasing the complexity of future nuclear shape studies [94].
V-ATPase plays a key role in mTORC1 signaling; it associates with nutrient sensing machinery on the surface of lysosomes and recruits and activates the metabolic regulator mTORC1 [95, 96]. mTORC1 can also be involved in a positive feedback loop, as mTORC1 activation increases V-ATPase expression in mouse embryonic fibroblast cells [97]. We confirm that proton pump inhibition with BAF significantly reduces p-mTORC1 expression in lowly metastatic MCF7 and highly metastatic MB231 cells (Figures 12A,B). mTORC2 signaling is less well understood than that of mTORC1 [96], although it controls cytoskeletal changes [13], migration, and metastasis [98]. Our study is the first to show that proton pump inhibition significantly reduces p-MTORC2 in lowly and highly metastatic breast cancer cells (Figures 12A,B). We have also demonstrated that proton pump inhibition plays a differential role on ETV7 expression in lowly metastatic MCF7 and highly metastatic MB231 cells; BAF significantly increases ETV7 in MCF7 and significantly decreases it in MB231 (Figures 12A,B). This is the first study of the role of proton pumps on mTOR’s new binding partner in mTORC3 in any system to our knowledge. Our result suggests that BAF may increase mTORC3 formation in MCF7 and decrease mTORC3 in MB231 – that may be verified directly when mTORC3 antibodies become commercially available. Our observed different expressions is unexplained; determining the underlying signaling pathway is of great interest. Our observed reductions in p-mTORC2 due to proton pump inhibition may affect AKT expression and function, as mTORC2 lies upstream of AKT in the PI3K/AKT/mTOR signaling pathway [28]. Prior studies using various inhibitors and cells have conflicting findings. Bartel et al. found that Archazolid did not affect expressions of p-AKT and AKT in hepatocellular carcinoma cells [45], whereas Kobia et al. observed that BAF reduced p-AKT expression in DND-41 leukemia cells and HCC1599 and HCC2218 breast cancer cells, but not in CCRF-CEM leukemia cells and MCF10A mammary epithelial cells [79]. On the other hand, He et al. showed that a combination treatment of paclitaxel and proton pump inhibitor esomeprazole reduced p-AKT levels in ovarian cancer cells, but each treatment alone had no effect [80]. We also find quite similar inconsistencies; proton pump inhibition by BAF significantly decreases p-AKT in MCF7 cells, but notably increases p-AKT in MB231 cells (Figures 12C,D). Total AKT significantly decreased in MCF7, whereas it non-significantly increased in MB231cells. The increase in p-AKT in highly metastatic MB231 cells may be caused by activation of an alternative signaling pathway. For example, 10 nM BAF overnight treatment increases MYC in mouse intestinal stem cells [99], and MYC suppresses PTEN mRNA levels in a zebrafish leukemia model, suggesting that MYC activates the AKT pathway [100]. This may be an alternative route of AKT activation in BAF treated MB231 cells.
Conclusion
In conclusion, we find that proton pump inhibition by Bafilomycin A1 reduces cell migration and proliferation, lamin A/C expression, F-actin polymerization, increases heterochromatin, and suppresses p-mTORC1, p- mTORC2, and total mTOR expressions in in lowly and highly metastatic breast cancer cells, thereby reducing breast cancer aggressiveness. Surprisingly, Bafilomycin A1 treatment decreases lamin A/C expression in both lowly and highly metastatic cells, whereas it has different effects on ETV7 and p-AKT expressions in lowly and highly metastatic cells, as well as nuclear area, perimeter, and circularity. All these warrant further investigations. Having better understanding of the vacuolar proton pump’s effects on cellular and nuclear structural proteins, as well as signaling pathways, will facilitate better breast cancer treatment.
Appendix
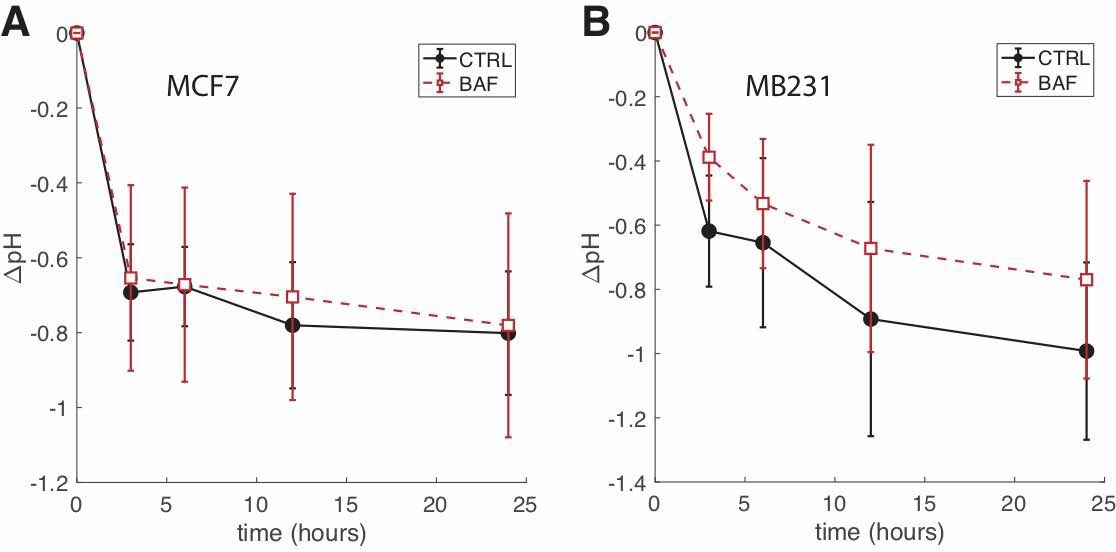
Fig. A1: BAF treated cells have higher extracellular pH than CTRL over the course of 24 hours. (A) Average ∆pH (the difference in pH between t = 0 and the time point shown) of extracellular media at different time points for CTRL and BAF treated MCF7 cells SEM. N = 4. (B) ∆pH of extracellular media at different time points for CTRL and BAF treated MB231 cells SEM. N = 4. Statistical comparisons between CTRL and BAF at all time points for both cell lines were not statistically significant (P ≥ 0.05), where the statistical comparisons used the two-sample Kolmogorov-Smirnov test. Lines connecting the symbols are guides to the eye.
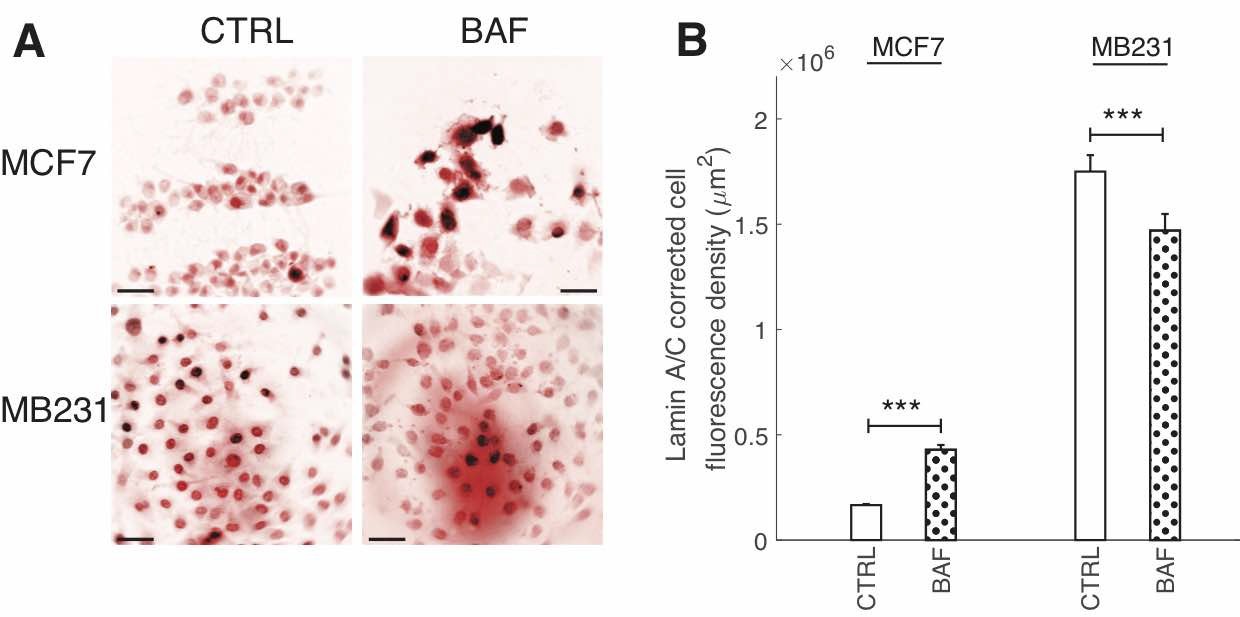
Fig. A2: BAF has differential effects on Lamin A/C fluorescence. (A) Representative ICC images of lamin A/C in CTRL and BAF treated MCF7 and MB231 cells displayed as inverted contrast enhanced fluorescence image with red pseudocolor, where greyscale values in the range of [1, 138] were linearly rescaled to [0, 255]. Scale bars are 20 m. (B) Average corrected cell fluorescence density of lamin A/C SEM of CTRL and BAF treated MCF7 and MB231 cells. MCF7 CTRL N = 305, MCF7 BAF N = 338, MB231 CTRL N = 332, MB231 BAF N = 345. *** P < 1 x 10⁻⁵. Statistical comparisons used the two-sample Kolmogorov-Smirnov test.
Acknowledgements
ZSK performed the experiments and analyzed the data. ZSK and FH devised the concept, designed and planned the experiments, interpreted the results and prepared the manuscript.
This study was funded by “President’s Distinguished Chair in Engineering, Science, & Medicine” funds, Texas Tech University. The funder had no role in the preparation of data or the manuscript.
The authors thank Dr. Moumita Roy for carefully reading the manuscript and providing feedback. The authors have no ethical conflicts to disclose.
Disclosure Statement
The authors declare that no conflicts of interest exist.
References
| 1 | Nelson N: A journey from mammals to yeast with vacuolar H+-ATPase (V-ATPase). J Bioenerg Biomembr 2003;35(4):281-289.
|
| 2 | Finbow ME, Harrison MA: The vacuolar H+-ATPase: a universal proton pump of eukaryotes. Biochem J 1997;324(3):697-712.
https://doi.org/10.1042/bj3240697 |
| 3 | Cotter K, Capecci J, Sennoune S, Huss M, Maier M, Martinez-Zaguilan R, et al.: Activity of plasma membrane V-ATPases is critical for the invasion of MDA-MB231 breast cancer cells. J Biol Chem 2015;290(6):3680-3692.
https://doi.org/10.1074/jbc.M114.611210 |
| 4 | Hinton A, Sennoune SR, Bond S, Fang M, Reuveni M, Sahagian GG, et al.: Function of a subunit isoforms of the V-ATPase in pH homeostasis and in vitro invasion of MDA-MB231 human breast cancer cells. J Biol Chem 2009;284(24):16400-16408.
https://doi.org/10.1074/jbc.M901201200 |
| 5 | Sennoune SR, Bakunts K, Mart'ınez GM, Chua-Tuan JL, Kebir Y, Attaya MN, et al.: Vacuolar H+-ATPase in human breast cancer cells with distinct metastatic potential: distribution and functional activity. Am J Physiol-Cell Physiology 2004;286(6):C1443-C1452.
https://doi.org/10.1152/ajpcell.00407.2003 |
| 6 | Cotter K, Stransky L, McGuire C, Forgac M: Recent insights into the structure, regulation, and function of the V-ATPases. Trends Biochem Sci2015;40:611-622.
https://doi.org/10.1016/j.tibs.2015.08.005 |
| 7 | Marshansky V, Futai M: The V-type H+-ATPase in vesicular trafficking: targeting, regulation and function. Curr Opin Cell Biol 2008;20:415-426.
https://doi.org/10.1016/j.ceb.2008.03.015 |
| 8 | Forgac M: Vacuolar ATPases: rotary proton pumps in physiology and pathophysiology. Nature Reviews Molecular Cell Biology 2007;8(11):917-929.
https://doi.org/10.1038/nrm2272 |
| 9 | Khan ZS, Hussain F: Shear Stress Increases V-H+-ATPase and Acidic Vesicle Number Density, and p-mTORC2 Activation in Prostate Cancer Cells. Cellular and Molecular Bioengineering 2020;13(6):591-604.
https://doi.org/10.1007/s12195-020-00632-1 |
| 10 | P'erez-Say'ans M, Somoza-Mart'ın JM, Barros-Angueira F, Rey JMG, Garc'ıa-Garc'ıa A: V-ATPase inhibitors and implication in cancer treatment. Cancer Treat Rev 2009;35:707-713.
https://doi.org/10.1016/j.ctrv.2009.08.003 |
| 11 | Wang R, Wang J, Hassan A, Lee CH, Xie XS, Li X: Molecular basis of V-ATPase inhibition by bafilomycin A1. Nature Communications 2021;12(1):1-8.
https://doi.org/10.1038/s41467-021-22111-5 |
| 12 | Azamjah N, Soltan-Zadeh Y, Zayeri F: Global trend of breast cancer mortality rate: a 25-year study. Asian Pacific journal of cancer prevention: APJCP 2019;20(7):2015.
https://doi.org/10.31557/APJCP.2019.20.7.2015 |
| 13 | Laplante M, Sabatini DM: mTOR signaling in growth control and disease. Cell 2012;149:274-293.
https://doi.org/10.1016/j.cell.2012.03.017 |
| 14 | Harwood FC, Geltink RIK, O'Hara BP, Cardone M, Janke L, Finkelstein D, et al.: ETV7 is an essential component of a rapamycin-insensitive mTOR complex in cancer. Science Advances 2018;4(9):eaar3938.
https://doi.org/10.1126/sciadv.aar3938 |
| 15 | Guertin DA, Sabatini DM: Defining the role of mTOR in cancer. Cancer Cell 2007;12:9-22.
https://doi.org/10.1016/j.ccr.2007.05.008 |
| 16 | Laplante M, Sabatini DM: mTOR signaling at a glance. J Cell Sci 2009;122:3589-3594.
https://doi.org/10.1242/jcs.051011 |
| 17 | Ayuk SM, Abrahamse H: mTOR signaling pathway in cancer targets photodynamic therapy in vitro. Cells 2019;8(5):431.
https://doi.org/10.3390/cells8050431 |
| 18 | Mellman I, Yarden Y: Endocytosis and cancer. Cold Spring Harbor Perspectives in Biology 2013;5:a016949.
https://doi.org/10.1101/cshperspect.a016949 |
| 19 | Fennelly C, Amaravadi RK: Lysosomal biology in cancer. Lysosomes: Methods and Protocols 2017;p. 293-308.
https://doi.org/10.1007/978-1-4939-6934-0_19 |
| 20 | Kim LC, Cook RS, Chen J: mTORC1 and mTORC2 in cancer and the tumor microenvironment. Oncogene 2017;36(16):2191-2201.
https://doi.org/10.1038/onc.2016.363 |
| 21 | Wiedmann RM, Von Schwarzenberg K, Palamidessi A, Schreiner L, Kubisch R, Liebl J, et al. The V-ATPase-inhibitor archazolid abrogates tumor metastasis via inhibition of endocytic activation of the Rho-GTPase Rac1. Cancer Res 2012;72(22):5976-5987.
https://doi.org/10.1158/0008-5472.CAN-12-1772 |
| 22 | Sun-Wada GH, Wada Y: Role of vacuolar-type proton ATPase in signal transduction. Biochimica et Biophysica Acta (BBA)-Bioenergetics 2015;1847(10):1166-1172.
https://doi.org/10.1016/j.bbabio.2015.06.010 |
| 23 | De P, Carlson JH, Jepperson T, Willis S, Leyland-Jones B, Dey N: RAC1 GTP-ase signals Wnt-beta-catenin pathway mediated integrin-directed metastasis-associated tumor cell phenotypes in triple negative breast cancers. Oncotarget 2017;8(2):3072.
https://doi.org/10.18632/oncotarget.13618 |
| 24 | Esen E, Chen J, Karner CM, Okunade AL, Patterson BW, Long F: WNT-LRP5 signaling induces Warburg effect through mTORC2 activation during osteoblast differentiation. Cell Metabolism 2013;17:745-755.
https://doi.org/10.1016/j.cmet.2013.03.017 |
| 25 | Conciatori F, Ciuffreda L, Bazzichetto C, Falcone I, Pilotto S, Bria E, et al.: mTOR cross-talk in cancer and potential for combination therapy. Cancers 2018;10(1):23.
https://doi.org/10.3390/cancers10010023 |
| 26 | Tian T, Li X, Zhang J: mTOR signaling in cancer and mTOR inhibitors in solid tumor targeting therapy. International Journal of Molecular Sciences 2019;20(3):755.
https://doi.org/10.3390/ijms20030755 |
| 27 | Stransky L, Cotter K, Forgac M: The function of V-ATPases in cancer. Physiol Rev 2016;96(3):1071-1091.
https://doi.org/10.1152/physrev.00035.2015 |
| 28 | Yu L, Wei J, Liu P: Attacking the PI3K/Akt/mTOR signaling pathway for targeted therapeutic treatment in human cancer. In: Seminars in Cancer Biology. vol. 85. Elsevier; 2022. p. 69-94.
https://doi.org/10.1016/j.semcancer.2021.06.019 |
| 29 | Rasighaemi P, Ward AC. ETV6 and ETV7: Siblings in hematopoiesis and its disruption in disease. Crit Rev Oncol Hematol 2017;116:106-115.
https://doi.org/10.1016/j.critrevonc.2017.05.011 |
| 30 | Alessandrini F, Pezz'e L, Menendez D, Resnick MA, Ciribilli Y: ETV7- mediated DNAJC15 repression leads to doxorubicin resistance in breast cancer cells. Neoplasia 2018;20(8):857-870.
https://doi.org/10.1016/j.neo.2018.06.008 |
| 31 | Cooper J, Giancotti FG: Integrin signaling in cancer: mechanotransduction, stemness, epithelial plasticity, and therapeutic resistance. Cancer Cell 2019;35(3):347-367.
https://doi.org/10.1016/j.ccell.2019.01.007 |
| 32 | Selvaraj N, Kedage V, Hollenhorst PC: Comparison of MAPK specificity across the ETS transcription factor family identifies a high-affinity ERK interaction required for ERG function in prostate cells. Cell Communication and Signaling 2015;13(1):1-14.
https://doi.org/10.1186/s12964-015-0089-7 |
| 33 | Zhang W, Liu HT: MAPK signal pathways in the regulation of cell proliferation in mammalian cells. Cell Res 2002;12(1):9-18.
https://doi.org/10.1038/sj.cr.7290105 |
| 34 | Chen Q, Kinch MS, Lin TH, Burridge K, Juliano R: Integrin-mediated cell adhesion activates mitogen-activated protein kinases. J Biol Chem 1994;269(43):26602-26605.
https://doi.org/10.1016/S0021-9258(18)47058-5 |
| 35 | Skinner MA, Wildeman AG: β1 integrin binds the 16-kDa subunit of vacuolar H+-ATPase at a site important for human papillomavirus E5 and platelet-derived growth factor signaling. J Biol Chem 1999;274:23119-23127.
https://doi.org/10.1074/jbc.274.33.23119 |
| 36 | Schempp CM, von Schwarzenberg K, Schreiner L, Kubisch R, Mu¨ller R, Wagner E, et al.: V-ATPase inhibition regulates anoikis resistance and metastasis of cancer cells. Molecular Cancer Therapeutics 2014;13(4):926-937.
https://doi.org/10.1158/1535-7163.MCT-13-0484 |
| 37 | Guck J, Schinkinger S, Lincoln B, Wottawah F, Ebert S, Romeyke M, et al.: Optical deformability as an inherent cell marker for testing malignant transformation and metastatic competence. Biophys J 2005;88(5):3689-3698.
https://doi.org/10.1529/biophysj.104.045476 |
| 38 | Tsai MA, Waugh RE, Keng PC: Cell cycle-dependence of HL-60 cell deformability. Biophys J 1996;70(4):2023-2029.
https://doi.org/10.1016/S0006-3495(96)79768-0 |
| 39 | Feng S, Cai M, Liu P, Wei L, Wang J, Qi J, et al.: Atp6v1c1 may regulate filament actin arrangement in breast cancer cells. PLoS One 2014;9(1):e84833.
https://doi.org/10.1371/journal.pone.0084833 |
| 40 | Chen SH, Bubb MR, Yarmola EG, Zuo J, Jiang J, Lee BS, et al.: Vacuolar H+-ATPase binding to microfilaments: regulation in response to phosphatidylinositol 3-kinase activity and detailed characterization of the actin-binding site in subunit B. J Biol Chem 2004;279(9):7988-7998.
https://doi.org/10.1074/jbc.M305351200 |
| 41 | Licon-Munoz Y, Michel V, Fordyce CA, Parra KJ: F-actin reorganization by V-ATPase inhibition in prostate cancer. Biology Open 2017;6(11):1734-1744.
https://doi.org/10.1242/bio.028837 |
| 42 | Martin C, Pedersen SF, Schwab A, Stock C: Intracellular pH gradients in migrating cells. Am J Physiol-Cell Physiology 2011;300(3):C490-C495.
https://doi.org/10.1152/ajpcell.00280.2010 |
| 43 | Holliday LS, Lu M, Lee BS, Nelson RD, Solivan S, Zhang L, et al.: The amino-terminal domain of the B subunit of vacuolar H+-ATPase contains a filamentous actin binding site. J Biol Chem 2000;275(41):32331-32337.
https://doi.org/10.1074/jbc.M004795200 |
| 44 | Vitavska O, Merzendorfer H, Wieczorek H: The V-ATPase subunit C binds to polymeric F-actin as well as to monomeric G-actin and induces cross-linking of actin filaments. J Biol Chem 2005;280(2):1070-1076.
https://doi.org/10.1074/jbc.M406797200 |
| 45 | Bartel K, Winzi M, Ulrich M, Koeberle A, Menche D, Werz O, et al.: V-ATPase inhibition increases cancer cell stiffness and blocks membrane related Ras signaling-a new option for HCC therapy. Oncotarget 2017;8(6):9476.
https://doi.org/10.18632/oncotarget.14339 |
| 46 | Pajerowski JD, Dahl KN, Zhong FL, Sammak PJ, Discher DE. Physical plasticity of the nucleus in stem cell differentiation. Proc Natl Acad Sci U S A 2007;104(40):15619-15624.
https://doi.org/10.1073/pnas.0702576104 |
| 47 | Khan ZS, Santos JM, Hussain F: Aggressive prostate cancer cell nuclei have reduced stiffness. Biomicrofluidics 2018;12(1):014102.
https://doi.org/10.1063/1.5019728 |
| 48 | McGregor AL, Hsia CR, Lammerding J: Squish and squeeze-the nucleus as a physical barrier during migration in confined environments. Curr Opin Cell Biol 2016;40:32-40.
https://doi.org/10.1016/j.ceb.2016.01.011 |
| 49 | Lammerding J, Fong LG, Ji JY, Reue K, Stewart CL, Young SG, et al.: Lamins A and C but Not Lamin B1 Regulate Nuclear Mechanics. J Biol Chem 2006;281:25768-25780.
https://doi.org/10.1074/jbc.M513511200 |
| 50 | Swift J, Ivanovska IL, Buxboim A, Harada T, Dingal PDP, Pinter J, et al.: Nuclear lamin-A scales with tissue stiffness and enhances matrix-directed differentiation. Science 2013;341(6149).
https://doi.org/10.1126/science.1240104 |
| 51 | Davidson PM, Denais C, Bakshi MC, Lammerding J: Nuclear Deformability Constitutes a Rate-Limiting Step During Cell Migration in 3-D Environments. Cellular and Molecular Bioengineering 2014;7:293-306.
https://doi.org/10.1007/s12195-014-0342-y |
| 52 | Harada T, Swift J, Irianto J, Shin JW, Spinler KR, Athirasala A, et al.: Nuclear lamin stiffness is a barrier to 3D migration, but softness can limit survival. J Cell Biol 2014;204:669-682.
https://doi.org/10.1083/jcb.201308029 |
| 53 | Santos JM, Mart'ınez-Zaguil'an R, Facanha AR, Hussain F, Sennoune SR: Vacuolar H+-ATPase in the nuclear membranes regulates nucleo-cytosolic proton gradients. Am J Physiol-Cell Physiology 2016;311(4):C547-C558.
https://doi.org/10.1152/ajpcell.00019.2016 |
| 54 | Guo X, Cole RD: Chromatin aggregation changes substantially as pH varies within the physiological range. J Biol Chem 1989;264(20):11653-11657.
https://doi.org/10.1016/S0021-9258(18)80114-4 |
| 55 | Kong L, Sch¨afer G, Bu H, Zhang Y, Zhang Y, Klocker H: Lamin A/C protein is overexpressed in tissue-invading prostate cancer and promotes prostate cancer cell growth, migration and invasion through the PI3K/AKT/PTEN pathway. Carcinogenesis 2012;33(4):751-759.
https://doi.org/10.1093/carcin/bgs022 |
| 56 | Santos JM, Hussain F: VD3 mitigates breast cancer aggressiveness by targeting V-H+-ATPase. The Journal of Nutritional Biochemistry 2019;70:185-193.
https://doi.org/10.1016/j.jnutbio.2019.05.005 |
| 57 | Burgess A, Vigneron S, Brioudes E, Labb'e JC, Lorca T, Castro A: Loss of human Greatwall results in G2 arrest and multiple mitotic defects due to deregulation of the cyclin B-Cdc2/PP2A balance. Proc Natl Acad Sci U S A 2010;107(28):12564-12569.
https://doi.org/10.1073/pnas.0914191107 |
| 58 | Dechant R, Binda M, Lee SS, Pelet S, Winderickx J, Peter M: Cytosolic pH is a second messenger for glucose and regulates the PKA pathway through V-ATPase. The EMBO journal 2010;29(15):2515-2526.
https://doi.org/10.1038/emboj.2010.138 |
| 59 | Von Schwarzenberg K, Wiedmann RM, Oak P, Schulz S, Zischka H, Wanner G, et al.: Mode of cell death induction by pharmacological vacuolar H+-ATPase (V-ATPase) inhibition. J Biol Chem 2013;288(2):1385-1396.
https://doi.org/10.1074/jbc.M112.412007 |
| 60 | Zhdanov AV, Dmitriev RI, Papkovsky DB: Bafilomycin A1 activates HIF-dependent signalling in human colon cancer cells via mitochondrial uncoupling. Biosci Rep 2012;32(6):587-595.
https://doi.org/10.1042/BSR20120085 |
| 61 | Santos JM, Hussain F: Higher glucose enhances breast cancer cell aggressiveness. Nutr Cancer 2020;72(5):734-746.
https://doi.org/10.1080/01635581.2019.1654527 |
| 62 | Gupta C, Tikoo K: High glucose and insulin differentially modulates proliferation in MCF-7 and MDA-MB-231 cells. J Mol Endocrinol 2013;51(1):119-29.
https://doi.org/10.1530/JME-13-0062 |
| 63 | Hayek SR, Rane HS, Parra KJ: Reciprocal regulation of V-ATPase and glycolytic pathway elements in health and disease. Frontiers in Physiology 2019;10:127.
https://doi.org/10.3389/fphys.2019.00127 |
| 64 | Ihraiz WG, Ahram M, Bardaweel SK: Proton pump inhibitors enhance chemosensitivity, promote apoptosis, and suppress migration of breast cancer cells. Acta Pharmaceutica 2020;70(2):179-190.
https://doi.org/10.2478/acph-2020-0020 |
| 65 | Zhang B, Yang Y, Shi X, Liao W, Chen M, Cheng ASL, et al.: Proton pump inhibitor pantoprazole abrogates adriamycin-resistant gastric cancer cell invasiveness via suppression of Akt/GSK-β/β-catenin signaling and epithelial-mesenchymal transition. Cancer Lett 2015;356(2):704- 712.
https://doi.org/10.1016/j.canlet.2014.10.016 |
| 66 | Martins BX, Arruda RF, Costa GA, Jerdy H, de Souza SB, Santos JM, et al.: Myrtenal-induced V-ATPase inhibition-A toxicity mechanism behind tumor cell death and suppressed migration and invasion in melanoma. Biochimica et Biophysica Acta (BBA)-General Subjects 2019;1863(1):1-12.
https://doi.org/10.1016/j.bbagen.2018.09.006 |
| 67 | Hendrix A, Sormunen R, Westbroek W, Lambein K, Denys H, Sys G, et al.: Vacuolar H+ ATPase expression and activity is required for Rab27B-dependent invasive growth and metastasis of breast cancer. Int J Cancer 2013;133(4):843-854.
https://doi.org/10.1002/ijc.28079 |
| 68 | Zhang S, Schneider LS, Vick B, Grunert M, Jeremias I, Menche D, et al.: Anti-leukemic effects of the V-ATPase inhibitor Archazolid A. Oncotarget 2015;6(41):43508.
https://doi.org/10.18632/oncotarget.6180 |
| 69 | Lu X, Chen L, Chen Y, Shao Q, Qin W: Bafilomycin A1 inhibits the growth and metastatic potential of the BEL-7402 liver cancer and HO- 8910 ovarian cancer cell lines and induces alterations in their microRNA expression. Experimental and Therapeutic Medicine 2015;10(5):1829- 1834.
https://doi.org/10.3892/etm.2015.2758 |
| 70 | Chen L, Jiang F, Qiao Y, Li H, Wei Z, Huang T, et al.: Nucleoskeletal stiffness regulates stem cell migration and differentiation through lamin A/C. J Cell Physiol 2018;233(7):5112-5118.
https://doi.org/10.1002/jcp.26336 |
| 71 | Dahl KN, Kahn SM, Wilson KL, Discher DE: The nuclear envelope lamina network has elasticity and a compressibility limit suggestive of a molecular shock absorber. J Cell Sci 2004;117:4779-4786.
https://doi.org/10.1242/jcs.01357 |
| 72 | Purushothaman D, Bianchi LF, Penkov D, Poli A, Li Q, Vermezovic J, et al.: The transcription factor PREP1 (PKNOX1) regulates nuclear stiff- ness, the expression of LINC complex proteins and mechanotransduction. Communications Biology 2022;5(1):1-14.
https://doi.org/10.1038/s42003-022-03406-9 |
| 73 | Ihalainen TO, Aires L, Herzog FA, Schwartlander R, Moeller J, Vogel V: Differential basal-to-apical accessibility of lamin A/C epitopes in the nuclear lamina regulated by changes in cytoskeletal tension. Nature Materials 2015;14(12):1252-1261.
https://doi.org/10.1038/nmat4389 |
| 74 | Chalut KJ, H¨opfler M, Lautenschl¨ager F, Boyde L, Chan CJ, Ekpenyong A, et al.: Chromatin Decondensation and Nuclear Softening Accompany Nanog Downregulation in Embryonic Stem Cells. Biophys J. 2012;103:2060-2070.
https://doi.org/10.1016/j.bpj.2012.10.015 |
| 75 | Cantwell H, Dey G: Nuclear size and shape control. In: Seminars in Cell & Developmental Biology. vol. 130. Elsevier; 2022. p. 90-97.
https://doi.org/10.1016/j.semcdb.2021.10.013 |
| 76 | Jevti'c P, Edens LJ, Li X, Nguyen T, Chen P, Levy DL: Concentration- dependent effects of nuclear lamins on nuclear size in Xenopus and mammalian cells. J Biol Chem 2015;290(46):27557- 27571.
https://doi.org/10.1074/jbc.M115.673798 |
| 77 | Zink D, Fischer AH, Nickerson JA: Nuclear structure in cancer cells. Nat Rev Cancer 2004;4:677-687.
https://doi.org/10.1038/nrc1430 |
| 78 | Zoncu R, Bar-Peled L, Efeyan A, Wang S, Sancak Y, Sabatini DM: mTORC1 senses lysosomal amino acids through an inside- out mechanism that requires the vacuolar H+-ATPase. Science 2011;334(6056):678-683.
https://doi.org/10.1126/science.1207056 |
| 79 | Kobia F, Duchi S, Deflorian G, Vaccari T: Pharmacologic inhibition of vacuolar H+ ATPase reduces physiologic and oncogenic Notch signaling. Molecular Oncology 2014;8(2):207-220.
https://doi.org/10.1016/j.molonc.2013.11.002 |
| 80 | He J, Shi XY, Li Zm, Pan Xh, Li ZL, Chen Y, et al.: Proton pump inhibitors can reverse the YAP mediated paclitaxel resistance in epithelial ovarian cancer. BMC Molecular and Cell Biology 2019;20(1):1-14.
https://doi.org/10.1186/s12860-019-0227-y |
| 81 | Lian CY, Yang H, Zhai ZZ, Li ZF, Han DG, Wang L: mTORC1 activation contributes to autophagy inhibition via its recruitment to lysosomes and consequent lysosomal dysfunction in cadmium-exposed rat proximal tubular cells. J Inorg Biochem 2020;212:111231.
https://doi.org/10.1016/j.jinorgbio.2020.111231 |
| 82 | Chen S, Han Q, Wang X, Yang M, Zhang Z, Li P, et al.: IBP-mediated suppression of autophagy promotes growth and metastasis of breast cancer cells via activating mTORC2/Akt/FOXO3a signaling pathway. Cell Death & Disease 2013;4(10):e842-e842.
https://doi.org/10.1038/cddis.2013.380 |
| 83 | McGuire C, Stransky L, Cotter K, Forgac M: Regulation of V-ATPase activity. Frontiers in Bioscience-Landmark 2017;22(4):609-622.
https://doi.org/10.2741/4506 |
| 84 | Huang W, Ding X, Ye H, Wang J, Shao J, Huang T: Hypoxia enhances the migration and invasion of human glioblastoma U87 cells through PI3K/Akt/mTOR/HIF-1α pathway. Neuroreport 2018;29(18):1578- 1585.
https://doi.org/10.1097/WNR.0000000000001156 |
| 85 | McConnell M, Feng S, Chen W, Zhu G, Shen D, Ponnazhagan S, et al.: Osteoclast proton pump regulator Atp6v1c1 enhances breast cancer growth by activating the mTORC1 pathway and bone metastasis by increasing V-ATPase activity. Oncotarget 2017;8(29):47675.
https://doi.org/10.18632/oncotarget.17544 |
| 86 | Saksouk N, Simboeck E, D'ejardin J: Constitutive heterochromatin formation and transcription in mammals. Epigenetics & Chromatin 2015;8(1):1-17.
https://doi.org/10.1186/1756-8935-8-3 |
| 87 | Capo-Chichi CD, Cai KQ, Xu XX: Overexpression and cytoplasmic localization of caspase-6 is associated with lamin A degradation in set of ovarian cancers. Biomarker Research 2018;6(1):1-12.
https://doi.org/10.1186/s40364-018-0144-9 |
| 88 | Wang XJ, Cao Q, Zhang Y, Su XD: Activation and regulation of caspase- 6 and its role in neurodegenerative diseases. The Annual Review of Pharmacology and Toxicology 2015;55(1):553-572.
https://doi.org/10.1146/annurev-pharmtox-010814-124414 |
| 89 | You H, Jin J, Shu H, Yu B, De Milito A, Lozupone F, et al.: Small interfering RNA targeting the subunit ATP6L of proton pump V-ATPase overcomes chemoresistance of breast cancer cells. Cancer Lett 2009;280(1):110-119.
https://doi.org/10.1016/j.canlet.2009.02.023 |
| 90 | Tan PH, Goh BB, Chiang G, Bay BH. Correlation of nuclear morphometry with pathologic parameters in ductal carcinoma in situ of the breast. Modern Pathology. 2001;14(10):937-941.
https://doi.org/10.1038/modpathol.3880415 |
| 91 | Rajesh L, Dey P, Joshi K. Automated image morphometry of lobular breast carcinoma. Analytical and Quantitative Cytology and Histology. 2002;24(2):81-84.
|
| 92 | Chiotaki R, Polioudaki H, Theodoropoulos PA. Differential nuclear shape dynamics of invasive and non-invasive breast cancer cells are associated with actin cytoskeleton organization and stability. Biochemistry and Cell Biology. 2014;92(4):287-295.
https://doi.org/10.1139/bcb-2013-0120 |
| 93 | Mishra S, Levy DL. Nuclear F-actin and lamin a antagonistically modulate nuclear shape. J Cell Sci . 2022;.
https://doi.org/10.1242/jcs.259692 |
| 94 | Tamashunas AC, Tocco VJ, Matthews J, Zhang Q, Atanasova KR, Paschall L, et al. High-throughput gene screen reveals modulators of nuclear shape. Molecular Biology of the Cell. 2020;31(13):1392-1402.
https://doi.org/10.1091/mbc.E19-09-0520 |
| 95 | Collins MP, Forgac M. Regulation of V-ATPase assembly in nutrient sensing and function of V-ATPases in breast cancer metastasis. Frontiers in Physiology. 2018;9:902.
https://doi.org/10.3389/fphys.2018.00902 |
| 96 | Hare SH, Harvey AJ. mTOR function and therapeutic targeting in breast cancer. American Journal of Cancer Research. 2017;7(3):383.
|
| 97 | Pen˜a-Llopis S, Vega-Rubin-de Celis S, Schwartz JC, Wolff NC, Tran TAT, Zou L, et al. Regulation of TFEB and V-ATPases by mTORC1. The EMBO Journal. 2011;30(16):3242-3258.
https://doi.org/10.1038/emboj.2011.257 |
| 98 | Morrison Joly M, Williams MM, Hicks DJ, Jones B, Sanchez V, Young CD, et al. Two distinct mTORC2-dependent pathways converge on Rac1 to drive breast cancer metastasis. Breast Cancer Research. 2017;19(1):1- 15.
https://doi.org/10.1186/s13058-017-0868-8 |
| 99 | Dominguez-Brauer C, Hao Z, Elia AJ, Fortin JM, Nechanitzky R, Brauer PM, et al. Mule regulates the intestinal stem cell niche via the Wnt pathway and targets EphB3 for proteasomal and lysosomal degradation. Cell Stem Cell. 2016;19(2):205-216.
https://doi.org/10.1016/j.stem.2016.04.002 |
| 100 | Gutierrez A, Grebliunaite R, Feng H, Kozakewich E, Zhu S, Guo F, et al. Pten mediates Myc oncogene dependence in a conditional zebrafish model of T cell acute lymphoblastic leukemia. Journal of Experimental Medicine. 2011;208(8):1595-1603.
https://doi.org/10.1084/jem.20101691 |