High-Fat Diet Induces MASLD and Adipose Tissue Changes in Obesity-Resistant Rats
bPostgraduate Program in Physiological Science, Health Sciences Center, Department of Physiological Sciences, Federal University of Espírito Santo, Vitória, (Espírito Santo), Brazil,
cPhysical Education and Sports Center, Sports Department, Federal University of Espírito Santo, Vitória, (Espírito Santo), Brazil,
dHealth Sciences Center, Morphology Department, Federal University of Espírito Santo, Vitória, (Espírito Santo), Brazil,
eVeterinary Medicine, University of Vila Velha, Vila Velha, (Espírito Santo), Brazil,
fHealth Sciences Center, Department of Morphology, Federal University of Espírito Santo, Vitória, (Espírito Santo), Brazil
Keywords
Abstract
Background/Aims:
Obesity Resistance (OR) is characterized by limited weight gain and reduced fat accumulation despite an obesogenic diet. However, the metabolic risk, particularly regarding Metabolic Dysfunction-Associated Steatotic Liver Disease (MASLD), remains unclear. The current study aims to investigate the presence of MASLD, as well as metabolic parameters and morphological aspects of adipose tissues in obesity-resistant (OR) R rats fed a high-fat diet (HFD).Methods:
Male Wistar rats (n=71) were initially randomized into two groups: a) standard diet (SD, n=35) and b) high-fat diet (HFD, n=36). The protocol was performed for 14 weeks, including 4 weeks of induction and 10 weeks of exposure to obesity. Subsequently, after applying the tertile classification criterion, the animals were redistributed into three groups: a) control (C, n=12), fed a standard diet; b) obesity-prone (OP, n=12); and c) OR (n=12). Body weight evolution, adiposity, nutritional behavior, metabolic markers, and liver morphology were assessed, along with the staging of MASLD.Results:
OR rats exhibited lower body weight, total fat pads, and leptin compared to OP but higher values than C. MASLD was observed in 50% of OR animals, while 37.5% progressed to metabolic dysfunction-associated steatohepatitis (MASH). OP rats had a higher incidence of MASH (87.5%).Conclusion:
Chronic HFD exposure in OR rats lead to metabolic changes and MASLD development, including MASH, demonstrating that OR does not protect against HFD-induced hepatic alterations.Introduction
Obesity Resistance (OR) involves a complex interaction between metabolic and environmental factors [1] and constitutes a growing field of research with an etiology that is not yet fully understood. Levin & Sullivan [1] define OR as the ability to limit weight gain and fat accumulation, even under hypercaloric dietary conditions. Levin et al [2]. were pioneers in identifying distinct patterns of body weight gain in rats fed high-fat diets (HFD), suggesting the phenotypes Obesity-Prone (OP) and Obesity-Resistant (OR) to distinguish weight gain propensity, where OP rats are more susceptible to obesity and OR rats demonstrate resistance to weight gain and fat accumulation. This finding has been supported by subsequent studies [3-5].
Obesity, in turn, is widely recognized as a chronic disease characterized by excessive fat accumulation and strongly influenced by obesogenic environments, including hypercaloric diets and sedentary behaviors [6, 7]. However, while substantial evidence in the literature demonstrates that obesity develops from an imbalance between energy intake and expenditure, the underlying mechanisms associated with the detrimental effects of HFD appear to be more complex than the simple concept of energy imbalance [8]. From an epidemiological perspective, obesity substantially contributes to global mortality and is associated with several health complications, such as cardiovascular diseases, type 2 diabetes, certain types of cancer, and metabolic dysfunction-associated steatotic liver disease (MASLD) [9, 10]. Therefore, investigating metabolic processes in OR models exposed to HFD is essential to understand the risks of comorbidities associated with obesity, challenging the notion that OR provides protection against the metabolic impacts of these diets.
In this context, MASLD, formerly known as non-alcoholic fatty liver disease (NAFLD), emerges as a relevant condition due to its association with obesity [11]. Characterized by the excessive deposition of fat in the liver, known as hepatic steatosis, MASLD has become one of the most common causes of liver disease worldwide [12, 13]. MASLD encompasses a wide spectrum of histological abnormalities, ranging from isolated hepatic steatosis to metabolic dysfunction-associated steatohepatitis (MASH), a progressive form of the disease characterized by inflammatory changes, which can occur concurrently with fibrosis. Without treatment, MASH can progress to cirrhosis and hepatocellular carcinoma [14, 15].
Hepatic fat accumulation results from an imbalance between lipid influx and efflux, regulated by metabolic pathways, including those involved in the uptake of circulating lipids [16, 17]. It has been reported in the literature that most hepatic fat originates from lipolysis of adipocytes derived from adipose tissue (AT) because of energy imbalance. Thus, the development of chronic inflammation, insulin resistance, and the consequent increased release of free fatty acids (FFA) into circulation contributes to lipotoxicity in other tissues [18, 19]. Interestingly, research in humans and animal models indicates that some individuals develop MASLD independently of obesity or under conditions of modest adiposity increase [20-23]. These data reinforce the importance of studying this condition in OR models.
In the context of OR and chronic inflammation, experimental studies have detected the expression of pro-inflammatory cytokines, such as TNF-alpha, in AT from these models [4, 5]. Moreover, other researchers have observed the presence of hepatic steatosis in OR animals fed a high-fat diet [23-26], but there is a gap in the literature regarding the complete evaluation of MASLD in these models, considering all diagnostic criteria proposed for rodents. One study on OR found that the authors reported MASH [23]. Therefore, the risk of developing and the severity of MASLD in this model are not well understood.
Taken together, the data suggest that HFD causes metabolic damage to tissues, whether in the condition of OP or OR [3-5, 27]. However, although some studies have shown hepatic steatosis regardless of obesity or with modest increases in adiposity the severity of MASLD in experimental OR models, which is poorly investigated. Furthermore, few studies in OR animals without genotypic intervention have assessed metabolic alterations in hepatic tissue. In this context, it becomes essential to investigate whether OR is associated with chronic inflammation and insulin resistance, factors that contribute to lipotoxicity.
Therefore, studies aimed at understanding these factors in OR could elucidate the potential metabolic impairments resulting from HFD consumption, allowing the development of approaches for the prevention and treatment of liver disorders, as well as expanding knowledge about the mechanisms involved in the etiology of OR. Thus, this study aims to investigate MASLD, as well as metabolic parameters and morphological aspects of adipose tissues, in OR rats fed a HFD. The central hypothesis is that chronic consumption of a HFD induces metabolic alterations in adipose and hepatic tissues, leading to a progressive stage of MASLD, independent of obesity.
Materials and Methods
Animal care
Male Wistar rats (Rattus norvegicus, n=71), aged 30 days (≅ 150 g), obtained from the Central Animal
Facility of the Federal University of Espírito Santo (Vitoria, ES, Brazil), were individually housed
in cages with controlled environmental conditions, including a 12-hour light/dark cycle starting at 6:00
am, an ambient temperature of 24 ± 2°C, and relative humidity of 55 ± 5%. The experimental
procedures complied with the “Brazilian Guideline for the Care and Use of Animals in Teaching or
Scientific Research Activities” as outlined by the National Council for the Control of Animal
Experimentation (CONCEA – MCT, 2016). The study was approved by the Ethics Committee on the Use of
Animals at the Federal University of Espírito Santo (CEUA-UFES) under protocol number 53/2019.
Experimental Protocol
The animals were subjected to a 7-day acclimatization period before being randomly distributed into two
groups: a) SD: fed a standard diet (n=35) and; b) HFD: fed a high-fat diet (n=36). The SD provided 9.47%
of calories from fat, 75.81% from carbohydrates, and 14.73% from proteins, following the AIN-93M
guidelines (PragSoluções Biociências®, Jaú, São Paulo, Brazil). The HFD was
formulated with a significant proportion of lard, consisting of 45.46% of calories from fat, 40.41% from
carbohydrates, and 14.13% from protein (PragSoluções Biociências®, Jaú, São
Paulo, Brazil). Throughout the experiment, all animals had free access to water and received a daily food
allowance of 40 g. Although this amount exceeds the animals’ expected intake, it was offered to
simulate ad libitum conditions, ensuring unrestricted access to food while allowing precise calculation of
food consumption (FC) by weighing the leftovers. Body weight (BW) was monitored weekly. The initial moment
of obesity was determined as previous studies carried out by our laboratory [28, 29], being considered the
initial moment of obesity when there was a significant increase in BW of HFD rats in relation to SD rats.
Once obesity was confirmed (week 4), the animals were reorganized into three groups based on BW tertiles
was used to redistribute the SD and HFD groups in Control (C), Obesity-Resistant (OR) and Obesity-Prone
(OP). This criterion consisted of organizing the animals in each group in ascending order according to BW,
and the cutoff point was identified in the animals by tertiles: 1) lower BW; 2) intermediate BW; 3)
animals with greater BW. Thus, animals fed with SD and HFD, and which presented lower BW, were classified
as Control (C, n=12) and Obesity-Resistant (OR, n=12), respectively. Likewise, rats in the highest tercile
of the HFD group were assigned to the Obesity-Prone group (OP, n=12). As the study aimed to assess obesity
susceptibility and resistance, animals in the intermediate tertile and those in the highest tertile of the
SD group were excluded (SD, n=23; HFD, n=12) to ensure homogeneity across groups. These animals were used
in other studies from our laboratory.
The experimental protocol consisted of a total period of 14 weeks, divided into two stages, as shown in
Fig. 1: Obesity Induction (weeks 0 to 4), followed by a period focused on the Characterization of Obesity
Resistance (weeks 5 to 14).
Due to the loss of four animals from the control group (C) for undetermined reasons, the final group sizes
at the end of the 14-week experiment were: Obesity-Prone (OP, n=12), Obesity-Resistant (OR, n=12), and
Control (C, n=8).
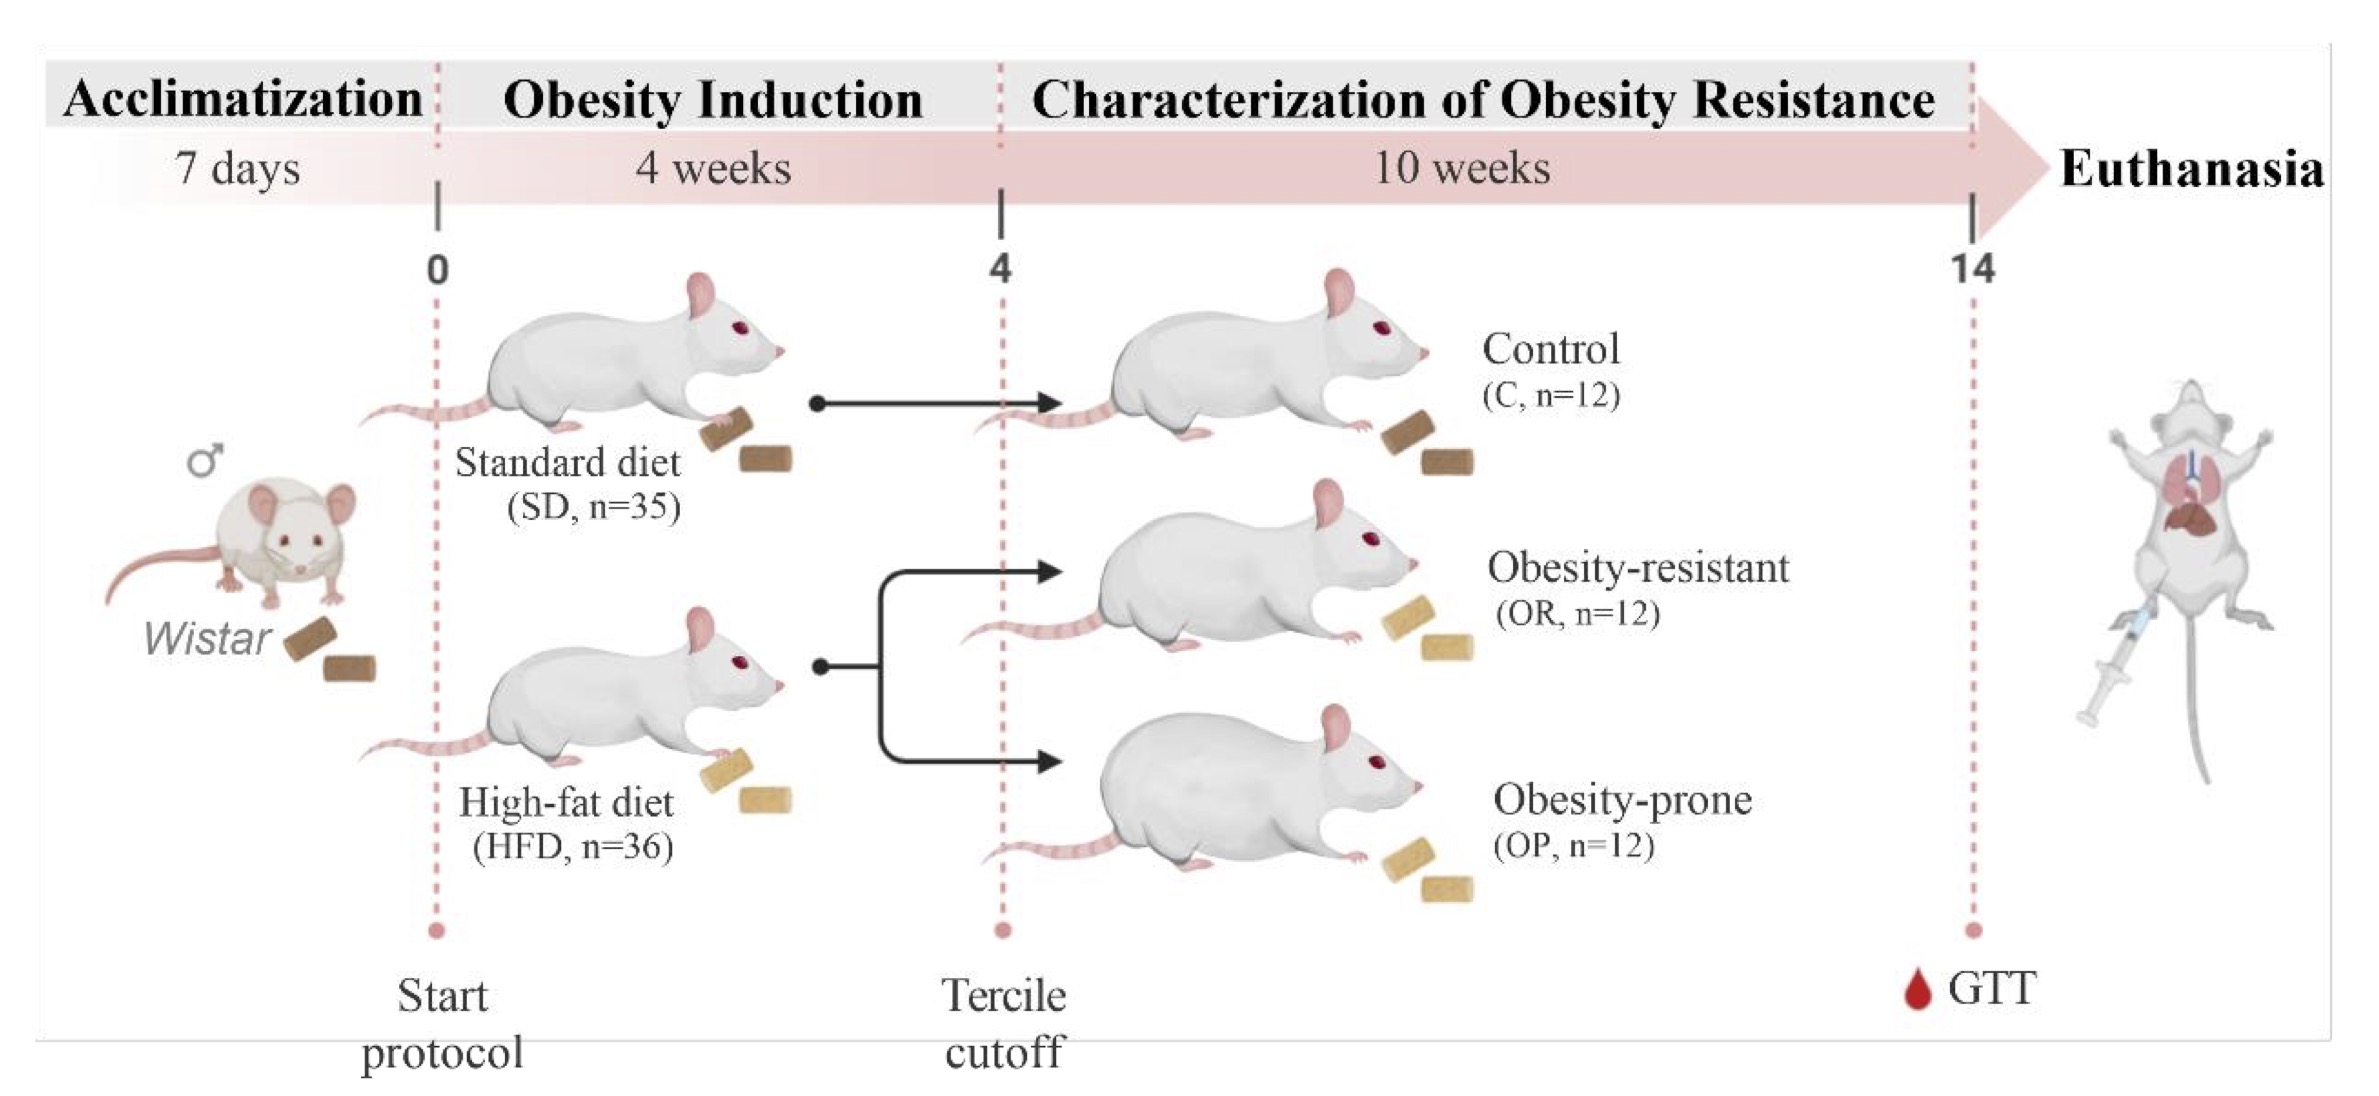
Fig. 1: Schematic representation of experimental protocol (14 weeks). GTT: glucose tolerance test.
Glucose Tolerance and Insulin Tolerance Tests
In the 14th week, blood samples were collected from the caudal artery after a 6-hour fast and subsequent
intraperitoneal administration of 25% glucose (Sigma-Aldrich,®St Louis, MO, USA), equivalent to
2g/kg. For the Glucose Tolerance Test (GTT), blood samples were collected at time 0, considered baseline
condition, and after 30, 60, 90 and 120 minutes of glucose infusion. Glucose levels were measured using a
portable glucometer, Accu-Chek Go Kit (Roche Diagnostics Brazil Ltda, São Paulo, Brazil). Glucose
intolerance in these animals was assessed by the profile of the curve and glycemic area (AUC) [30].
Systemic insulin resistance
The assessment of insulin resistance was analyzed using the Homeostatic Model Assessment of Insulin
Resistance (HOMA-IR) index, based on fasting serum glucose and insulin concentrations. HOMA-IR was
determined by the following formula: insulin concentration (μU/mL) multiplied by glycemic levels
(mg/dL) divided by 405 [31].
Euthanasia
At the conclusion of the experimental protocol (14 weeks) , following a 12 to 15-hour fasting period, the
animals were anesthetized with a solution of ketamine hydrochloride (50 mg/kg/i.p.; DOPALEN®, Sespo
Indústria e Comércio Ltda., Vetbrands Division, Jacareí, São Paulo, Brazil) and
xylazine hydrochloride (10 mg/kg/i.p.; ANASEDAN®, Sespo Indústria e Comércio Ltda.,
Vetbrands Division, Jacareí, São Paulo, Brazil) [32]. If nociceptive reflexes persisted after
anesthetic induction, a lethal overdose (20 to 30% of the initial dose of anesthetics) was administered
[32]. Euthanasia was performed by an overdose of anesthetics followed by decapitation. Blood samples,
liver and adipose (epididymal, retroperitoneal and visceral fat deposits) tissues were collected.
Nutritional Profile
The nutritional profile was determined by analyzing food consumption (FC), calorie intake (CI), feed
efficiency (FE), body weight (BW), body fat (BF) and adiposity index (AI) [33, 34]. FC was determined by
the difference between offered and consumed food, while CI was calculated by multiplying FC by the caloric
value of the diet. FE was obtained by the ratio of total BW gain to total energy intake. Regarding the
amount of body fat, it was determined through the sum of epididymal, retroperitoneal and visceral fat
pads. Finally, the AI was calculated by the formula: [AI = amount of body fat / final BW x 100] [30].
Lipid and Hormonal Profiles
For the assessment of lipid and hormonal profiles, blood samples were collected in Falcon tubes, then
centrifuged at 3000 rpm for 10 minutes using an Eppendorf® Centrifuge 5804-R (Hamburg, Germany). The
supernatant was stored at -80ºC in a freezer (Thermo Fisher Scientific LLC, Asheville, NC, USA).
Serum levels of total cholesterol (Bioclin, Belo Horizonte, MG, Brazil; Cat# K083-2), high-density
lipoprotein (HDL) (Bioclin, Belo Horizonte, MG, Brazil; Cat# K071-23), and triglycerides (Bioclin®,
Belo Horizonte, MG, Brazil; Cat# K117-1) were quantified using specific assay kits and measured with an
automated biochemical analyzer BS-200 (Mindray, Barueri, SP, Brazil).
The insulin (Millipore, Sigma Aldrich, St. Louis, MO, USA; Cat# EZRMI-13K), leptin (Millipore, Sigma
Aldrich, St. Louis, MO, USA; Cat# EZRL-83K) and TNF-alpha (R&D Systems, Minneapolis, MN, USA; Cat#
RTA00-1) concentrations were measured by enzyme-linked immunosorbent assay (ELISA) with specific kits,
following the manufacturer’s guidelines. The optical density of the samples was read using a
microplate reader (Spectra MAX 190, Molecular Devices, Sunnyvale, CA, USA).
Morphological Analyses of Adipose Tissues
Retroperitoneal and visceral white adipose tissues were analyzed for adipocyte morphometry using
Hematoxylin and Eosin (H&E) staining. For this purpose, the fragments of adipose tissue were fixed in
4% paraformaldehyde. The samples were dehydrated in alcohol, clarified in xylol and embedded in paraffin.
Histological sections 5 µm thick were made and projected at 40 times magnification with the aid of a
microscope (Leica Mikroshopie & System GmbH, Wetzlar, Germany), coupled with a video camera, which
sends digital images to a computer equipped with an image analysis program (Image Pro-plus, Media
Cybernetics, Silver Spring, Maryland, USA). Adipocyte areas (hypertrophy) and number (hyperplasia) were
quantified. The adipocyte area measurement was performed using ImageJ software (ImageJ, National
Institutes of Health, USA) and was calculated from the average value of the area in all fields measured,
for each group. The average adipocyte volume was calculated according to Gibert-Ramos et al [35].
Determination of Liver Water Content
Water content in tissues was determined gravimetrically by weighing fresh tissue and then drying it at a
temperature of 55 ± 5°C, for a period of 48 hours. The determination of water content was
expressed in relative values and calculated by the following formula: [(fresh weight (g) -
dry weight (g))/(fresh weight (g)) x 100] [36].
Analysis of Metabolic Dysfunction-Associated Steatotic Liver Disease (MASLD)
Liver sections were examined for steatosis using a semiquantitative approach with Oil Red-O staining.
Additionally, score analyzes were conducted for steatosis, inflammation, and fibrosis using H&E and
Sirius Red staining [37].
The semiquantitative evaluation of the percentage of steatosis followed the protocol outlined by
Lírio et al. [38]. Liver samples were cryosectioned at a thickness of 10 µm using a cryostat set
at -25 °C (Jung CM 1860; Leica, Germany) after embedding in Tissue Plus O.C.T. Compound (Fisher
HealthCare, Thermo Fisher Scientific, Waltham, Massachusetts, USA). Oil Red-O (Sigma Aldrich, USA) was
used for staining and images were captured with a video camera (AxioCam ERc5s, Carl Zeiss, Germany)
coupled to an optical microscope (AX70, Olympus Corporation, Japan) using a 40× magnification
objective lens, and quantitative analysis was performed using ImageJ software (National Institutes of
Health, Bethesda, USA). For analysis, ten different fields per animal were randomly selected to calculate
the average percentage of the stained area.
To assess liver disease severity, hepatic tissue samples previously fixed in 4% paraformaldehyde were
dehydrated in graded ethanol, cleared in xylene, and embedded in paraffin at 65 °C. After
embedding, tissue blocks were sectioned using a rotary microtome to obtain 5 µm-thick slices.
Sections were stained with H&E or Sirius Red. Images were evaluated under 10 or 40× magnification
using a video camera attached to a light microscope (Leica Mikroshopie & System GmbH, Wetzlar,
Germany).
The diagnosis and staging of Metabolic Dysfunction-Associated Steatotic Liver Disease (MASLD) were based
on the cumulative histological score, as proposed by Liang et al [37].. Histological evaluation was
independently performed by two experienced pathologists, both blinded to the experimental groups. Liver
histopathology was assessed based on the extent of macrovesicular and microvesicular steatosis, hepatocyte
hypertrophy, and inflammatory changes, as well as the presence and extent of fibrosis. Steatosis and
hypertrophy were individually scored from 0 to 3 according to the percentage of affected area (0: <5%;
1: 5–33%; 2: 34–66%; 3: >66%), with distinctions made by nuclear displacement
(macrovesicular) and cell size enlargement (>1.5× normal diameter), respectively. Inflammation was
graded by the average number of inflammatory foci per field (normal: <0.5; slight: 0.5–1.0;
moderate: 1.0–2.0; severe: >2.0). Fibrosis was classified semiquantitatively (absent, mild,
moderate, or massive) and quantified by image analysis of Sirius Red-stained area [37]. Although the
research utilized diagnostic protocols established before the adoption of the new nomenclature (MASLD,
before was NAFLD), the terminology has been updated to align with the latest MASLD guidelines.
Statistical Analysis
Data distribution was assessed using the Shapiro-Wilk test. Parametric data were expressed as mean ±
standard deviation and compared between two groups using the Student’s t-test for independent
samples. Comparisons among three groups were performed using one-way ANOVA, followed by Tukey’s
post-hoc test. Non-parametric data among three groups were analyzed using the Kruskal-Wallis test,
followed by Dunn’s test for multiple comparisons. Changes in BW evolution and glucose by tolerance
test (GTT) were analyzed using two-way ANOVA for repeated measures, complemented by Bonferroni’s
multiple comparisons test. The association between single linear variables was explored by Pearson’s
correlation coefficient. Analyses and graphs were performed using GraphPad Prism 8.0, with a significance
level set at 5% (p < 0.05).
Results
Obesity Induction and Characterization of Obesity Resistance
The initial moment of obesity was observed in the 4th week, characterized by the HFD group exhibiting a
significantly higher body weight compared to SD group (p < 0.05) (Fig. 2). After the determination of
obesity and application of the tertile separation criteria for characterization of Obesity-Resistance, the
HFD group was redistributed into Obesity-Prone (OP) and Obesity-Resistant (OR); the SD group was named as
Control (C) group. However, there was a loss of four rats in C without identified cause. Consequently, the
analyses proceeded with C (n=8), OP (n=12), and OR (n=12), respectively.
Fig. 2 illustrates the body weight evolution of the animals throughout the entire experimental protocol,
including the obesity induction period and the post-redistribution period, defined by characterization of
Obesity-Resistance. The results demonstrate that the body weight was statistically higher in OP group than
OR and C from the 5th to the 14th week, respectively. Additionally, the OR group did not show a difference
from the C group until the 6th week, but from the 7th week until the end of the experimental protocol
(14th week), the OR animals exhibited an intermediate body weight, characterized by a higher body weight
than the C group and lower than the OP group (OP>OR>C).
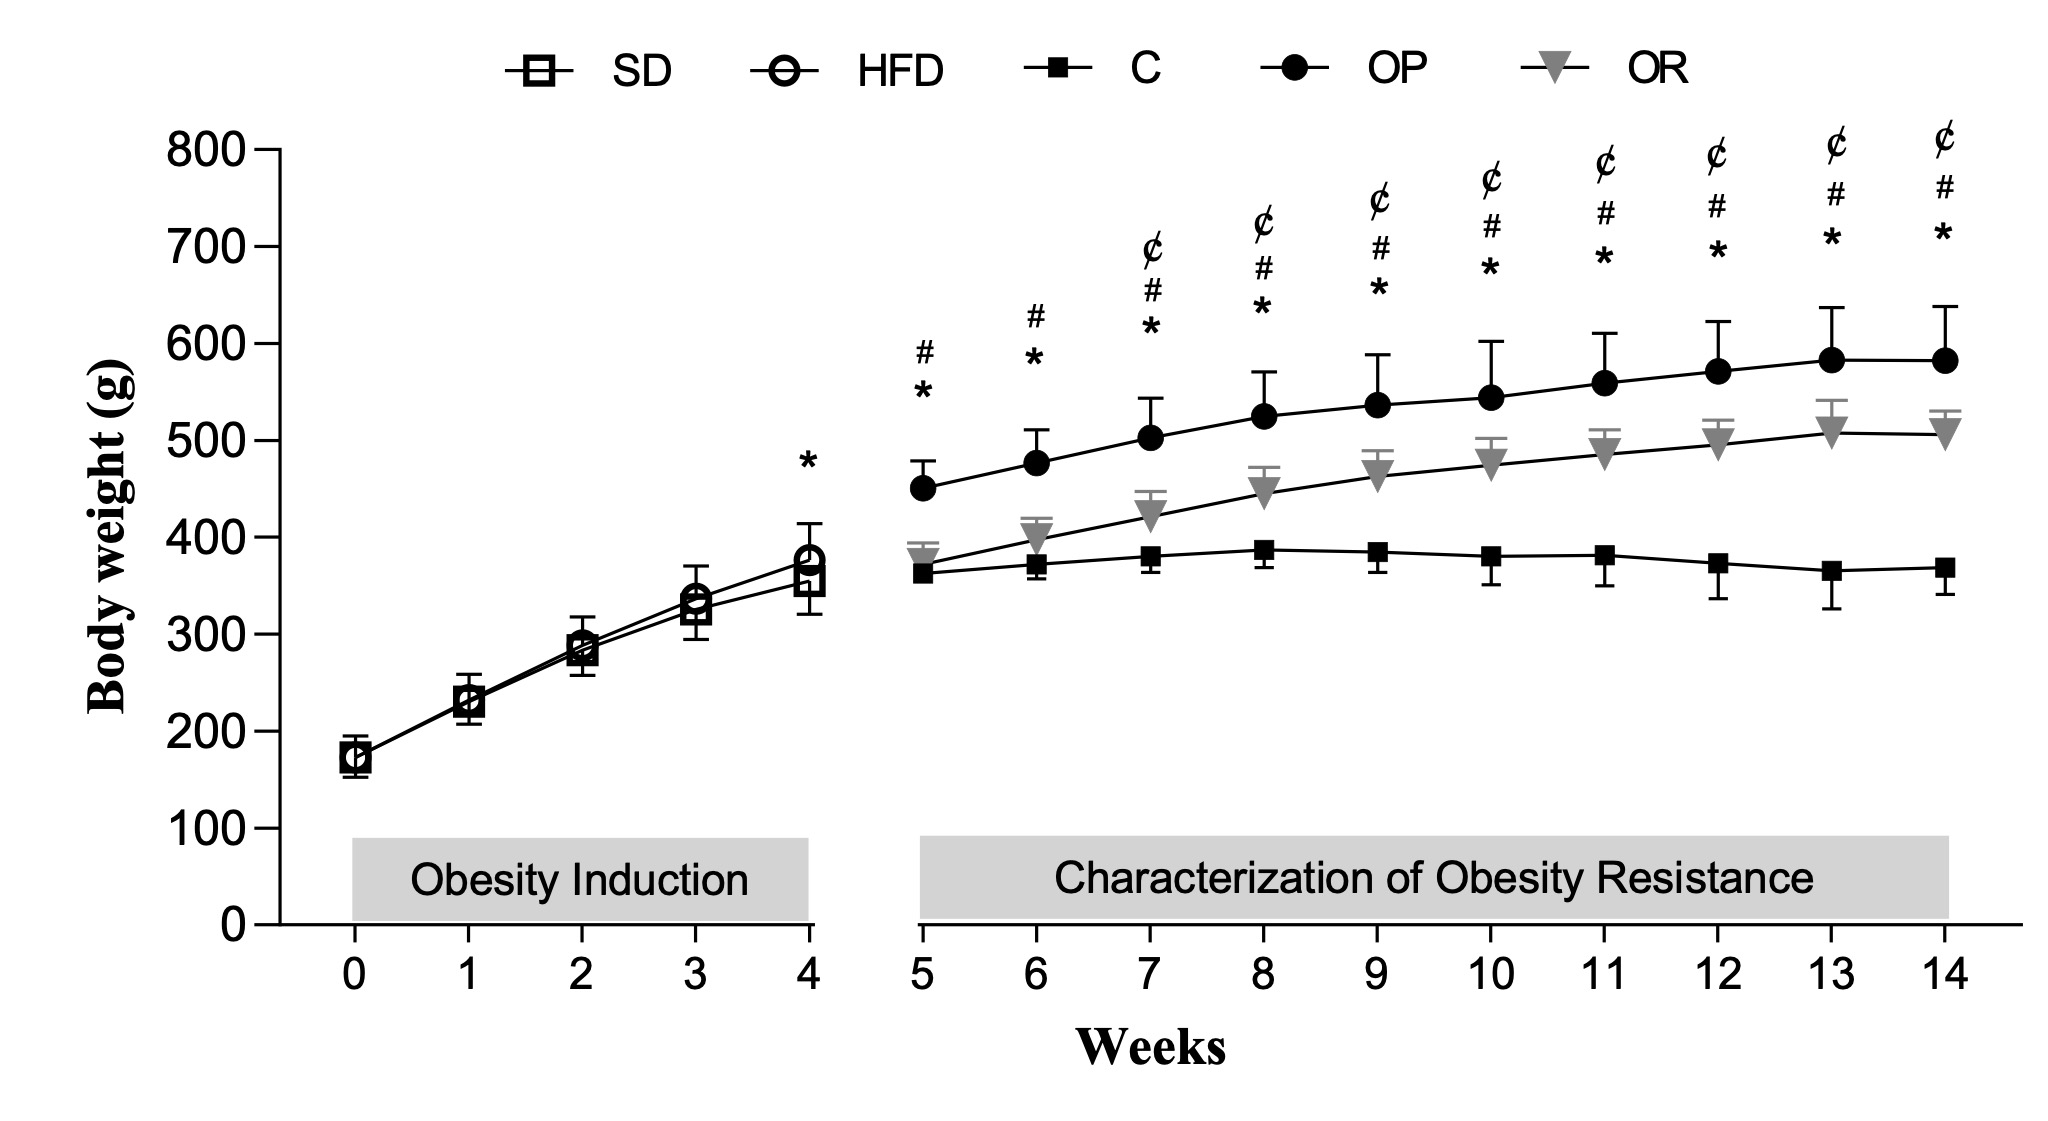
Fig. 2: Body weight evolution of the animals throughout the entire experimental protocol. Obesity induction (week 0 – 4) and characterization of obesity resistance (week 5 - 14). Standard diet (SD, n = 35); High-fat diet (HFD; n = 36). Control (C, n = 8), Obesity-prone (OP, n = 12), and Obesity-resistant (OR, n = 12) groups. Data are expressed as mean ± standard deviation. p < 0.05; *C vs. OP; ¢C vs. OR; #OP vs. OR; Two-way repeated measures ANOVA followed by Bonferroni post-hoc test.
Characterization of Obesity Resistance
Table 1 presents the results after the characterization of Obesity-Resistance at the end of the
experimental protocol. The final body weight (FBW) was lower in OR group than OP group and higher than C
group, respectively. Considering the body adiposity, the results show that the OR group exhibited
intermediate values of epididymal, retroperitoneal, and visceral fat, being elevated and reduced, when
compared to C and OP groups, respectively. In addition, the total body fat pads also differed from those
of the other groups (OR > C and OR <OP; p < 0.05). When comparing the adiposity index among the
groups, the results show an elevation in OR (312.5%) and OP (421%), when compared to C group.
The nutritional behavior between the OR and OP groups was not similar, since OR animals had a lower daily
food consumption than OP group, but it was similar in relation to C group. Likewise, the daily calorie
intake was lower in OR group than OP group, but higher than C group. Feed efficiency did not differ
between the OR and OP groups; this parameter was higher in OR and OP than C.
The OR and OP groups exhibited higher levels of cholesterol and HDL levels when compared to C group; these
parameters were similar between OR and OP. TG levels were similar across all experimental groups. In
relation to hormonal profile, OP group had elevated leptin levels when compared to OR and C groups,
respectively (Table 2). In the OR condition, an intermediate characteristic was observed, with leptin
levels higher than the C group and lower than OP group. TNF-alpha levels, which it was measured to
evaluate the systemic inflammation, was no difference among groups.
Fig. 3 illustrates the assessment of glucose profile, including the results from glucose tolerance test
(GTT), glycemic area under the curve (AUC), basal glucose, fasting insulin, and HOMA-IR. OR and OP groups
did not show statistical differences for glucose between each other at baseline and after 30, 60, 90 and
120 minutes; both exhibited higher baseline glucose levels by 16.7% in the OR group and 20.5% in the OP
group compared to the C group, respectively. In addition, at 30 and 60 minutes, the OP and OR groups
showed higher glucose levels only in comparison to the C group; the OR group did not differ from C groups
at 90 and 120 minutes; OP presents high glucose values in relation to C in these points. (Fig. 3A). In the
analyses of glycemic AUC (Fig. 3B), fasting serum insulin (Fig. 3C), and HOMA-IR (Fig. 3D), the OR and OP
groups exhibited higher values than C group, but no differences were observed between these groups.
Fig. 4 presents the morphological evaluations of white adipose tissues. The OR and OP groups exhibited
hypertrophy, with significantly larger adipocyte areas than the C group (p<0.05) in both visceral
adipose (VAT) and retroperitoneal adipose tissues (RAT) (Fig. 4B). However, when directly comparing the OR
and OP groups for this same parameter in RAT, a p-value of 0.075 was observed. This result implies that,
although not statistically significant by the conventional criterion (p<0.05), the observed difference
may still be biologically relevant. Nevertheless, the evaluation of the number of fat cells (hyperplasia)
revealed distinct patterns in both VAT and RAT (Fig. 4C). In both tissues, the OR group exhibited a lower
quantity of adipocytes compared to the OP group, but they did not differ significantly from C. Conversely,
the OP group had a significantly higher number of adipocytes compared to C group.
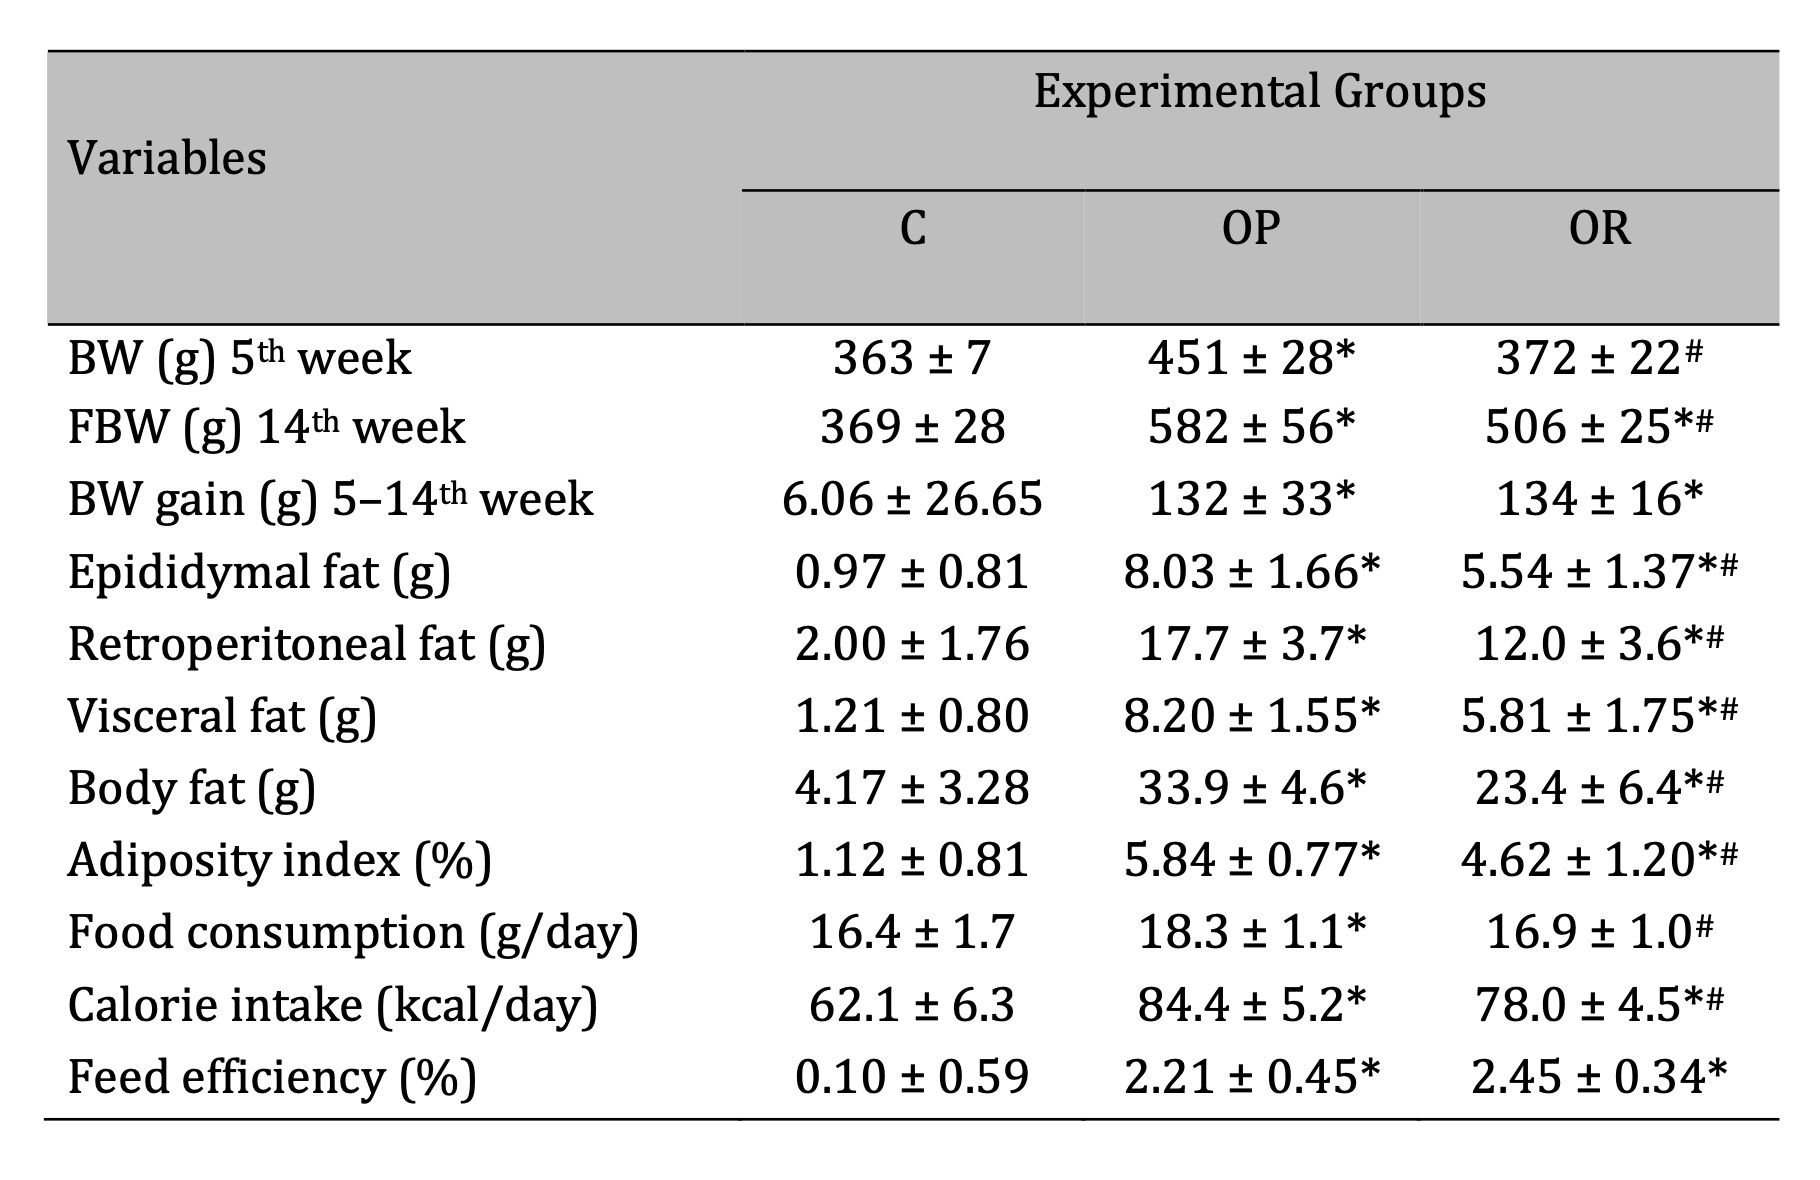
Table 1: Characterization of Obesity Resistance. C: Control (n=8); OP: Obesity-Prone (n=12); OR: Obesity-Resistant (n=12). BW: body weight; FBW: final body weight; body fat: sum of fat pads (epididymal, retroperitoneal, and visceral). Data expressed as mean ± standard deviation. p<0.05; * vs. C; #OP vs. OR. One-way ANOVA, followed by Tukey’s post-hoc test.
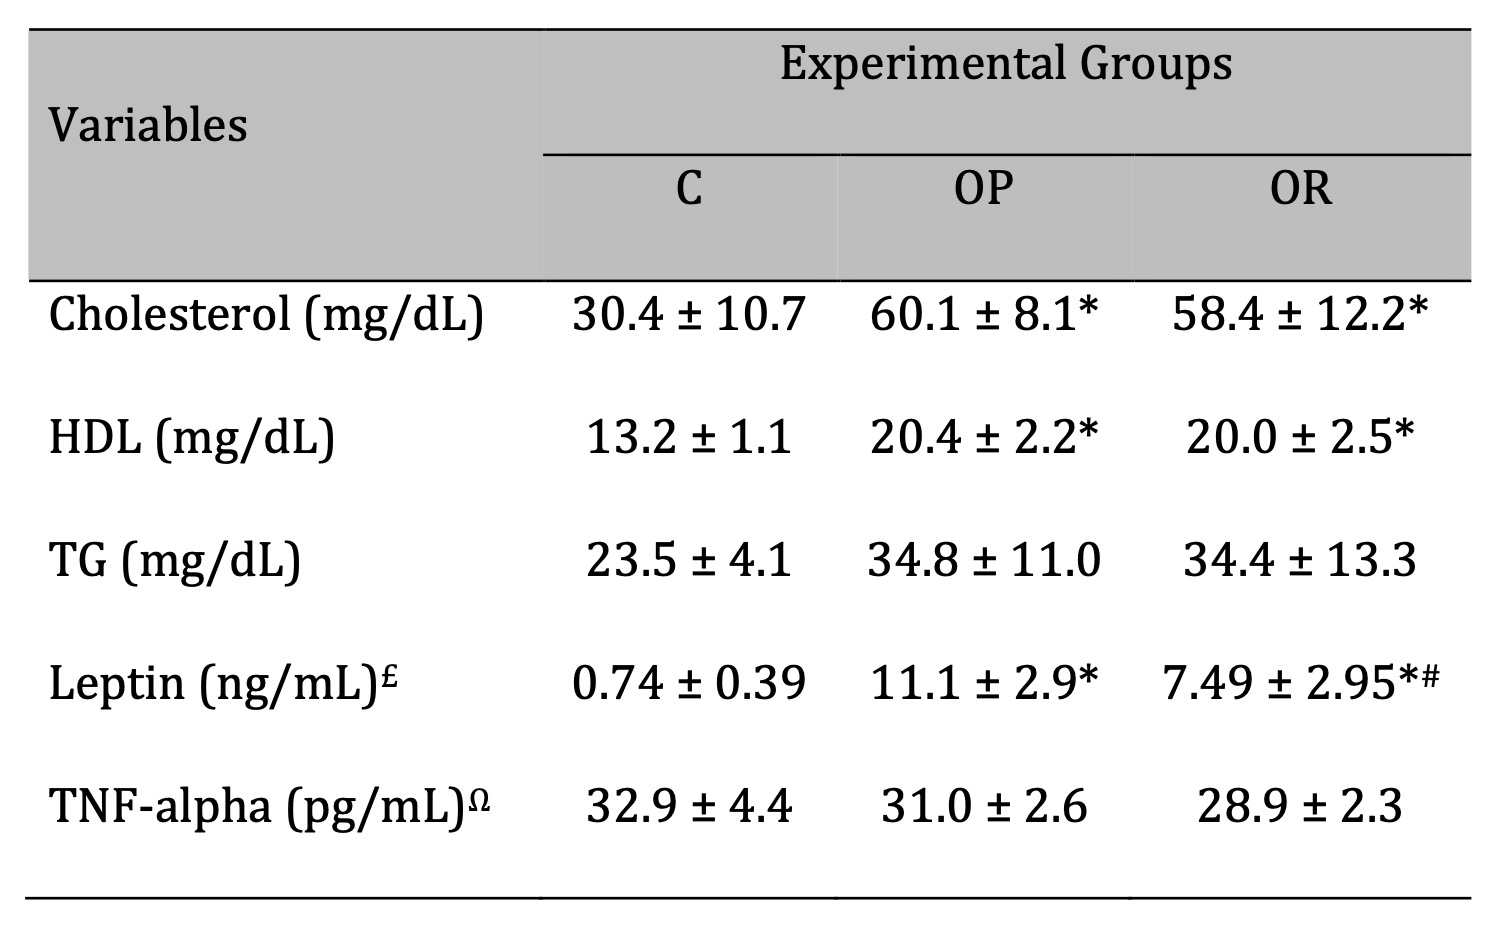
Table 2: Lipidic and hormonal profile. C: Control (n=5); OP: Obesity-Prone (n=8); OR: Obesity-Resistant (n=7). Leptin analysis - £C (n=7); OP (n=8); OR (n=8). TNF-alpha analysis - ΩC (n=8); OP (n=8); OR (n=8). HDL: High-Density Lipoprotein; TG: Triglyceride. Data expressed as mean ± standard deviation. p<0.05; * vs. C; #OP vs. OR. One-way ANOVA, followed by Tukey's post-hoc test.
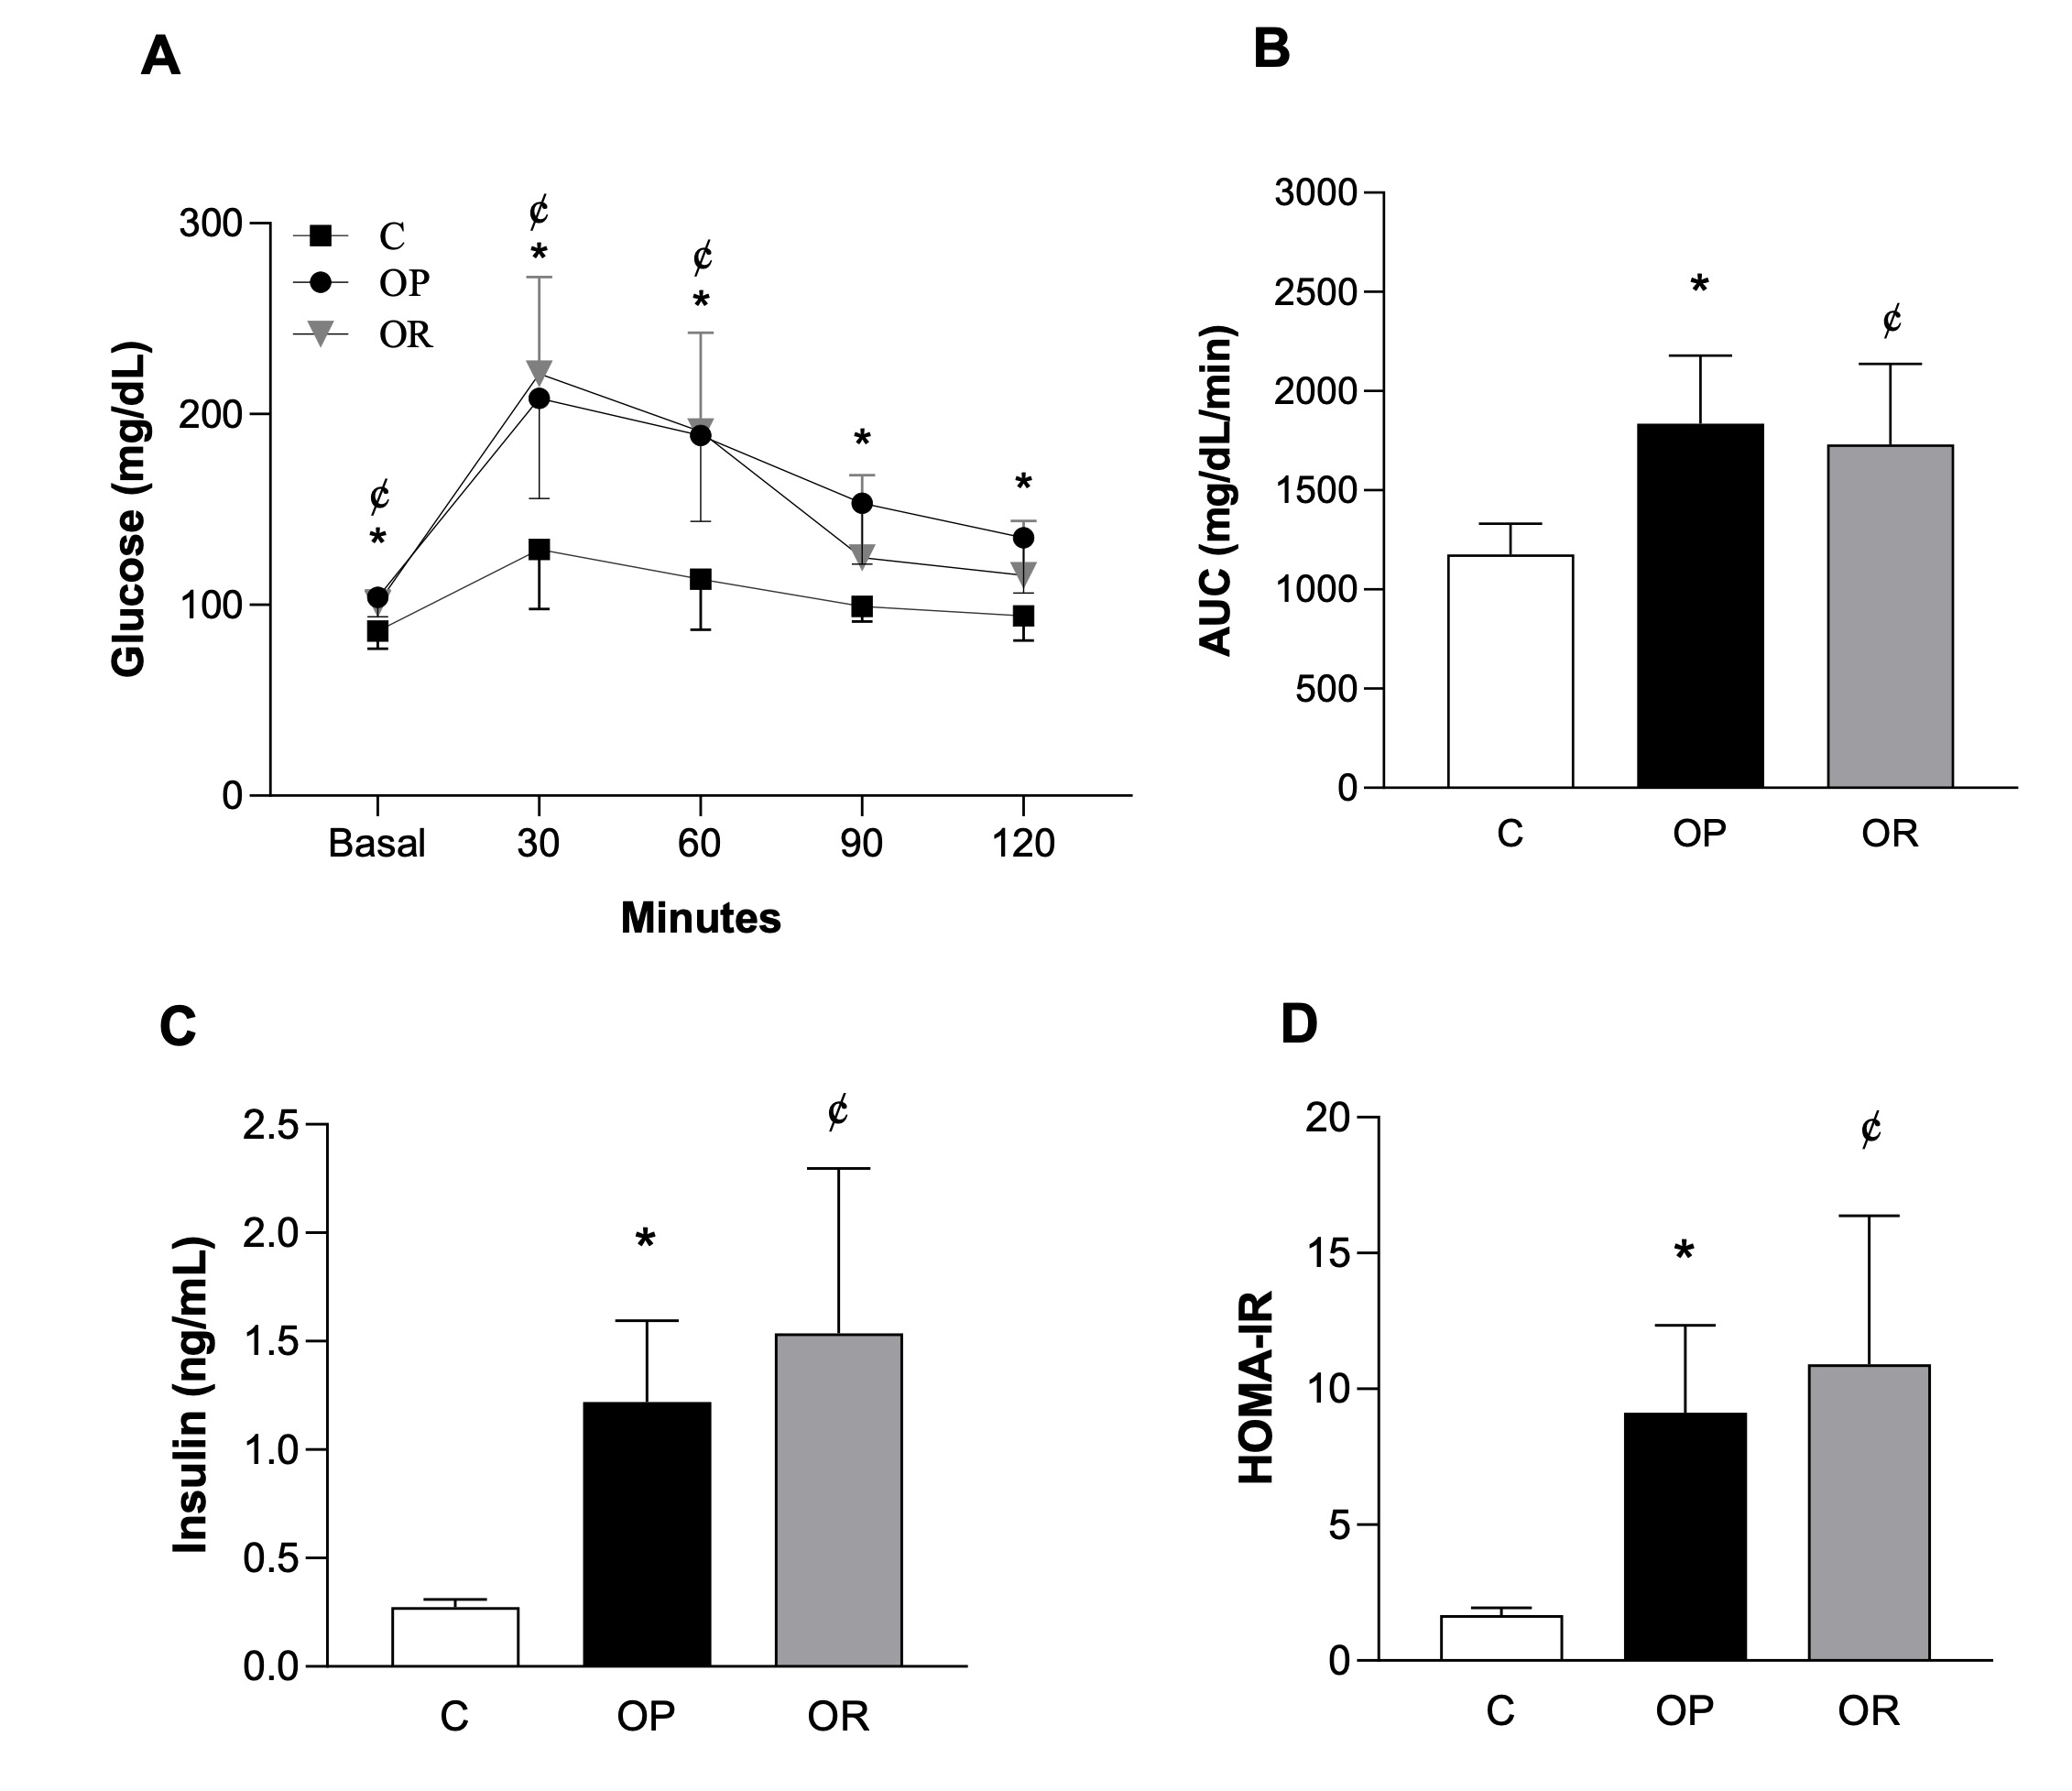
Fig. 3: Assessment of glucose profile. A) Glucose Tolerance Test (GTT); B) Area Under the Curve (AUC) for Glucose; C) Fasting Serum Insulin; D) Homeostatic model assessment index (HOMA-IR). Control (C, n=8), Obesity-Prone (OP, n=8), and Obesity-Resistant (OR, n=7) groups. Data expressed as mean ± standard deviation. p<0.05; *C vs. OP; ¢C vs. OR. Two-way ANOVA for repeated measures, followed by Bonferroni post-hoc test (GTT). One-way ANOVA, supplemented with Tukey's post-hoc test (AUC, basal glucose, fasting insulin, HOMA-IR).

Fig. 4: Morphological analysis of adipocytes in white adipose tissues after 14 weeks of experimental protocol. Stained with Hematoxylin & Eosin (10x). VAT: visceral adipose tissue; RAT: retroperitoneal adipose tissue. A) Representative photomicrographs of VAT and RAT fragments; B) Area (hypertrophy) of adipocytes; C) Number of adipocytes (hyperplasia). Control (C, n = 6), Obesity-Prone (OP, n = 8), and Obesity-Resistant (OR, n = 8) groups for VAT. Control (C, n = 7), Obesity-Prone (OP, n = 8), and Obesity-Resistant (OR, n = 8) groups for RAT. Data expressed as mean ± standard deviation. p<0.05; * vs. C; #OP vs. OR. One-way ANOVA, followed by Tukey's post-hoc test.
MASLD in Obesity-Resistance
Fig. 5 illustrates the evaluation of liver tissue in the experimental groups. It can be observed that the
OR and OP groups exhibited similar areas of hepatic steatosis, analyzed histologically using Oil Red-O
staining (Figures 5A and 5B). When comparing the steatosis area of the C group with the other groups, the
results showed that the C group presented a reduction of 84.2% and 85.4% when compared to OR and OP
groups. Additionally, the OR and OP groups exhibited greater total liver weight (Fig. 5C) and lower water
content (Fig. 5D) compared to C group. The OR group showed a statistically significant reduction in liver
weight compared to the OP group (Fig. 5C).
Considering that MASLD is characterized by the presence of hepatic steatosis in more than 5% of the liver
or a score greater than 0 in rodent classification, the morphological results showed that the OR and OP
groups presented the MASLD. In addition, the C group exhibited insignificant levels of hepatic fat, with
less than 5% and a score of 0 for steatosis, thereby excluding the possibility of MASLD in this group.
Figs. 5E-I summarizes the results from classification system proposed for rodents by Liang et al. (2014)
and Fig. 5J illustrates the final score (∑ Score) of each animal along with its respective disease
stage, based on the sum of individual scores for macrovesicular steatosis, microvesicular steatosis,
hepatocellular hypertrophy and inflammation, as well as fibrosis. When evaluated together, it was observed
that the OR and OP groups did not show statistical differences in macrovesicular and microvesicular
steatosis (Figures 5E and F). Additionally, there was no difference between the groups for hypertrophy and
inflammation scores (Figures 5G and H). However, by summing the scores of each animal and classifying them
according to the rodent classification system, it can be inferred that the OR and OP groups were at
different stages of the disease. Specifically, 50% of the OR animals were classified in the initial stage
of metabolic dysfunction-associated steatosis liver (MASL), a condition that is part of the broader
category of MASLD. Additionally, 37.5% of the OR animals had progressed to metabolic
dysfunction-associated steatohepatitis (MASH). In contrast, the OP group was predominantly characterized
by MASH, with 87.5% of the animals exhibiting this condition (Fig. 5J).
The results from hepatic steatosis, insulin resistance (IR), and serum leptin levels relationship were
illustrated in Fig. 6. Moderate positive correlations were observed between hepatic steatosis area and
leptin (r = 0.68, p = 0.0003) (Fig. 6A), as well as between hepatic steatosis area and IR (r = 0.69, p =
0.0002) (Fig. 6B). Additionally, there was a significant positive correlation between IR and leptin levels
(r = 0.91, p < 0.0001) (Fig. 6C). These correlations can help us identify relationships between adipose
dysfunction, leptin resistance, and MASLD progression in obesity-resistant animals.

Fig. 5:Evaluation of liver tissue in experimental groups. A) Representative photographs and photomicrographs stained with H&E (40x), Oil Red-O (40x), and Sirius Red (10x). B) Quantitative analysis of hepatic steatosis in Oil Red-O-stained sections (40x). C) Total liver weight. D) Water content. E-I) Grading scores of Metabolic Dysfunction-Associated Steatotic Liver Disease (MASLD), assessed by two pathologists. J) Stages of Metabolic Dysfunction-Associated Steatotic Liver Disease (MASLD) in the OP and OR groups, according to the classification system proposed for rodents. MASL: Metabolic Dysfunction-associated Steatosis Liver. MASH: Metabolic Dysfunction-associated Steatohepatitis. Macrovesicular steatosis (bold arrow): large lipid droplets present in hepatocytes; microvesicular steatosis (dotted arrow): small lipid droplets present in hepatocytes; clusters of inflammatory cells (circled); hepatocyte hypertrophy (white arrow). HE: Hematoxylin & Eosin. Control (C, n = 8), Obesity-prone (OP, n = 8), and Obesity-resistant (OR, n = 8) groups. Data are expressed as mean ± standard deviation. p < 0.05; * vs. C; #OP vs. OR. One-way ANOVA, supplemented with Tukey's post-hoc test for parametric data (Figures A to D); and Mann-Whitney for non-parametric data (Figures E to J).
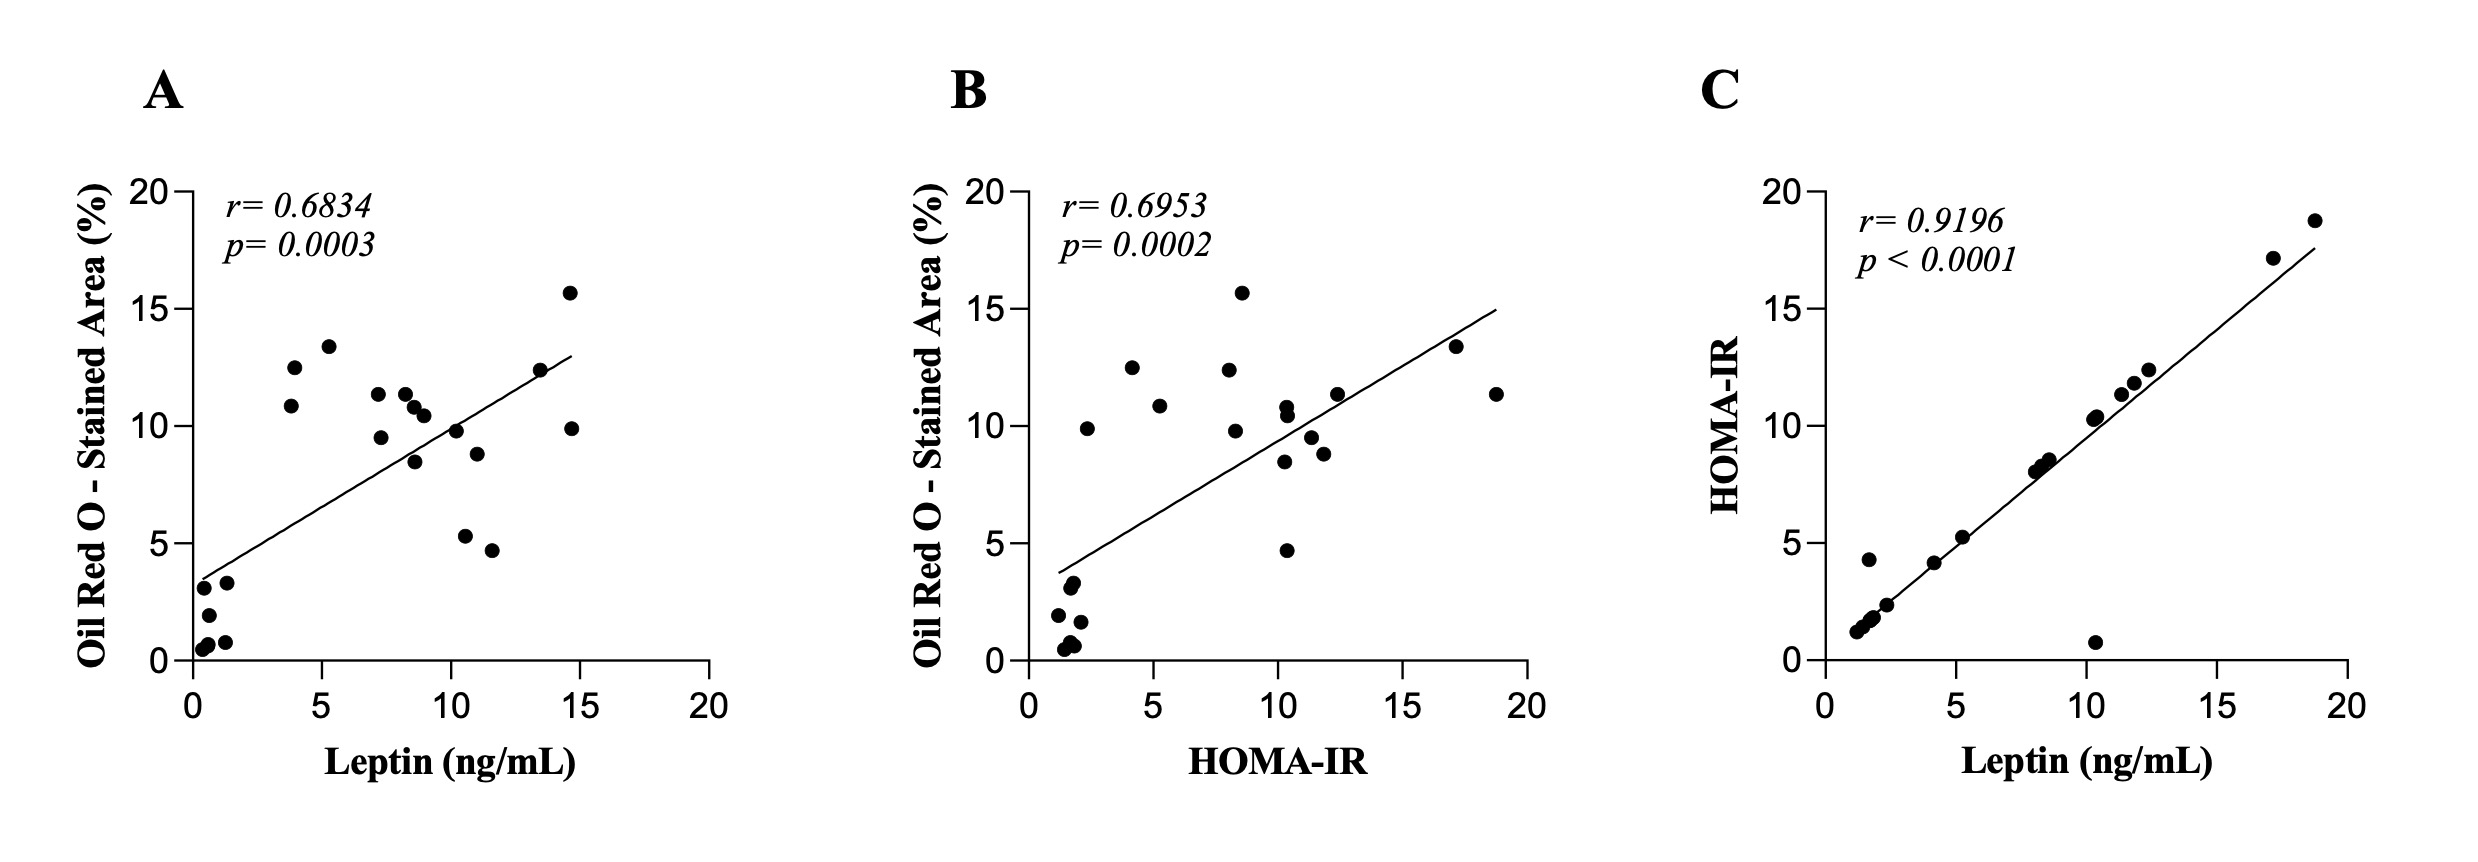
Fig. 6: Correlations between hepatic steatosis area, leptin, and insulin resistance (IR). A) hepatic steatosis area and leptin correlations. B) hepatic steatosis area and HOMA-IR correlation. C) HOMA-IR and leptin correlations. Control (n=7), Obesity-Prone (n=8), and Obesity-Resistant (n=7) groups. HOMA-IR: Homeostatic Model Assessment of Insulin Resistance. Data are presented as mean using Pearson's correlation coefficient (r).
Discussion
This study aimed to elucidate the impact of a high-fat diet containing saturated fat on the development of Metabolic Dysfunction-Associated Steatotic Liver Disease (MASLD) in obesity-resistant (OR) rats and to explore the associated metabolic and morphological changes. The main findings of current study were that, although OR rats exhibited reduced body weight gain and lower fat accumulation compared to obesity-prone (OP) rats, they still developed MASLD. Notably, 50% of the OR rats presented with early-stage MASLD, and 37.5% advanced to metabolic dysfunction-associated steatohepatitis (MASH), highlighting that chronic exposure to a high-fat diet with saturated fat induces significant metabolic and hepatic alterations even in individuals resistant to obesity. In addition, OR rats displayed notable morphological and metabolic changes associated with MASLD, including disruptions in metabolic parameters and alterations in adipose tissue similar to those observed in OP rats.
OR has become an increasingly prominent topic in scientific research due to its potential to provide insights into the etiology of obesity and associated metabolic disorders, such as MASLD. The characterization of OR reveals animals that, despite being subjected to the same high-fat diet (HFD) as their obesity-prone (OP) counterparts, exhibit significantly lower body weight gain and adiposity. Over years of investigation, various protocols for inducing obesity and characterizing OR have been established [3, 5, 23, 25, 30, 36, 39-42].
Among these protocols, the type of diet employed is arguably one of the most critical variables in this form of experimental research, requiring careful evaluation due to its direct impact on adiposity and the development of metabolic disorders [43]. In the current study, the HFD utilized was effective in inducing obesity in rodents by the fourth week of treatment, corroborating previous studies that validate this experimental model [40, 44, 45]. The selected diet contained 45% of calories from fat, with lard as the primary source, justifying its proven effectiveness in promoting adiposity and metabolic dysregulation, as demonstrated in other studies [4, 40, 46-48].
The identification and characterization of the OR group in this study were based on body weight, employing the tertile criterion, which facilitates a phenotypically homogeneous classification of animals and is widely accepted in the literature [2, 40, 49]. Thus, OP group maintained a higher BW compared to other groups throughout the experiment, however, the OR group had an intermediate body characteristic, being the onset of weight differentiation in the week 6 compared to group C. At the end of the experiment, the OR was characterized by a reduction of 13% in BW and a 21% lower adiposity index, respectively, when compared to obesity. These findings align with literature, which suggests that the OR group tends to gain BW more slowly and to present a intermediate characteristics between the OP and C groups [4, 42, 48-50] even under chronic HFD exposure [40, 41]. This improvement in energy expenditure suggests a more efficient control of lipid metabolism and appetite [51, 52]. In this context, the presence of compensatory mechanisms in OR can occur, such as enhanced thermogenesis or increased leptin sensitivity, which may have mitigated the impact of the HFD [41, 52-55].
Corroborating the body weight findings, the current study similarly showed that OR also has intermediate characteristics for adiposity, since it was observed a smaller visceral and retroperitoneal fat pad in comparison to OP group, yet larger than those in the C group. The increase in adiposity observed in OR and OP groups suggests that even OR animals still accumulate significant fat. One explanation for these results can be attributed to differences in nutritional profile between the OP and OR groups, which it may contribute to this variation in adiposity. Previous studies have also reported lower food consumption and caloric intake in the OR group compared to the OP group [36, 46, 56, 57], probably due to a more efficient hormonal response to satiety that is mediated by leptin and other anorexigenic hormones [41, 54, 55]. The similar feed efficiency between the OR and OP groups indicates that weight gain was not influenced by the efficiency in converting calories into BW, suggesting that control of caloric intake and possibly factors related to basal metabolism or adaptive thermogenesis played a more relevant role in limiting weight gain in the OR.
Hormonal and metabolic alterations are central characteristics of obesity, often associated with imbalances in glucose homeostasis, lipid metabolism, and appetite regulation [19, 53, 58]. In the context of our study, we observed that despite the lower weight and fat gain, OR rats exhibited significant changes in several metabolic and hormonal parameters. The analysis also revealed that OR rats had intermediate levels of serum leptin, total fat pads, and final liver mass, positioning them between the C and OP groups. Additionally, there were no significant differences in total cholesterol, HDL, glycemic, and insulinemic profiles between the OR and OP groups, however, both groups presented higher values than C group.
In this study, serum leptin levels were directly proportional to adipose mass across all experimental groups, consistent with the established role of leptin as a mediator of energy homeostasis [51]. Typically, diet-induced obesity in rodents results in hyperleptinemia and leptin resistance, leading to increased food intake and weight gain [59]. However, our findings did not show evidence of hyperphagia or leptin resistance in the OR group. Research supports that efficient leptin signaling is crucial for regulating appetite and preventing excessive weight gain. For instance, leptin resistance often leads to hyperphagia and metabolic dysregulation, whereas effective leptin signaling helps maintain energy balance [60]. The absence of elevated food intake in the OR group, despite intermediate leptin levels, implies that these rats have preserved leptin sensitivity, which could be attributed to differences in leptin receptor functionality or downstream signaling pathways [61]. Thus, it is reasonable to propose that OP group has developed leptin resistance, characterized by impaired leptin action and increased food consumption, while the OR group maintains effective leptin signaling. This enhanced leptin responsiveness likely contributes to the OR rats’ ability to avoid excessive weight gain.
Moreover, taking into account that the biochemical and physiological disorders related to obesity and OR, our data revealed that the glucose metabolism was damaged in presence or absence of obesity. Thus, OR and OP animals exhibited hyperglycemia, impaired glucose tolerance, hyperinsulinemia and insulin resistance (IR), respectively. Based on literature and our findings, it is inferred that basal hyperinsulinemia promoted higher hepatic glycogen content, reducing the liver’s buffering capacity for blood glucose and delaying glucose clearance from circulation in the OP and OR groups during the glucose tolerance test (GTT) [62, 63]. Our results are in according to several studies that have also demonstrated altered fasting glucose and insulin values, as well as elevated HOMA-IR indexes [25, 30]. These findings support our initial hypothesis that metabolic changes are independent of the presence of obesity.
Despite their resistance to obesity, the OR rats in our study exhibited notable metabolic impairments. These findings might seem counterintuitive given their lower body fat accumulation compared to OP rats. However, several factors could explain these metabolic abnormalities in the OR group. Firstly, hyperglycemia in OR rats can arise from impaired glucose uptake and utilization, despite their resistance to obesity. This condition may result from a combination of reduced insulin sensitivity and altered glucose handling by the liver. In our study, the OR group demonstrated elevated fasting insulin levels, suggesting an ongoing compensatory mechanism to counteract insulin resistance. Prolonged IR can overwhelm this compensatory mechanism, leading to persistent hyperglycemia [64]. Additionally, the impaired glucose tolerance observed in the OR group may be attributed to a decreased ability of insulin to facilitate glucose uptake into peripheral tissues, particularly muscle and adipose tissues. This decreased insulin sensitivity is often associated with dysregulation in insulin signaling pathways, such as reduced expression or function of insulin receptors and downstream signaling components like GLUT4 [65]. The higher hepatic glycogen content observed in the OR group could exacerbate the glucose intolerance. Increased hepatic glycogen storage may limit the liver’s ability to effectively regulate blood glucose levels, contributing to delayed glucose clearance during the GTT.
The lipid profile was similar between OP and OR animals, reinforcing the notion that the chronic HFD consumption causes metabolic damage, independently of obesity. Thus, both conditions induced isolated hypercholesterolemia in animals without alterations in TG. Dysregulation of lipid balance is a key factor in the development of metabolic disorders, including IR, atherosclerosis, and MASLD. According to Flock and Kris-Etherton (2013) [66], saturated fatty acids, such as those found in lard, are associated with increased plasma concentrations of low-density lipoproteins (LDL-c) and total cholesterol. In the OR group, the increase in cholesterol without changes in TG levels could be explained by differences in lipid metabolism regulation, particularly the way the liver handles lipids under high-fat diet conditions. Cholesterol levels are often more sensitive to dietary fat intake, especially saturated fats, which promote increased cholesterol synthesis and reduced clearance of LDL from the bloodstream [67, 68]. This can occur even in the absence of obesity, as seen in the OR rats. On the other hand, TG are strongly influenced by the balance between energy intake and expenditure. In our study, despite the observed differences in adiposity between the OR and OP groups, there was no significant difference in circulating TG levels between these groups. This suggests that, despite lower adiposity in OR animals, their capacity to metabolize and store TG remains comparable to that of OP animals. Therefore, the impact of a high-saturated fat diet on triglyceride levels appears to be similar between the groups, reflecting a common metabolic response to excessive lipid intake [69].
Additionally, we evaluated tumor necrosis factor-alpha (TNF-alpha), a key cytokine involved in systemic inflammation, commonly associated with obesity, and implicated in the development of insulin resistance and endothelial dysfunction [70, 71]. Despite expectations, both OR and OP groups did not show increased levels of this pro-inflammatory marker, a result consistent with previous findings [5, 72]. One possible explanation for the lack of TNF-alpha elevation is that the inflammatory response may be more localized within the adipose tissue rather than systemic, and thus not reflected in serum levels. Alternatively, other inflammatory mediators, such as IL-6 or MCP-1, may have played a more prominent role in early inflammatory responses, compensating for TNF-alpha’s involvement in the initial phases of diet-induced inflammation [73-75].
Adipose tissue remodeling, characterized by an increase in both the size (hypertrophy) and number (hyperplasia) of adipocytes, is a common feature of obesity [76]. Specifically, in OR, our findings similarly revealed adipocyte hypertrophy, particularly in visceral and retroperitoneal fat pads. This pattern of adipocyte expansion aligns with what has been documented in OP models, where hypertrophied adipose tissue is linked to metabolic dysfunction, including impaired lipid storage capacity [77].
The hypertrophy observed in OR rats can be attributed to sustained exposure to a HFD, which drives adipose tissue expansion to accommodate excess lipid intake. Adipocyte hypertrophy occurs when the storage capacity of adipocytes is exceeded, leading to larger fat cells that become less efficient in lipid storage [27, 76]. This inefficiency may contribute to lipid spillover into non-adipose tissues, including the liver. Research indicates that approximately 60% of the fat deposited in the liver originates from adipose tissue, underscoring the connection between dysfunctional fat storage and hepatic steatosis [18, 19]. Therefore, the hepatic lipid accumulation in OR could reflect ongoing metabolic stress and compromised lipid handling, which is consistent with observed metabolic disturbances in both groups. Adipocyte hypertrophy is often linked to inflammatory responses [78]. Larger adipocytes are prone to hypoxia, which triggers macrophage recruitment and activates inflammatory signaling pathways, such as IKKβ/NF-κB and JNK/AP-1. These pathways lead to the production of pro-inflammatory cytokines, including TNF-alpha, which exacerbates IR and promotes lipolysis, increasing free fatty acid (FFA) levels in the bloodstream [58]. Although no differences were observed in TNF-alpha levels among groups, the hypertrophic condition in OR suggests that chronic high-fat diet exposure induces substantial metabolic stress and adipose tissue dysfunction.
Interestingly, while the OR group exhibited less hyperplasia compared to OP rats, indicating a limitation in the expansion of adipocyte numbers, this did not translate into differences in IR between the two groups. The reduced hyperplasia in OR rats might reflect a more effective regulation of lipid storage within existing adipocytes or an adaptation to lipid overload. However, despite this adaptation, the OR group did not prevent the IR, suggesting that high-fat diet-induced metabolic dysfunction affects both groups similarly. Thus, the demonstrated hypertrophy and IR in OR and OP groups highlight that a diet rich in saturated fats impairs metabolic function regardless of the differences in adipocyte hyperplasia, emphasizing the complex interplay between adipose tissue expansion, hepatic lipid accumulation, and metabolic health [79-81]. Additionally, the reduced number of adipocytes in the OR compared to obesity, may indicate, paradoxically, a protective mechanism against extreme to this disease, but it could also pose a risk for metabolic complications if the fat storage capacity is exceeded. The literature indicates that when hypertrophied adipocytes reach their size limit, hyperplasia occurs as a compensatory mechanism for the energy imbalance [76, 82]. The exact mechanism remains unclear, but one possible hypothesis involves the role of sterol regulatory element-binding protein 2 (SREBP2), a transcription factor related to cholesterol metabolism, where its activation threshold may trigger adipogenesis [82].
Thus, in parallel with the present study, it is inferred that the hyperplasia observed in the presence of obesity may be driven by yet-to-be-elucidated mechanisms involved in this borderline expandability of the adipocytes in OP rats, resulting in heightened stimulation of adipogenesis. Previous studies on the effects of a HFD on adipose tissue have yielded varied results. Some research found no difference in visceral fat area between OR and C groups [36, 40], while another study reported larger adipocytes in OP rats and a higher number of cells in the OR group [3]. These discrepancies suggest that the impact of HFD on adipose tissue can differ depending on the study design and model used. In this scenario, the several dietary exposure protocols, with different macronutrient percentages, fat sources, treatment durations, and experimental models, strongly contribute to the differences found. This underscores the importance of considering not only the quantity but also the quality of the diet.
MASLD is a condition frequently associated with obesity, characterized by the accumulation of fat in hepatocytes and ranging from simple steatosis to more severe stages such as MASH, which can progress to cirrhosis and hepatocellular carcinoma [15]. Considering our metabolic and morphological findings collectively in OR, we can infer that the significant metabolic dysregulation observed in OR rats is closely associated with the development of MASLD [18, 83]. However, the literature is scarce regarding this involvement of this disease in OR individuals, highlighting the scientific relevance of investigating MASLD in the Obesity Resistance.
The results of hepatic steatosis in OR and OP groups confirm the development of MASLD regardless of obesity. Hepatic steatosis observed in OR groups was demonstrated by Omagari et al [23]., which evaluated MASLD in Wistar/ST rats subjected to a chronic HFD regimen and observed lipid accumulation in both OP and OR groups. In another study, Xia et al [26]. found hepatic steatosis in male C57BL/6J OR mice exposed to an HFD containing 45% fat during the 17th week of the experiment, although in smaller amounts compared to the OP group.
The presence and extent of steatosis, inflammation, and fibrosis in the liver indicate the stage of MASLD. Thus, the analysis revealed that 50% of OR rats (4 out of 8) had an initial diagnosis of the disease, marked by hepatic steatosis with minimal or insignificant inflammatory infiltrates. Notably, 37.5% of OR rats (3 out of 8) progressed to MASH. In contrast, 87.5% of obesity-prone (OP) rats (7 out of 8) developed MASH, indicating a more rapid progression to severe stages of the disease. These data suggest that even though OR rats exhibit a lower rate of progression to MASH compared to OP rats, chronic exposure to a high-fat diet (HFD) still induces significant and detrimental hepatic alterations. The fact that a substantial proportion of OR rats advanced to MASH despite their resistance to obesity highlights the harmful impact of HFD on metabolic health. This emphasizes that obesity resistance does not confer protection against the metabolic and hepatic damage caused by high-fat diets, reinforcing the critical need to address dietary impacts on metabolic dysfunction across different phenotypes. These findings are consistent with observations from another study that also identified the development of hepatic steatosis and MASH in both OP and OR rats under similar HFD conditions [23]. Regarding MASLD severity in the presence of obesity or obesity-resistance, OP rats exhibited a more pronounced progression compared to OR rats, as demonstrated by the higher inflammation and fibrosis scores.
The greater number of OP animals diagnosed with MASH suggests that there are specific differences in hepatic metabolism between OP and OR rats that contribute to more severe disease progression in OP rats. One key factor could be the disparity in leptin levels observed between the two groups. Elevated leptin levels in OP rats, especially when coupled with insulin resistance, could lead to enhanced hepatic lipogenesis and fat accumulation, exacerbating liver dysfunction [84]. This increased hepatic fat deposition, combined with persistent inflammation, likely accelerates the progression from MASLD to MASH in OP rats [85]. Additionally, differences in cytokine profiles, which may predispose OP rats to more severe forms of MASLD, could further differentiate their hepatic metabolism from that of OR rats [84]. This highlights the complex interplay between adipose tissue metabolism, leptin signaling, and liver pathology in determining the progression of MASLD.
Finally, this research provides a solid basis for future investigations that explore the molecular mechanisms underlying obesity resistance, such as the regulation of lipid metabolism, hormonal signaling, and localized inflammation in specific tissues.
In summary, this study demonstrated that chronic consumption of a HFD in OR rats induces significant metabolic alterations, changes in adipose tissue and the development of MASLD. Even in the absence of obesity, OR rats progressed to advanced stages of MASLD, such as MASH, with alterations in adipose tissue similar to those observed in OP rats. These findings support the hypothesis that prolonged HFD exposure induces metabolic dysfunctions in both adipose and hepatic tissues, highlighting that OR does not protect against the harmful effects of a HFD.
Acknowledgements
We are grateful to Beatriz Crisostomo dos Santos, Ramon dos for their assistance. We also extend our appreciation to the Laboratório de Ultraestrutura Celular Carlos Alberto Redins and Laboratório Multiusuário de Histotécnicas of the Federal University of Espírito Santo for their technical support. Also to Fundação de Amparo à Pesquisa e Inovação do Espírito Santo – FAPES (grant number: 2022-J72BB and 2023-MHRH6) for support this work and Higher Education Personnel Improvement Coordination – Capes for their assistance.
Statement of Ethics
Animal experiments conform to internationally accepted standards and have been approved by the Animal Use
Ethics Committee of the Federal University of Espírito Santo under protocol 53/2019; approved on
December 20, 2019.
Author Contributions
A.R.M., V.V.P.M., J.C.C., A.P.L.L., and A.S.L. conceived the design of the study. A.R.M., V.V.P.M.,
J.C.C., S.T.S., K.O.M., B.S.S., L.N.M., B.V.N. A.P.L.L., and A.S.L. performed the experiments and
statistical analysis. P.V.F.G. and A.S.L. interpreted and discussed the data and wrote the manuscript.
A.R.M., A.P.L.L., and A.S.L. refined the final draft and revised the manuscript. All authors read and
approved the final version of the manuscript.
Disclosure Statement
The authors have no conflicts of interest to declare.
References
| 1 | Levin BE, Sullivan AC: Differences in saccharin-induced cerebral glucose utilization between
obesity-prone and -resistant rats. Brain Res 1989;488:221-232.
https://doi.org/10.1016/0006-8993(89)90712-9 |
| 2 | Levin BE, Triscari J, Sullivan A: Relationship between sympathetic activity and diet-induced
obesity in two rat strains. Am J Physiol Regul Integr Comp Physiol 1983;245:R364-R371.
https://doi.org/10.1152/ajpregu.1983.245.3.R364 |
| 3 | Poret JM, Souza-Smith F, Marcell SJ, Gaudet DA, Tzeng TH, Braymer HD, Harrison-Bernard LM,
Primeaux SD: High fat diet consumption differentially affects adipose tissue inflammation and
adipocyte size in obesity-prone and obesity-resistant rats. Int J Obes 2018;42:535-541.
https://doi.org/10.1038/ijo.2017.280 |
| 4 | Wang N, Guo J, Liu F, Wang M, Li C, Jia L, Zhai L, Wei W, Bai Y: Depot-specific inflammation with
decreased expression of ATM2 in white adipose tissues induced by high-margarine/lard intake. Plos
one 2017;12
https://doi.org/10.1371/journal.pone.0188007 |
| 5 | Wu P, Zhang F, Dai Y, Han L, Chen S: Serum TNF-α, GTH and MDA of high-fat diet-induced obesity and
obesity resistant rats. Saudi Pharm J 2016;24:333-336.
https://doi.org/10.1016/j.jsps.2016.04.011 |
| 6 | Thaker VV: Genetic and epigenetic causes of obesity. Adolesc Med State Art Rev 2017;28:379.
https://doi.org/10.1542/9781581109405-genetic |
| 7 | Lund J, Lund C, Morville T, Clemmensen C: The unidentified hormonal defense against weight gain.
PLoS Biol 2020;18:e3000629.
https://doi.org/10.1371/journal.pbio.3000629 |
| 8 | Duan Y, Zeng L, Zheng C, Song B, Li F, Kong X, Xu K: Inflammatory links between high fat diets and
diseases. Front Immunol 2018;9:2649.
https://doi.org/10.3389/fimmu.2018.02649 |
| 9 | WHO. Obesity and overweight [Internet]. Geneva: World Health Organization; 2024 [cited 2024 Jul
10]. Available from: https://www.who.int/news-room/fact-sheets/detail/obesity-and-overweight.
|
| 10 | Younossi Z, Anstee QM, Marietti M, Hardy T, Henry L, Eslam M, George J, Bugianesi E: Global burden
of NAFLD and NASH: trends, predictions, risk factors and prevention. Nat Rev Gastroenterol Hepatol
2018;15:11-20.
https://doi.org/10.1038/nrgastro.2017.109 |
| 11 | Rinella ME: Examining the Nomenclature Change from NAFLD and NASH to MASLD and MASH. Gastroenterol
Hepatol (NY) 2023;19:697.
|
| 12 | Adams LA, Lymp JF, Sauver JS, Sanderson SO, Lindor KD, Feldstein A, Angulo P: The natural history
of nonalcoholic fatty liver disease: a population-based cohort study. Gastroenterology
2005;129:113-121.
https://doi.org/10.1053/j.gastro.2005.04.014 |
| 13 | Lonardo A, Mantovani A, Lugari S, Targher G: Epidemiology and pathophysiology of the association
between NAFLD and metabolically healthy or metabolically unhealthy obesity. Ann Hepatol
2020;19:359-366.
https://doi.org/10.1016/j.aohep.2020.03.001 |
| 14 | Chalasani N, Younossi Z, Lavine JE, Charlton M, Cusi K, Rinella M, Harrison SA, Brunt EM, Sanyal
AJ: The diagnosis and management of nonalcoholic fatty liver disease: practice guidance from the
American Association for the Study of Liver Diseases. Hepatology 2018;67:328-357.
https://doi.org/10.1002/hep.29367 |
| 15 | Arab JP, Arrese M, Trauner M: Recent insights into the pathogenesis of nonalcoholic fatty liver
disease. Annu Rev Pathol: Mech Dis 2018;13:321-350.
https://doi.org/10.1146/annurev-pathol-020117-043617 |
| 16 | Caputo T, Gilardi F, Desvergne B: From chronic overnutrition to metaflammation and insulin
resistance: adipose tissue and liver contributions. FEBS Lett 2017;591:3061-3088.
https://doi.org/10.1002/1873-3468.12742 |
| 17 | Ipsen DH, Lykkesfeldt J, Tveden-Nyborg P: Molecular mechanisms of hepatic lipid accumulation in
non-alcoholic fatty liver disease. Cell Mol Life Sci 2018;75:3313-3327.
https://doi.org/10.1007/s00018-018-2860-6 |
| 18 | Cordeiro A, Costa R, Andrade N, Silva C, Canabrava N, Pena MJ, Rodrigues I, Andrade S, Ramalho A:
Does adipose tissue inflammation drive the development of non-alcoholic fatty liver disease in
obesity? Clin Res Hepatol Gastroenterol 2020;44:394-402.
https://doi.org/10.1016/j.clinre.2019.10.001 |
| 19 | Donnelly KL, Smith CI, Schwarzenberg SJ, Jessurun J, Boldt MD, Parks EJ: Sources of fatty acids
stored in liver and secreted via lipoproteins in patients with nonalcoholic fatty liver disease. J
Clin Invest 2005;115:1343-1351.
https://doi.org/10.1172/JCI200523621 |
| 20 | Tobari M, Hashimoto E, Taniai M, Ikarashi Y, Kodama K, Kogiso T, Tokushige K, Takayoshi N,
Hashimoto N: Characteristics of non‐alcoholic steatohepatitis among lean patients in Japan: not
uncommon and not always benign. J Gastroenterol Hepatol Invest 2019;34:1404-1410.
https://doi.org/10.1111/jgh.14585 |
| 21 | Feldman A, Eder SK, Felder TK, Kedenko L, Paulweber B, Stadlmayr A, Huber-Schönauer U, Niederseer
D, Stickel F, Auer S: Clinical and metabolic characterization of lean Caucasian subjects with
non-alcoholic fatty liver. Am J Gastroenterol 2017;112:102-110.
https://doi.org/10.1038/ajg.2016.318 |
| 22 | Shi Y, Wang Q, Sun Y, Zhao X, Kong Y, Ou X, Jia J, Wu S, You H: The prevalence of lean/nonobese
nonalcoholic fatty liver disease: a systematic review and meta-analysis. J Clin Gastroenterol
2020;54:378-387.
https://doi.org/10.1097/MCG.0000000000001270 |
| 23 | Omagari K, Suzuta M, Taniguchi A, Kumamoto R, Koyama Y, Fukuda A, Suruga K, Ichimura-Shimizu M,
Tsuneyama K: A non-obese, diet-induced animal model of nonalcoholic steatohepatitis in Wistar/ST
rats compared to Sprague-Dawley rats. Clin Nutr Exp 2020;30:1-14.
https://doi.org/10.1016/j.yclnex.2020.03.001 |
| 24 | Gauthier M-S, Favier R, Lavoie J-M: Time course of the development of non-alcoholic hepatic
steatosis in response to high-fat diet-induced obesity in rats. Br J Nutr 2006;95:273-281.
https://doi.org/10.1079/BJN20051635 |
| 25 | Nam M, Choi M-S, Jung S, Jung Y, Choi J-Y, Hwang G-S: Lipidomic profiling of liver tissue from
obesity-prone and obesity-resistant mice fed a high fat diet. Sci Rep 2015;5:1-11.
https://doi.org/10.1038/srep16984 |
| 26 | Xia S-F, Duan X-M, Cheng X-R, Chen L-M, Kang Y-J, Wang P, Tang X, Shi Y-H, Le G-W: Role of miR-383
and miR-146b in different propensities to obesity in male mice. J Endocrinol 2017;234:201-216.
https://doi.org/10.1530/JOE-17-0044 |
| 27 | Zatterale F, Longo M, Naderi J, Raciti GA, Desiderio A, Miele C, Beguinot F: Chronic adipose
tissue inflammation linking obesity to insulin resistance and type 2 diabetes. Front Physiol
2020;10:1607.
https://doi.org/10.3389/fphys.2019.01607 |
| 28 | Ferron AJT, Jacobsen BB, Sant'Ana PG, de Campos DHS, de Tomasi LC, Luvizotto RdAM, Cicogna AC,
Leopoldo AS, Lima-Leopoldo AP: Cardiac dysfunction induced by obesity is not related to β-adrenergic
system impairment at the receptor-signalling pathway. PLoS One 2015;10:e0138605.
https://doi.org/10.1371/journal.pone.0138605 |
| 29 | Lima-Leopoldo AP, Leopoldo AS, da Silva DC, do Nascimento AF, de Campos DH, Luvizotto RA, de Deus
AF, Freire PP, Medeiros A, Okoshi K: Long-term obesity promotes alterations in diastolic function
induced by reduction of phospholamban phosphorylation at serine-16 without affecting calcium
handling. J Appl Physiol 2014;117:669-678.
https://doi.org/10.1152/japplphysiol.00088.2014 |
| 30 | Cordeiro J, da Silva V, Campos D, Cicogna A, Leopoldo A, Lima-Leopoldo A: Isolated obesity
resistance condition or associated with aerobic exercise training does not promote cardiac
impairment. Brazilian Journal of Medical and Biological Research 2021;54:e10669.
https://doi.org/10.1590/1414-431x2020e10669 |
| 31 | Matthews DR, Hosker JP, Rudenski AS, Naylor B, Treacher DF, Turner R: Homeostasis model
assessment: insulin resistance and β-cell function from fasting plasma glucose and insulin
concentrations in man. Diabetologia 1985;28:412-419.
https://doi.org/10.1007/BF00280883 |
| 32 | Favoretto S, Seabra D, Olivato M: Guia de eutanásia para animais de ensino e pesquisa. UNIFESP:
São Paulo, Brazil 2013:29-30.
|
| 33 | Koch C, Lowe C, Pretz D, Steger J, Williams L, Tups A: High‐fat diet induces leptin resistance in
leptin‐deficient mice. J Neuroendocrinol 2014;26:58-67.
https://doi.org/10.1111/jne.12131 |
| 34 | Kim C-H, Youn JH, Park J-Y, Hong SK, Park KS, Park SW, Suh KI, Lee K-U: Effects of high-fat diet
and exercise training on intracellular glucose metabolism in rats. Am J Physiol Endocrinol Metab
2000;278:E977-E984.
https://doi.org/10.1152/ajpendo.2000.278.6.E977 |
| 35 | Gibert-Ramos A, Palacios-Jordan H, Salvadó MJ, Crescenti A: Consumption of out-of-season orange
modulates fat accumulation, morphology and gene expression in the adipose tissue of Fischer 344
rats. Eur J Nutr 2020;59:621-631.
https://doi.org/10.1007/s00394-019-01930-9 |
| 36 | Cordeiro J, Silva D, Torezani-Sales S, Madureira A, Claudio E, Bocalini D, Lima-Leopoldo A,
Leopoldo A: Resistance to obesity prevents obesity development without increasing spontaneous
physical activity and not directly related to greater metabolic and oxidative capacity. Plos one
2022;17:e0271592.
https://doi.org/10.1371/journal.pone.0271592 |
| 37 | Liang W, Menke AL, Driessen A, Koek GH, Lindeman JH, Stoop R, Havekes LM, Kleemann R, van den Hoek
AM: Establishment of a general NAFLD scoring system for rodent models and comparison to human liver
pathology. PloS one 2014;9:e115922.
https://doi.org/10.1371/journal.pone.0115922 |
| 38 | Lírio LM, Forechi L, Zanardo TC, Batista HM, Meira EF, Nogueira BV, Mill JG, Baldo MP: Chronic
fructose intake accelerates non-alcoholic fatty liver disease in the presence of essential
hypertension. J Diabetes Complicat 2016;30:85-92.
https://doi.org/10.1016/j.jdiacomp.2015.10.008 |
| 39 | Levin BE, Hogan S, Sullivan A: Initiation and perpetuation of obesity and obesity resistance in
rats. Am J Physiol Regul Integr Comp Physiol 1989;256:R766-R771.
https://doi.org/10.1152/ajpregu.1989.256.3.R766 |
| 40 | Cordeiro J, da Silva V, Campos D, Cicogna A, Leopoldo A, Lima-Leopoldo A: Isolated obesity
resistance condition or associated with aerobic exercise training does not promote cardiac
impairment. Braz J Med Biol Res 2021;54
https://doi.org/10.1590/1414-431x2020e10669 |
| 41 | Akieda-Asai S, Koda S, Sugiyama M, Hasegawa K, Furuya M, Miyazato M, Date Y: Metabolic features of
rats resistant to a high-fat diet. Obes Res Clin Pract 2013;7:e243-e250.
https://doi.org/10.1016/j.orcp.2013.01.004 |
| 42 | Jackman MR, MacLean PS, Bessesen DH: Energy expenditure in obesity-prone and obesity-resistant
rats before and after the introduction of a high-fat diet. Am J Physiol Regul Integr Comp Physiol
2010;299:R1097-R1105.
https://doi.org/10.1152/ajpregu.00549.2009 |
| 43 | Nascimento PA, Monte-Alto-Costa A: Both obesity-prone and obesity-resistant rats present delayed
cutaneous wound healing. Br J Nutr 2011;106:603-611.
https://doi.org/10.1017/S0007114511000468 |
| 44 | Pinheiro-Castro N, Silva LBAR, Novaes GM, Ong TP: Hypercaloric diet-induced obesity and
obesity-related metabolic disorders in experimental models. Adv Exp Med Biol 2019:149-161.
https://doi.org/10.1007/978-3-030-12668-1_8 |
| 45 | Bastías-Pérez M, Serra D, Herrero L: Dietary options for rodents in the study of obesity.
Nutrients 2020;12:3234.
https://doi.org/10.3390/nu12113234 |
| 46 | Preguiça I, Alves A, Nunes S, Fernandes R, Gomes P, Viana SD, Reis F: Diet‐induced rodent models
of obesity‐related metabolic disorders:A guide to a translational perspective. Obes Rev
2020;21:e13081.
https://doi.org/10.1111/obr.13081 |
| 47 | Akieda-Asai S, Koda S, Sugiyama M, Hasegawa K, Furuya M, Miyazato M, Date Y: Metabolic features of
rats resistant to a high-fat diet. Obes Res Clin Pract 2013;7:e243-250.
https://doi.org/10.1016/j.orcp.2013.01.004 |
| 48 | Wang X, Choi JW, Joo JI, Kim DH, Oh TS, Choi DK, Yun JW: Differential expression of liver proteins
between obesity-prone and obesity-resistant rats in response to a high-fat diet. Br J Nutr
2011;106:612-626.
https://doi.org/10.1017/S0007114511000651 |
| 49 | Wang J, Alexander JT, Zheng P, Yu HJ, Dourmashkin J, Leibowitz SF: Behavioral and endocrine traits
of obesity-prone and obesity-resistant rats on macronutrient diets. Am J Physiol
1998;274:E1057-1066.
https://doi.org/10.1152/ajpendo.1998.274.6.E1057 |
| 50 | Collins KH, Paul HA, Reimer RA, Seerattan RA, Hart DA, Herzog W: Relationship between
inflammation, the gut microbiota, and metabolic osteoarthritis development: studies in a rat model.
Osteoarthritis Cartilage 2015;23:1989-1998.
https://doi.org/10.1016/j.joca.2015.03.014 |
| 51 | Lu Y, Li Y, Sun Y, Ma S, Zhang K, Tang X, Chen A: Differences in energy metabolism and
mitochondrial redox status account for the differences in propensity for developing obesity in rats
fed on high-fat diet. Food Sci Nutr 2021;9:1603-1613.
https://doi.org/10.1002/fsn3.2134 |
| 52 | Farley C, Cook JA, Spar BD, Austin TM, Kowalski TJ: Meal pattern analysis of diet‐induced obesity
in susceptible and resistant rats. Obes Res 2003;11:845-851.
https://doi.org/10.1038/oby.2003.116 |
| 53 | Pan WW, Myers MG: Leptin and the maintenance of elevated body weight. Nat Rev Neurosci
2018;19:95-105.
https://doi.org/10.1038/nrn.2017.168 |
| 54 | Cluny NL, Eller LK, Keenan CM, Reimer RA, Sharkey KA: Interactive effects of oligofructose and
obesity predisposition on gut hormones and microbiota in diet-induced obese rats. Obesity
2015;23:769-778.
https://doi.org/10.1002/oby.21017 |
| 55 | Reilly SM, Saltiel AR: Adapting to obesity with adipose tissue inflammation. Nat Rev Endocrinol
2017;13:633-643.
https://doi.org/10.1038/nrendo.2017.90 |
| 56 | Scarpace PJ, Zhang Y: Leptin resistance: a prediposing factor for diet-induced obesity. Am J
Physiol Regul Integr Comp Physiol 2009;296:R493-R500.
https://doi.org/10.1152/ajpregu.90669.2008 |
| 57 | Henry BA: Innate obesity, revealed by selection markers, confers significant imprint of
hypothalamic genes controlling energy expenditure. Neuroendocrinology 2017;104:319-329.
https://doi.org/10.1159/000455232 |
| 58 | Sun H, Yan J, Sun B, Song L, Yan J: Taste sensitivity to sucrose is lower in outbred
Sprague-Dawley phenotypic obesity-prone rats than obesity-resistant rats. Biochem Biophys Res Commun
2017;489:155-163.
https://doi.org/10.1016/j.bbrc.2017.05.117 |
| 59 | Boustany CM, Bharadwaj K, Daugherty A, Brown DR, Randall DC, Cassis LA: Activation of the systemic
and adipose renin-angiotensin system in rats with diet-induced obesity and hypertension. Am J
Physiol Regul Integr Comp Physiol 2004;287:R943-949.
https://doi.org/10.1152/ajpregu.00265.2004 |
| 60 | Jackman MR, MacLean PS, Bessesen DH: Energy expenditure in obesity-prone and obesity-resistant
rats before and after the introduction of a high-fat diet. Am J Physiol Regul Integr Comp Physiol
2010;299:R1097-1105.
https://doi.org/10.1152/ajpregu.00549.2009 |
| 61 | Shimobayashi M, Albert V, Woelnerhanssen B, Frei IC, Weissenberger D, Meyer-Gerspach AC, Clement
N, Moes S, Colombi M, Meier JA: Insulin resistance causes inflammation in adipose tissue. J Clin
Invest 2018;128:1538-1550.
https://doi.org/10.1172/JCI96139 |
| 62 | Myers MG, Cowley MA, Münzberg H: Mechanisms of leptin action and leptin resistance. Annu Rev
Physiol 2008;70:537-556.
https://doi.org/10.1146/annurev.physiol.70.113006.100707 |
| 63 | Zhang Y, Proenca R, Maffei M, Barone M, Leopold L, Friedman JM: Positional cloning of the mouse
obese gene and its human homologue. Nature 1994;372:425-432.
https://doi.org/10.1038/372425a0 |
| 64 | Scherer PE, Williams S, Fogliano M, Baldini G, Lodish HF: A novel serum protein similar to C1q,
produced exclusively in adipocytes. J Biol Chem 1995;270:26746-26749.
https://doi.org/10.1074/jbc.270.45.26746 |
| 65 | Flatt J-P: Use and storage of carbohydrate and fat. Am J Clin Nutr 1995;61:952S-959S.
https://doi.org/10.1093/ajcn/61.4.952S |
| 66 | Zhou Y-J, Xu N, Zhang X-C, Zhu Y-Y, Liu S-W, Chang Y-N: Chrysin Improves Glucose and Lipid
Metabolism Disorders by Regulating the AMPK/PI3K/AKT Signaling Pathway in Insulin-Resistant HepG2
Cells and HFD/STZ-Induced C57BL/6J Mice. J Agric Food Chem 2021
https://doi.org/10.1021/acs.jafc.1c01109 |
| 67 | Abdul-Ghani M, DeFronzo RA: Insulin resistance and hyperinsulinemia: the egg and the chicken. J
Clin Endocrinol Metab 2021;106:1897-1899.
https://doi.org/10.1210/clinem/dgaa364 |
| 68 | Herman R, Kravos NA, Jensterle M, Janež A, Dolžan V: Metformin and insulin resistance: a review of
the underlying mechanisms behind changes in GLUT4-mediated glucose transport. Int J Mol Sci
2022;23:1264.
https://doi.org/10.3390/ijms23031264 |
| 69 | Flock MR, Kris-Etherton PM: Diverse physiological effects of long-chain saturated fatty acids:
implications for cardiovascular disease. Curr Opin Clin Nutr Metab Care 2013;16:133-140.
https://doi.org/10.1097/MCO.0b013e328359e6ac |
| 70 | Grundy SM: Cholesterol and coronary heart disease: a new era. Jama 1986;256:2849-2858.
https://doi.org/10.1001/jama.1986.03380200087027 |
| 71 | Siri-Tarino PW, Sun Q, Hu FB, Krauss RM: Saturated fatty acids and risk of coronary heart disease:
modulation by replacement nutrients. Curr Atheroscler Rep 2010;12:384-390.
https://doi.org/10.1007/s11883-010-0131-6 |
| 72 | Parks EJ, Hellerstein MK: Carbohydrate-induced hypertriacylglycerolemia: historical perspective
and review of biological mechanisms. Am J Clin Nutr 2000;71:412-433.
https://doi.org/10.1093/ajcn/71.2.412 |
| 73 | Arner P: The adipocyte in insulin resistance: key molecules and the impact of the
thiazolidinediones. Trends Endocrinol Metab 2003;14:137-145.
https://doi.org/10.1016/S1043-2760(03)00024-9 |
| 74 | Capurso C, Capurso A: From excess adiposity to insulin resistance: the role of free fatty acids.
Vascular pharmacology 2012;57:91-97.
https://doi.org/10.1016/j.vph.2012.05.003 |
| 75 | Terrien J, Seugnet I, Seffou B, Herrero MJ, Bowers J, Chamas L, Decherf S, Duvernois-Berthet E,
Djediat C, Ducos B: Reduced central and peripheral inflammatory responses and increased
mitochondrial activity contribute to diet-induced obesity resistance in WSB/EiJ mice. Sci Rep
2019;9:19696.
https://doi.org/10.1038/s41598-019-56051-4 |
| 76 | Zelová H, Hošek J: TNF-α signalling and inflammation: interactions between old acquaintances.
Inflamm Res 2013;62:641-651.
https://doi.org/10.1007/s00011-013-0633-0 |
| 77 | Engin A: The pathogenesis of obesity-associated adipose tissue inflammation. Adv Exp Med Biol
2017:221-245.
https://doi.org/10.1007/978-3-319-48382-5_9 |
| 78 | Cranford TL, Enos RT, Velázquez KT, McClellan JL, Davis JM, Singh UP, Nagarkatti M, Nagarkatti PS,
Robinson CM, Murphy EA: Role of MCP-1 on inflammatory processes and metabolic dysfunction following
high-fat feedings in the FVB/N strain. Int J Obes 2016;40:844-851.
https://doi.org/10.1038/ijo.2015.244 |
| 79 | Ghaben AL, Scherer PE: Adipogenesis and metabolic health. Nat Rev Mol Cell Biol 2019;20:242-258.
https://doi.org/10.1038/s41580-018-0093-z |
| 80 | Virtue S, Vidal-Puig A: Adipose tissue expandability, lipotoxicity and the metabolic syndrome-an
allostatic perspective. Biochim Biophys Acta: Mol Cell Biol L 2010;1801:338-349.
https://doi.org/10.1016/j.bbalip.2009.12.006 |
| 81 | Asghar A, Sheikh N: Role of immune cells in obesity induced low grade inflammation and insulin
resistance. Cell Immunol 2017;315:18-26.
https://doi.org/10.1016/j.cellimm.2017.03.001 |
| 82 | Hariri N, Thibault L: High-fat diet-induced obesity in animal models. Nutr Res Rev
2010;23:270-299.
https://doi.org/10.1017/S0954422410000168 |
| 83 | Cohen P, Spiegelman BM: Cell biology of fat storage. Mol Biol Cell 2016;27:2523-2527.
https://doi.org/10.1091/mbc.e15-10-0749 |
| 84 | Kahn BB, Flier JS: Obesity and insulin resistance. J Clin Invest 2000;106:473-481.
https://doi.org/10.1172/JCI10842 |
| 85 | Haczeyni F, Bell‐Anderson KS, Farrell G: Causes and mechanisms of adipocyte enlargement and
adipose expansion. Obes Rev 2018;19:406-420.
https://doi.org/10.1111/obr.12646 |
| 86 | El-Agroudy NN, Kurzbach A, Rodionov RN, O'Sullivan J, Roden M, Birkenfeld AL, Pesta DH: Are
Lifestyle Therapies Effective for NAFLD Treatment? Trends Endocrinol Metab 2019;30:701-709.
https://doi.org/10.1016/j.tem.2019.07.013 |
| 87 | Polyzos SA, Kountouras J, Mantzoros CS: Adipokines in nonalcoholic fatty liver disease. Metabolism
2016;65:1062-1079.
https://doi.org/10.1016/j.metabol.2015.11.006 |
| 88 | Houghton D, Thoma C, Hallsworth K, Cassidy S, Hardy T, Burt AD, Tiniakos D, Hollingsworth KG,
Taylor R, Day CP: Exercise reduces liver lipids and visceral adiposity in patients with nonalcoholic
steatohepatitis in a randomized controlled trial. Clin Gastroenterol Hepatol 2017;15:96-102. e103.
https://doi.org/10.1016/j.cgh.2016.07.031 |