Co-Immobilization of Trypsin and Lysine -α- Oxidase For the Quantification of Lysine in Casein Hydrolysate. Evaluation with a Biosensor
bDepartamento de Internado Rotativo. Facultad de Ciencias de la Salud. Universidad Técnica de Manabí, Portoviejo, Ecuador,
cCarrera de Ingenieria Industrial. Facultad de Ingeniería y Ciencias Aplicadas. Universidad Técnica de Manabí, Portoviejo- Ecuador,
dDepartamento de Procesos Agroindustriales. Facultad de Agrociencias. Universidad Técnica de Manabí, Ecuador,
eCarrera de Gastronomia. Universidad Laica Eloy Alfaro de Manabí. Extension Sucre,
fDepartamento de Química Facultad de Ciencias Básicas, Universidad Técnica de Manabí, Portoviejo, Ecuador,
gDepartamento de Procesos Químicos, Alimentos y Biotecnología. Facultad de Ingeniería y Ciencias Aplicadas. Universidad Técnica de Manabí, Portoviejo, Ecuador,
hDepartamento de Ciencias Médicas. Facultad de Ciencias de la Salud. Universidad Técnica de Manabí. Portoviejo, Ecuador
Keywords
Abstract
Background/Aims:
The quantification of amino acids in the dairy industry is necessary for quality control and for the formulation of functional foods. Thus, the development of enzymatic biosensors requires a detailed study of enzyme kinetics. Parameters such as KM and Vmax are necessary to optimize the sensitivity and specificity of the biosensor.Methods:
The enzyme immobilized on nylon and yucca bipolymer membranes was studied to evaluate possible interferences in the amperometric sensor.Results:
The sensor developed based on enzyme kinetics proved to be a reliable, sensitive, and low-cost alternative for determining lysine in dairy products. Its performance, comparable to HPLC, together with its low environmental impact, positions it as a useful tool for quality control in the food industry.Conclusion:
An enzymatic biosensor capable of quickly, accurately, and economically quantifying lysine in casein hydrolysates was developed. Its high sensitivity, enzymatic stability, and low environmental impact make it a viable and comparable alternative to HPLC for quality control in dairy products.Introduction
Proteolytic enzymes account for 20% of industrial enzymes sold worldwide. They have different fields of application, such as enzymatic peptide synthesis, genetic engineering, proteomic analysis, and cell cultures. (Mótyán et al. 2013; Tavano et al, 2018; Reichard et al, 2018). Useful databases such as MEROPS have been developed, integrating data on the type of substrates and industrial characteristics of more than 4, 000 proteolytic enzymes, thus establishing the need to continue this line of research to fill the gaps in our knowledge of the structure and function of these proteases (Uliana et al, 2021).
There is a need to study the kinetics and specificity of these enzymes in order to find practical uses for proteases. Therefore, it is necessary to develop an analytical approach that allows the activity of enzymes towards a substrate to be used as a means of quantifying analytes of interest. An example of this is the use of lactate oxidase to quantify lactic acid in wines. (Jadán et al, 2025). In the food industry, their action has been positively proven, for example on the tenderness of meat, as well as in the production of cheese as a coagulant (Mohd et al, 2023; Nicosia et al. 2022).
In the industrial production of enzymes, there are processes that can influence their activity. For example, during the extraction stages, when the crude extract is separated from the other organic components, enzymatic activity can be affected by the use of membranes. In a second stage, extraction is complemented by rapid freezing and thawing to break down cell walls and facilitate separation. Finally, purification is carried out using techniques that take into account the physical and chemical properties of the enzymes, separating the components that affect their activity (Ghobadi et al., 2012). For this reason, it is necessary to characterize the properties of enzymes before testing them in dynamic systems such as biosensors.
Specifically, trypsin is used in the food industry to improve the digestibility of infant foods, reduce allergies (it hydrolyzes casein), and generally improve nutrient assimilation (Mao et al., 2018; Kong et al., 2023). It usually comes from mammalian pancreatic tissue due to low levels of recombinant trypsin expression (Niu et al, 2024). It specifically hydrolyzes the carboxyl end of positively charged amino acids, breaking down protein molecules into smaller peptides (Kaur et al, 2020).
Trypsin acts by cleaving the peptide bond at the C-terminal end of lysine and arginine, but not proline, thus avoiding the limitations of trypsin cleavage for substrates with different primary structures (Slechtova et al, 2015).
There are several methods for analyzing enzyme activity, for example, mass spectrometry (Hu et al., 2015), optical methods (Cheng et al., 2013; Chang et al., 2019), and electrochemical methods (Abuknesha et al., 2010; Shin et al., 2012; Suhito et al., 2021). This method has recently attracted considerable interest due to its ease of use, high sensitivity, and portability. Most electrochemical systems (as in the present work) are based on the decrease (signal deactivation) of the electrochemical signal as a result of substrate proteolysis (Ong, 2017). According to this model, enzymes immobilized on the surface of the electrodes are used, whose activity gives rise to changes in the electrochemical signal recorded in a transducer. This allows the redox label to be eliminated, thus avoiding the reduction of the electrochemical activity of the system (Kang et al., 2009; 42 Puiu, 2018). Therefore, it is important to develop label-free biosensors for the analysis of enzymatic activity.In this context, the use of a biosensor that uses trypsin and lysine alpha oxidase as a biorecognition element may be useful for the food industry, as it facilitates the control of this compound during production.
The detection mechanism is based on the consumption of oxygen (dissolved in water) which is directly proportional to the substrate of interest (casein hydrolysate), forming smaller peptides and a free amino group, this is illustrated in the following diagram:
$$ \text{Casein} + \text{H}_2\text{O} \text{ Trypsin} \longrightarrow \text{Small peptides} + \text{Amino acids} \hspace{50px} \text{(eq. 1)} $$ $$ \text{Lysine} + \text{O}_2 \text{ Lysine-α-oxidase} \longrightarrow \text{α-Keto-ԑ-aminocaproate}+\text{H}_2\text{O}_2+ \text{NH}_3 \hspace{50px} \text{(eq. 2)} $$ The detection mechanism for lysine is shown in Fig 1.
Therefore, the main objective of this study was to develop a new analytical method capable of hydrolyzing and quantifying casein and lysine in a single step, reducing time and costs. This was achieved through the action of enzymes (TLP and LOx) immobilized in duality on a membrane, which allow the hydrolysis and biorecognition of the compounds of interest. The membrane is incorporated into the sensor, thus allowing monitoring during the reaction.
Materials and Methods
Chemicals and materials
Lysine oxidase (LOx, E.C.1.4.3.14 from Trichoderma viride,
each vial containing 4.6 mg of protein, with 20-60 units/mg of protein) and bovine pancreas
trypsin - Type I (lyophilized powder with an activity of ≥ 200 units per vial) were
supplied by Sigma (Sigma-Aldrich, St Louis, MO, USA). Glutaraldehyde (50%) and HPLC-grade
sulfuric acid were supplied by Merck (Merck KGaA, Darmstadt, Germany).The preactivated
immunodyne ABC membrane (Nylon 6, 6 pore size 0.45 um) was supplied by Pall Europe (Porsmounth,
UK). Sodium phosphate, anhydrous sodium acetate was obteined from Panreac (Panreac Química,
Barcelona, Spain). Milli-Q deionized water was used throughout.
Preparation of the LOx Solution
The enzyme was prepared by dissolving it in 10 mL
of 5 mM buffer solution at pH 6.5 with an activity 10.5 U/mL aliquoted in 0.5mL Eppendorf tubes
and frozen stored at -20ºC until use.
Preparation of the Trypsin Solution
The enzyme was prepared by dissolving it in 15
mL of 5 mM pH 7.6 buffer solution with an activity of 12, 000 units/mg of protein. It was
distributed in aliquots in Eppendorf tubes and stored frozen at -20°C.
Equipment
A Dual Digital Model 20 amperometric sensor (Rank Brothers, Bottisham,
Cambridge, England) using Nylon membranes and a cassava-based biopolymer was used, the latter
was elaborated as described by Anchundia et al, 2025. It consists of two electrodes, one working
and one reference, the reference electrode is formed by a silver ring (Ag/AgCl), while the
working electrode is formed by a platinum disk, which detects the oxygen consumption during the
enzymatic reaction (eq.1). These electrodes are connected to a transducer that amplifies the
signal so that the information is recorded and analyzed in a terminal
(computer).
Chromatographic analysis was performed using YL9100 equipment manufactured by
Lin Instrument CO, LTD (Korea).
Sample
Due to the composition of the milk, the soluble salts had to be separated
from the casein. To achieve the separation of the non-sedimentable casein from these salts, the
milk had to be ultra centrifuged at 100, 000 x g, 15 ° C, for 90 min using the Beckman
Coulter centrifuge (GmbH) and stored at -20ºC.
Biosensor preparation and operation
For the reaction to occur in the sensor it is
necessary to adjust the electrical current of the circuit (-600mV) which must be closed by
placing a few drops of KCl on the electrode and wait for it to stabilize. The sensitivity of the
sensor is then adjusted by saturating the reaction cell with 100% oxygen. From this value it is
possible to quantify the oxygen consumed during the reaction, this value was proportional to the
casein concentration. The identification process takes less than 5 seconds. The method of
operation of the sensor was previously described by Jadán et al, 2019.
The reaction
cell was maintained at the optimum enzyme temperature (37ºC) by recirculating the water,
previously heated with a thermostat.
Immobilized enzyme sensor
The appropriate percentage of glutaraldehyde
required to immobilize the two enzymes on the nylon membrane was studied, and these
concentrations ranged between 0.5% and 3% for both enzymes. The membrane has proven to be stable
and effective (Anchundia et al, 2025). Thus, a total mixture of 100 µL of solution was
prepared using 60 µL of 5 mM sodium phosphate buffer, pH 7.6, with 10 µ of 2%
glutaraldehyde and 30 µL of trypsin solution with lysine-α-oxidase in a ratio of 1:3.
This content was poured drop by drop onto the 1 cm2 nylon membrane and left to dry for 1
hour.
After this time, to avoid possible interference with food matrices, 5 µL of 2%
cellulose acetate was added after drying (Qiong et al., 1998).
Description of the Chromatographic Method
The analysis to quantify lysine in dairy
product extracts and model systems was performed after derivatization with o-phthalaldehyde
(OPA). A Rezex ROA-Organic Acid H+ thermostatic column (8µm x 300 x 7.8 mm) was used at
40°C, with sulfuric acid at a concentration of 0.02 N. The sample volume used was 20
µL, was diluted using sulfuric acid with a flow rate of 1mL/min in the mobile phase.
Fluorescence detection used excitation and emission wavelengths of 230 nm and 450 nm,
respectively.
Two solvents were used for the gradient: 20mM sodium acetate buffer, pH 7.2
(solvent A), and 100mM sodium acetate, pH 7.2/acetonitrile/methanol (30:35:35) v/v as solvent B.
The gradient was linear from 0 to 60% of solvent B in 10 min. The mobile phase was bubble-free
by degassing and filtration. The linear range used to quantify lysine was between 0.01 and 0.05
mM.
Use of the Enzymatic Sensor to Analyze Dairy Samples
To analyze lysine in
pasteurized whole milk, the sample was taken from the local industry. The method was validated
and its results were compared with HPLC.
Validation
Reproducibility was established by injecting 0.05 mM standard lysine or
consecutive samples of dairy products 30 times into the immobilized enzyme system on the same
day, using the same equipment and under the same conditions. The stability of the membrane
stored at 4°C was evaluated.
Linearity was achieved through triplicate analysis of
standards ranging from 0.01 and 0.05 mM for the immobilized enzyme system using the Ordinary
Least Squares (OLS) regression method. The dilution of the sample was 1/22 to obtain a strong
signal, avoiding interference.
To determine the membrane’s stability under
operational conditions, successive injections of 0.01 mM lysine were applied to a single
membrane, and the response was recorded until 50% of its initial activity was observed. The
results were expressed as function of time. The correlation, using different concentrations,
between the sensor and HPLC were compared.
Statistical method. The monitoring of
increasing lysine concentrations was performed using Statgraphics Plus software (v5.1). And by
means of the coefficient of determination (R2) as well as the standard error (SE) the
linearity of the data between the sensor and the HPLC was obtained. A two-sample t-test
(two-tailed) is used to determine if the HPLC and biosensor are statistically equivalent. The
null hypothesis states that the population means are the same (H0: µ sensor = µ HPLC)
while the alternative hypothesis states that the means are not equal (H0: H0: µ sensor
≠ µ HPLC).
Results
Biosensor
During the reaction of the enzyme (LOx) with the substrate, lysine is
reduced, causing the consumption of the oxygen present. This reaction is possible due to the
hydrolysis of casein by the prior action of trypsin, producing an accumulation of oxygen which
was detected by the sensor electrode and was directly proportional to the concentration of
lysine in the sample (whole milk) (equation 1). To this end, it was necessary to evaluate the
specificity, selectivity, and accuracy for quantifying lysine, as well as the different working
potentials, pH, and temperature at which the enzyme showed its highest activity. It was observed
that the least interference in the response occurred at 5 seconds with a potential of -0.6 mV,
eliminating the noise emitted.
The biorecognition signal originated at the platinum base
(1.5 mm in diameter), where oxygen consumption was detected during lysine reduction, so that the
signal was finally amplified (Fig. 1).
The coefficients of variation (CV) for casein
hydrolysate from whole milk and standards, from consecutive injections, were 1.15% and 0.7%,
respectively, indicating good sensor performance.
The pH range for LOx was between 4.6 and
8.6 using sodium phosphate (0.05 M). The optimal pH was 7.6. The temperature was checked and set
at 37 °C. All these parameters were set for the following analyses.
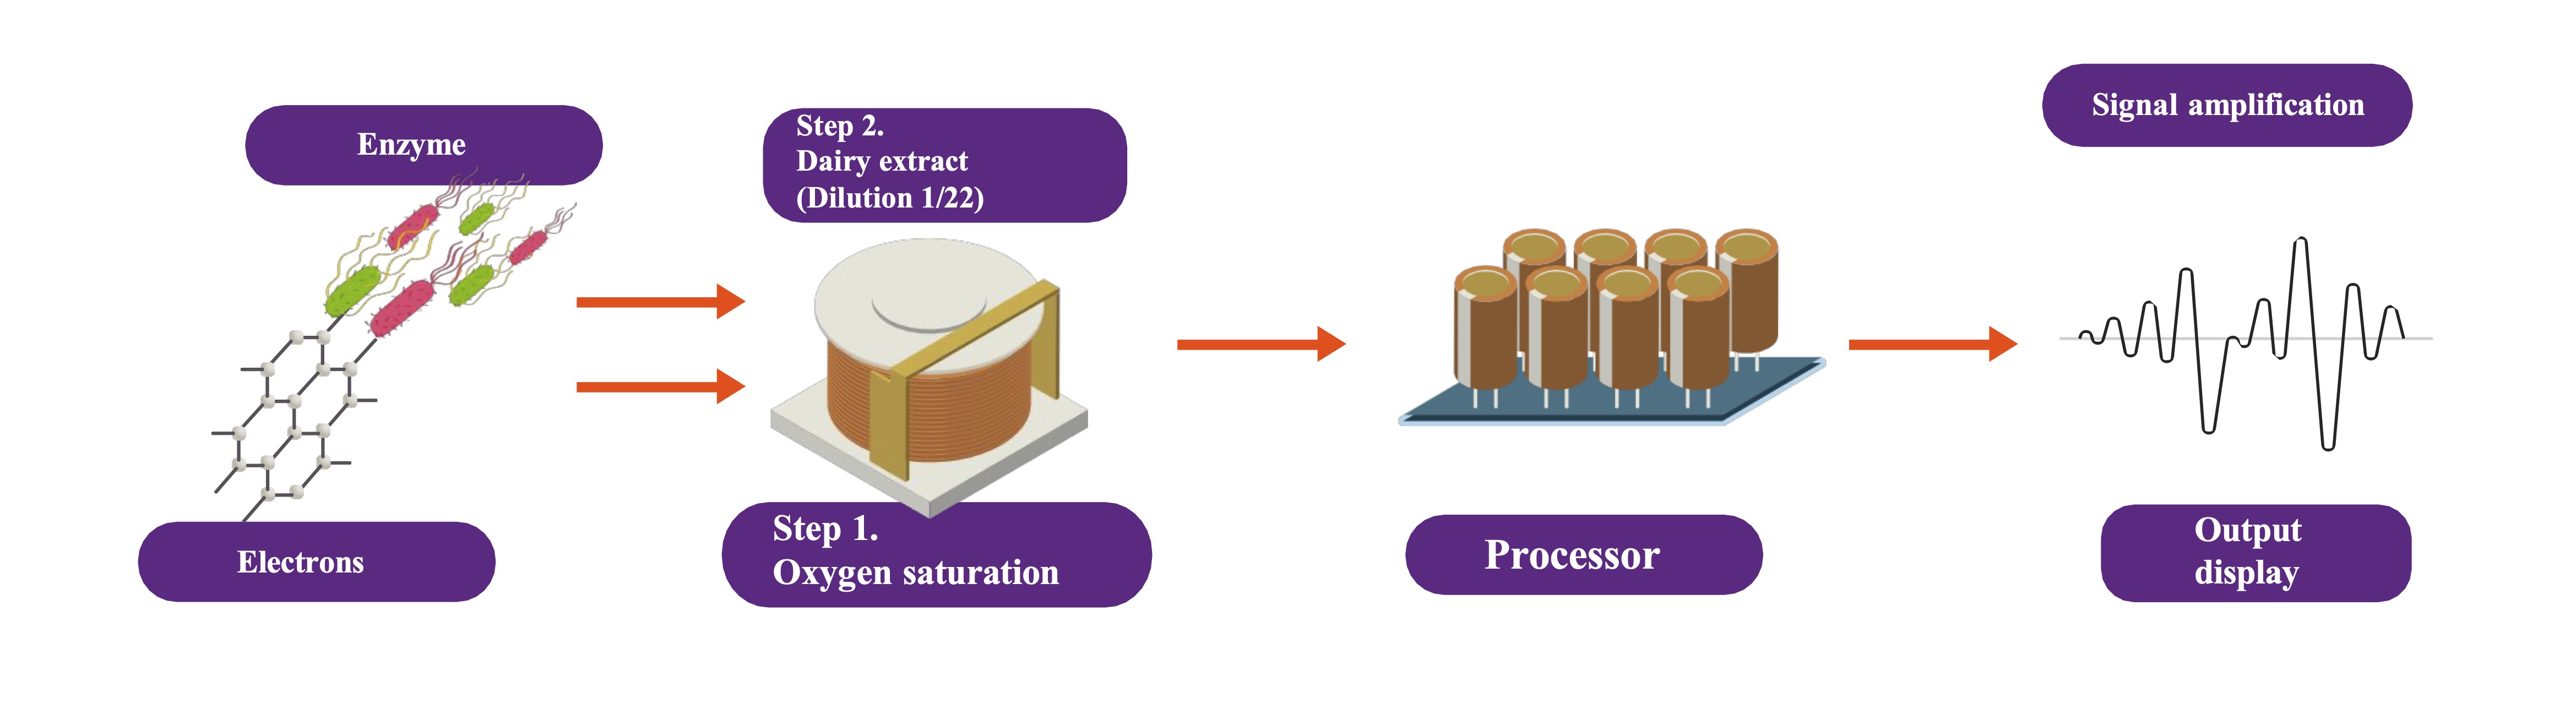
Fig. 1: Schematic representation of key principle of developing a biosensor.
Biosensor features
To calculate the maximum velocity (Vmax), different
concentrations of the substrate (lysine) were prepared in ascending order. It was observed that
the substrate concentration is directly proportional to the reaction rate up to 0.25 mM. Above
this concentration, the rate began to show an asymptotic trend, possibly due to saturation of
the enzyme’s active site. Thus, the maximum rate was established at 0.0032 mg O2
x L/sec-1 (Fig. 2). Using this relationship and the Hanes-Woolf
graph, the Michaelis-Menten constant (KM) was determined for trypsin, whose value
indicates a high affinity for the casein substrate (KM = 2.1 x 10⁻⁴ mM).
For alpha oxidase lysine, it was 0.37 mM. The graph was constructed using the following
equation:
$$ \left( \frac{s}{v} \right) = \frac{K_M}{v_{\text{max}+1}} + v_{\text{max}}(s) \hspace{50px} \text{(eq.
3)}$$
Where S represents the substrate concentration, v is the
reaction rate, Vmax is the maximum rate, and KM is the Michaelis-Menten constant.
The study
was also carried out with the immobilized enzyme. When the nylon membrane was used, its activity
was reduced by 15%, while when the cassava biopolymer was used, the enzymatic activity only
decreased by 11%. This difference was not significant when determining the time for lysine
detection (5 seconds). This could be due to the covalent bond that occurs during immobilization
and the position that the enzyme adopts when binding to different surfaces. These factors can
lead to imperfect binding or a higher number of anchors per cm2. In the case of
cassava-based biopolymer, its structure formed by repeated monomers (amylose and amylopectin)
allows for a sufficient number of anchors, which increases enzyme activity. In both cases, it
was possible to use small amounts of enzyme (30 µL), making the sensor viable. This trend
has been observed in previous studies by Jadán et al., 2023.
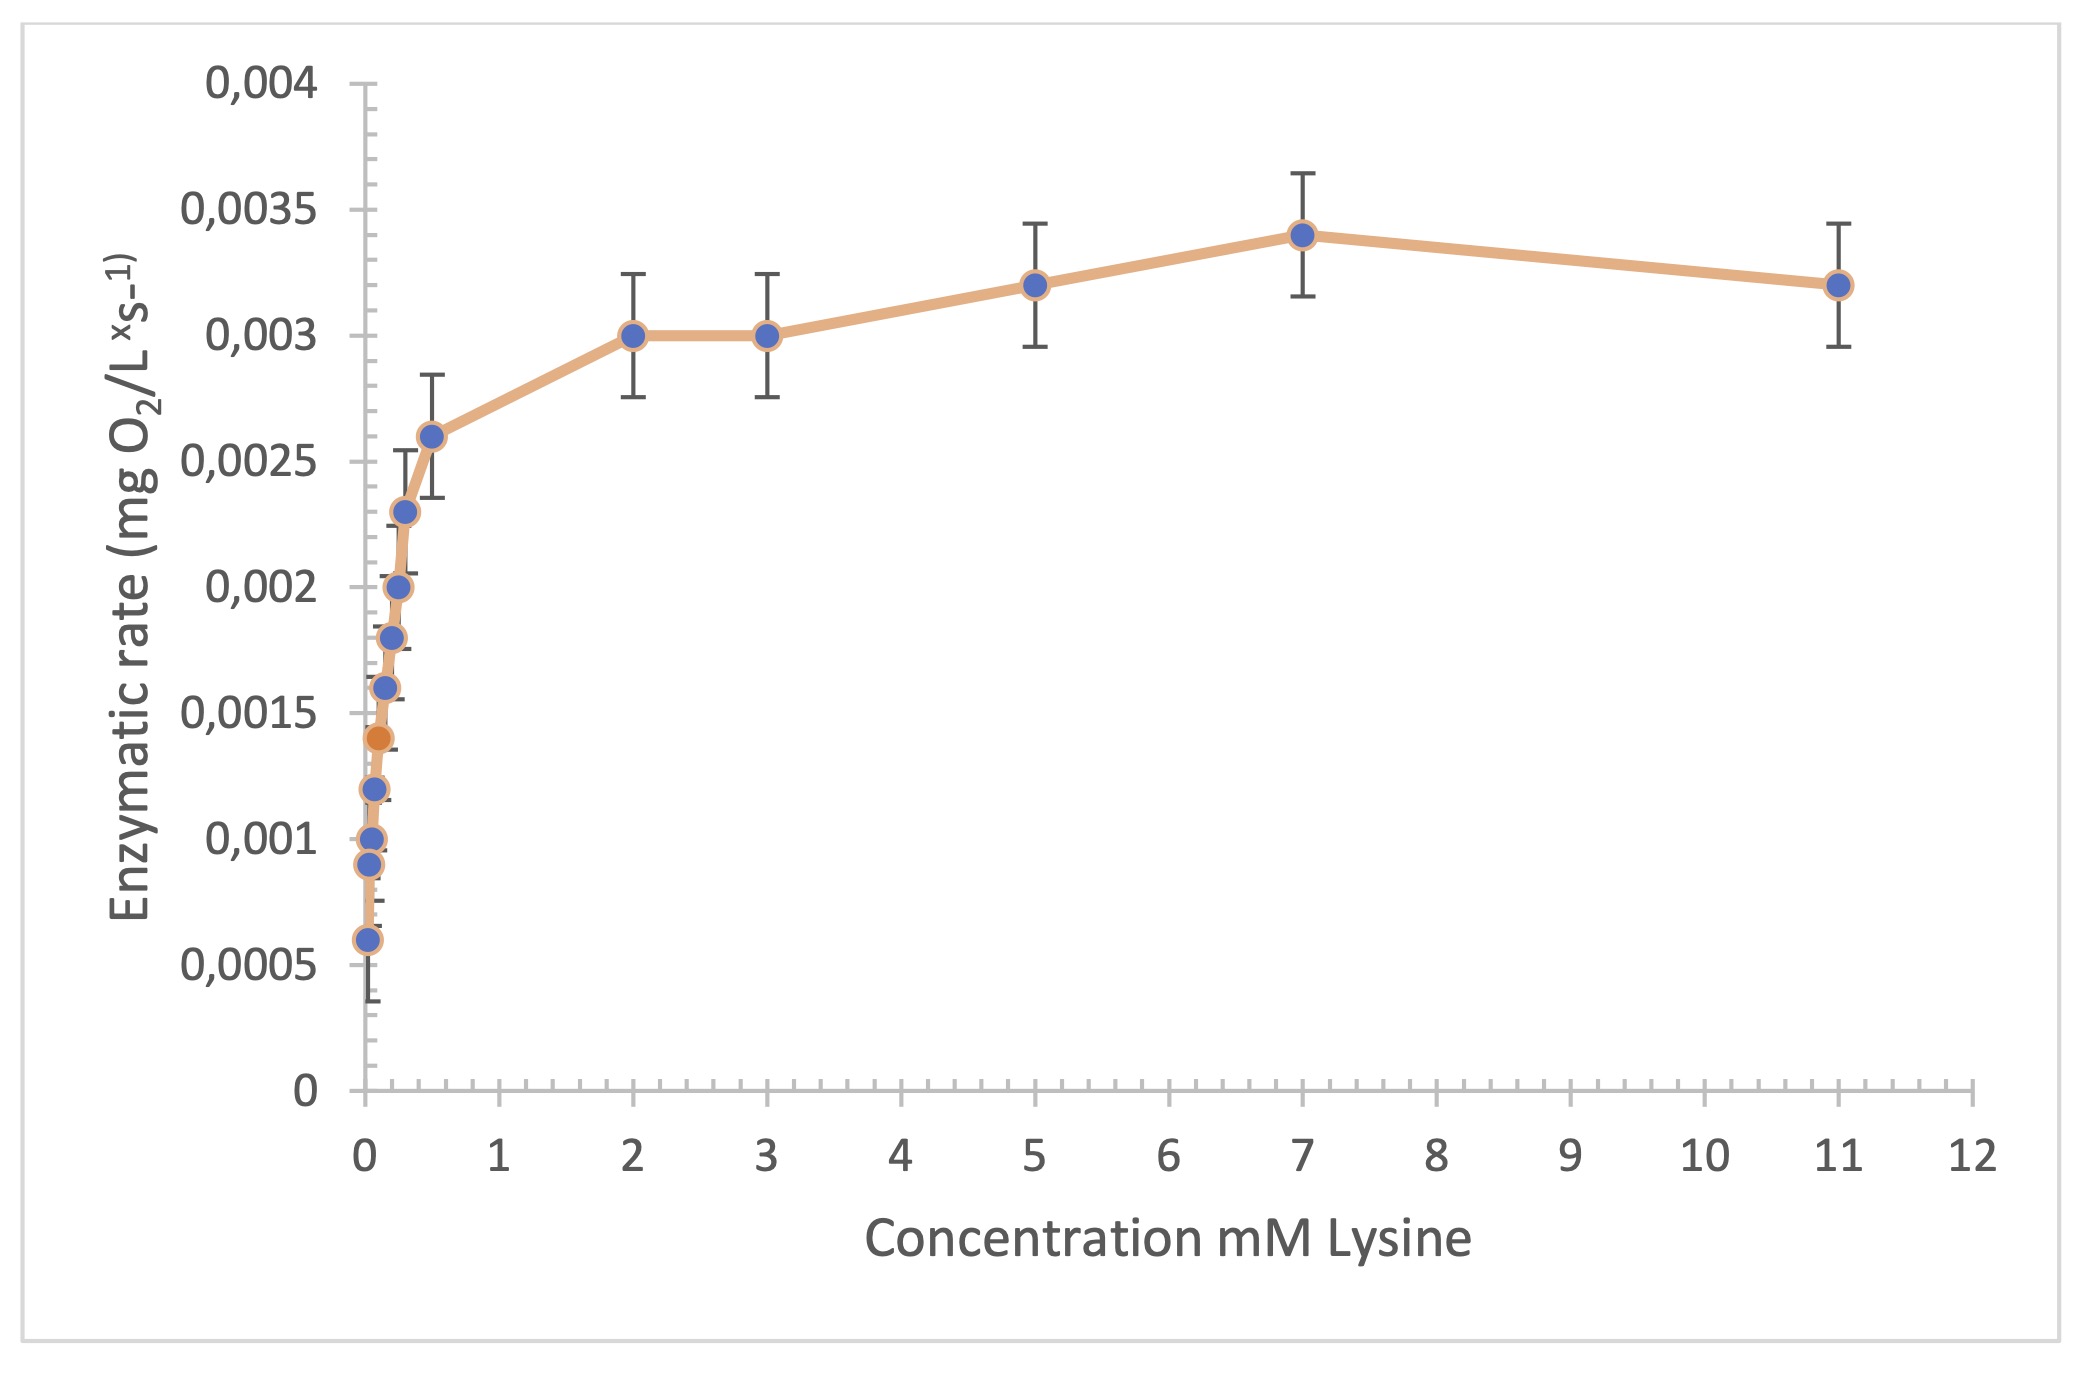
Fig. 2: Study of the maximum velocity of the LOx enzyme by increasing the substrate Concentration (n=3).
Calibration curves
To ensure the robustness and reliability of the biosensor
developed, validation parameters were established in accordance with international standards
such as ICH Q2 (R1).
In the case of the linear range using the membrane with the cassava
biopolymer it was between 0.01 and 0.05 mM. The points mentioned remained linear, reaching an
R2 = 0.9917, with an acceptable degree of accuracy. The linear fit is considered
optimal when the value exceeds R2 = 0.9. The equivalent in mM of the detection limit
is 0.0015 g/L (Fig. 3a). The LOD was estimated as three times the standard deviation of the
target response divided by the slope of the calibration curve (LOD=3 σ/S). The limit of
quantification (LOQ) was established as ten times this deviation (LOQ=10 σ /S). For the
biosensor with a cassava biopolymer membrane, an LOD of 0.0015 mM and a LOQ of 0.005 mM were
obtained, demonstrating high sensitivity in the detection of lysine in casein hydrolysates. When
the nylon membrane was used, the linear range was between 0.1 and 0.5 mM, with a higher limit of
quantification in milk samples (Fig. 3b).
For intraday precision (repeatability) of the
system, casein standards (0.01 mM and 0.05 mM) were injected consecutively (25 times) within the
same day, and the milk extracts were analyzed in the same way using a new membrane for each
measurement. The performance of the equipment remained constant. The relative standard deviation
(RSD) obtained was ≤1.3%, confirming the validity of the response throughout the day. The
coefficients of variation (CV) ranged from 0.7% to 1.3% for the standards and samples,
respectively, maintaining high precision without loss of stability. The measurement range is
similar to that found in the literature (Gao et al, 2025).
Accuracy was verified through
recovery studies in which milk extracts were fortified with known concentrations of lysine
(0.01, 0.03, and 0.05 mM). Recovery rates ranged from 96.5% to 102.3%, confirming the absence of
significant matrix interference and the suitability of the method.
These parameters
consolidate the use of the sensor as a reliable, accurate, and sensitive tool for lysine
quantification, showing a statistically insignificant correlation with the HPLC method (p >
0.05) and a high coefficient of determination (R² > 0.99), confirming its applicability
in food matrices.
Various methods have been described for quantifying lysine in food due to
the biological importance of this amino acid. For example, in beef, tandem triple quadrupole
mass spectrometry has been developed (Luo et al., 2024). Probes for lysine detection using
fluorescence absorption and emission spectra applied to millet and soybean flour samples have
also been developed (Gao et al., 2025). Enzymatic sensors are used in reformulated meat products
(Cañarte et al., 2025). They also have applications in cheese (Ciriello et al., 2015). In
rice varieties and cereal seeds, lysine has been quantified using high-performance liquid
chromatography (HPLC) (Hayat et al., 2014). A method based on dye binding using Acid Orange 12
has also been described for quantifying lysine in skimmed milk powder (Aalaei et al.,
2016).
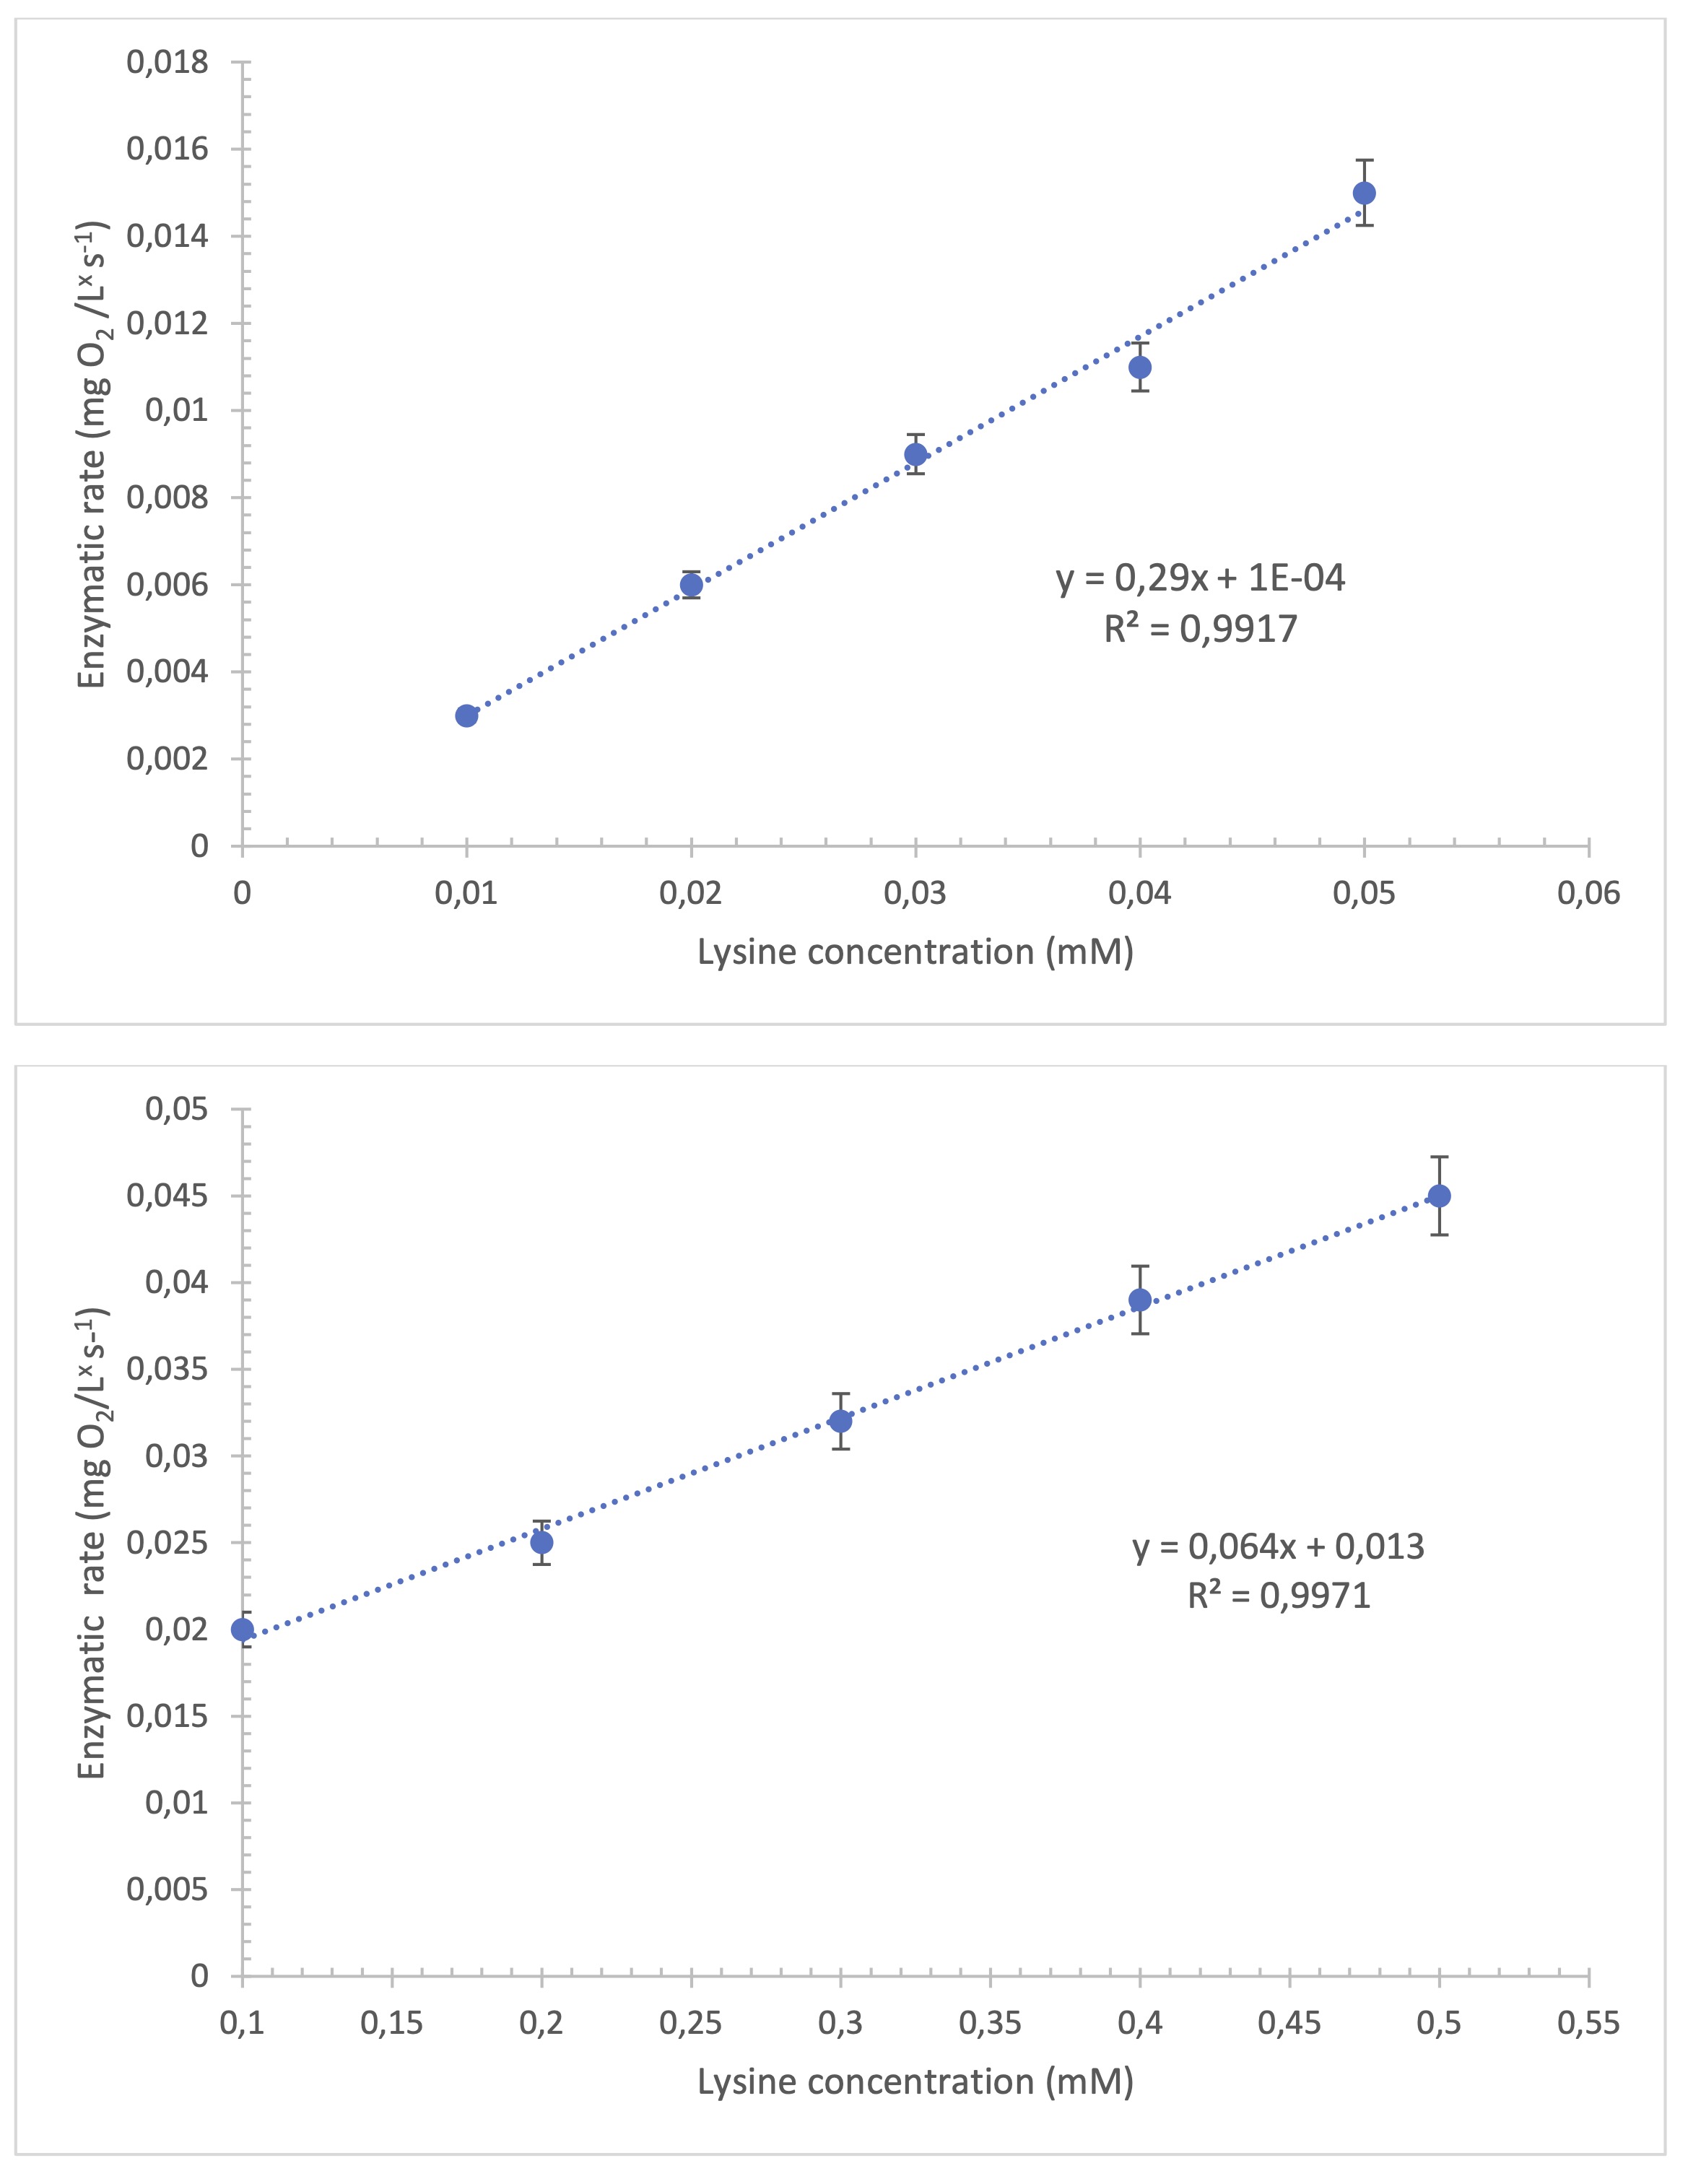
Fig. 3: Calibration curve using cassava biopolymer with the LOx biosensor at 37 °C in sodium phosphate-acetate buffer pH 7.6. (n=3). Fig 3b. Calibration curve obtained with the nylon membrane using the LOx biosensor at 37 °C in sodium phosphate-acetate buffer pH 7.6. (n=3).
Lysine measurements using the biosensor compared with HPLC measurements
The sensor
was prepared and designed to quantify the concentration of lysine present in whole milk casein
hydrolysate. To do this, it was necessary to evaluate the accuracy of the instrument using
diluted samples (5 points) and compare the values with those obtained by HPLC. The results
indicate a high correlation, with a coefficient of determination R2 = 0.9918 and a
standard error of 0.014 (Fig. 4).
At the same time, a t-test for two samples was performed to statistically evaluate the lysine
concentration (mM) determined by both the sensor method and HPLC with a significance level of
α = 0.05. The difference in lysine concentrations measured by the biosensor (Ẋ = 1.3
and s = 0.1214) and HPLC (Ẋ = 1.16 and s = 0.1203) was not significantly different:
t-value = 0.0653 (df = 30) and p-value = 0.0565. This was confirmed by comparing the
measurements of 25 samples between the sensor and HPLC (Table 1). Table 2 compares different
sensors for determining lysine. It can be seen that the materials used to manufacture them are
expensive and complex, which makes them difficult to implement. For this reason, the use of this
system proved ideal due to its rapid start-up and simple design, allowing high sensitivity
detection, rapid response, and ease of voltage variation. (-600mV).
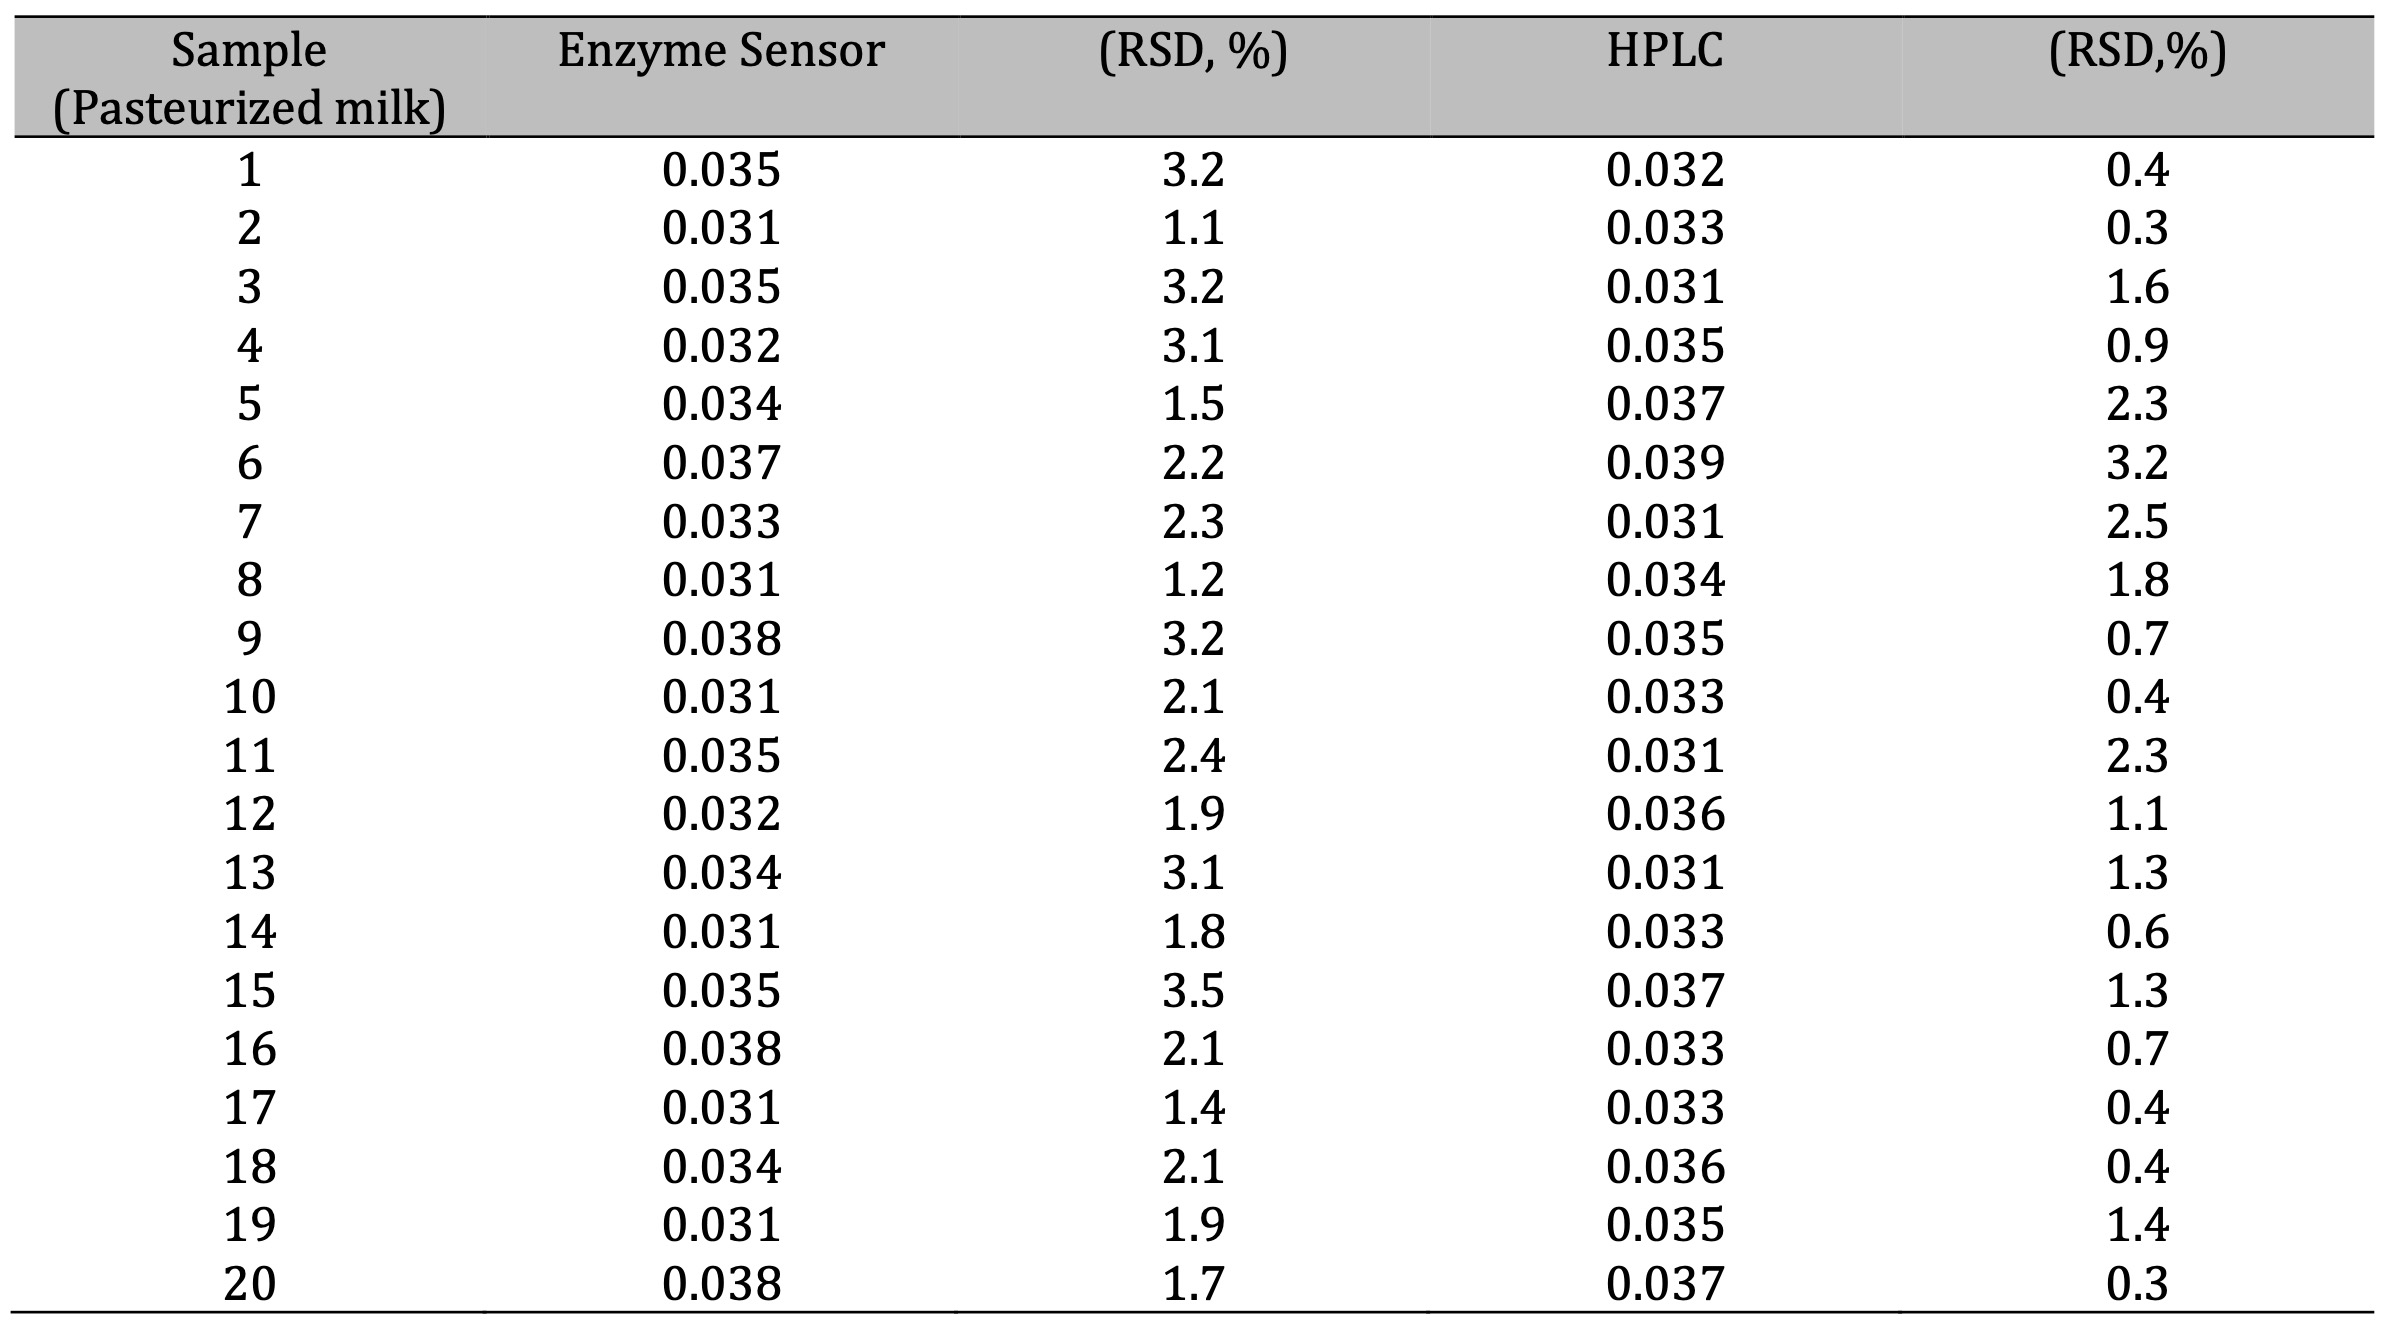
Table 1: Measurements lysine levels by the enzime sensor and High Performance Liquid Chromatography. Results are expressed in mM. (n=3)
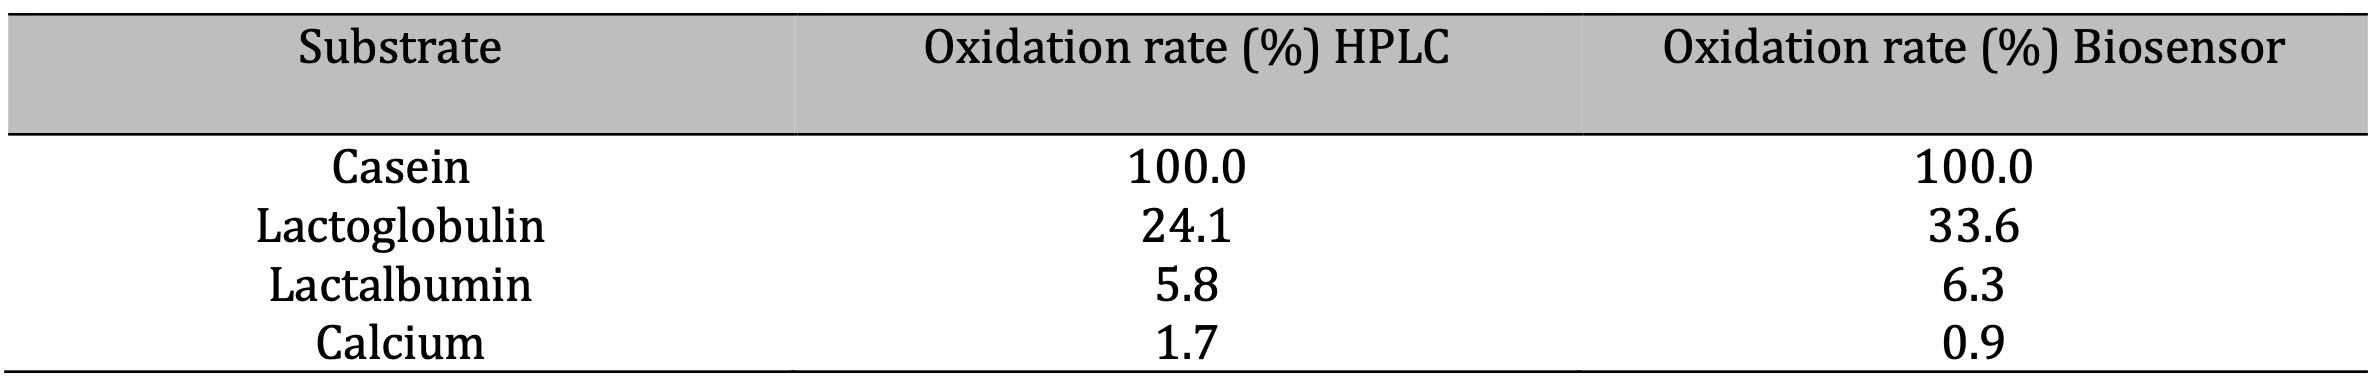
Table 2: Quantification limit
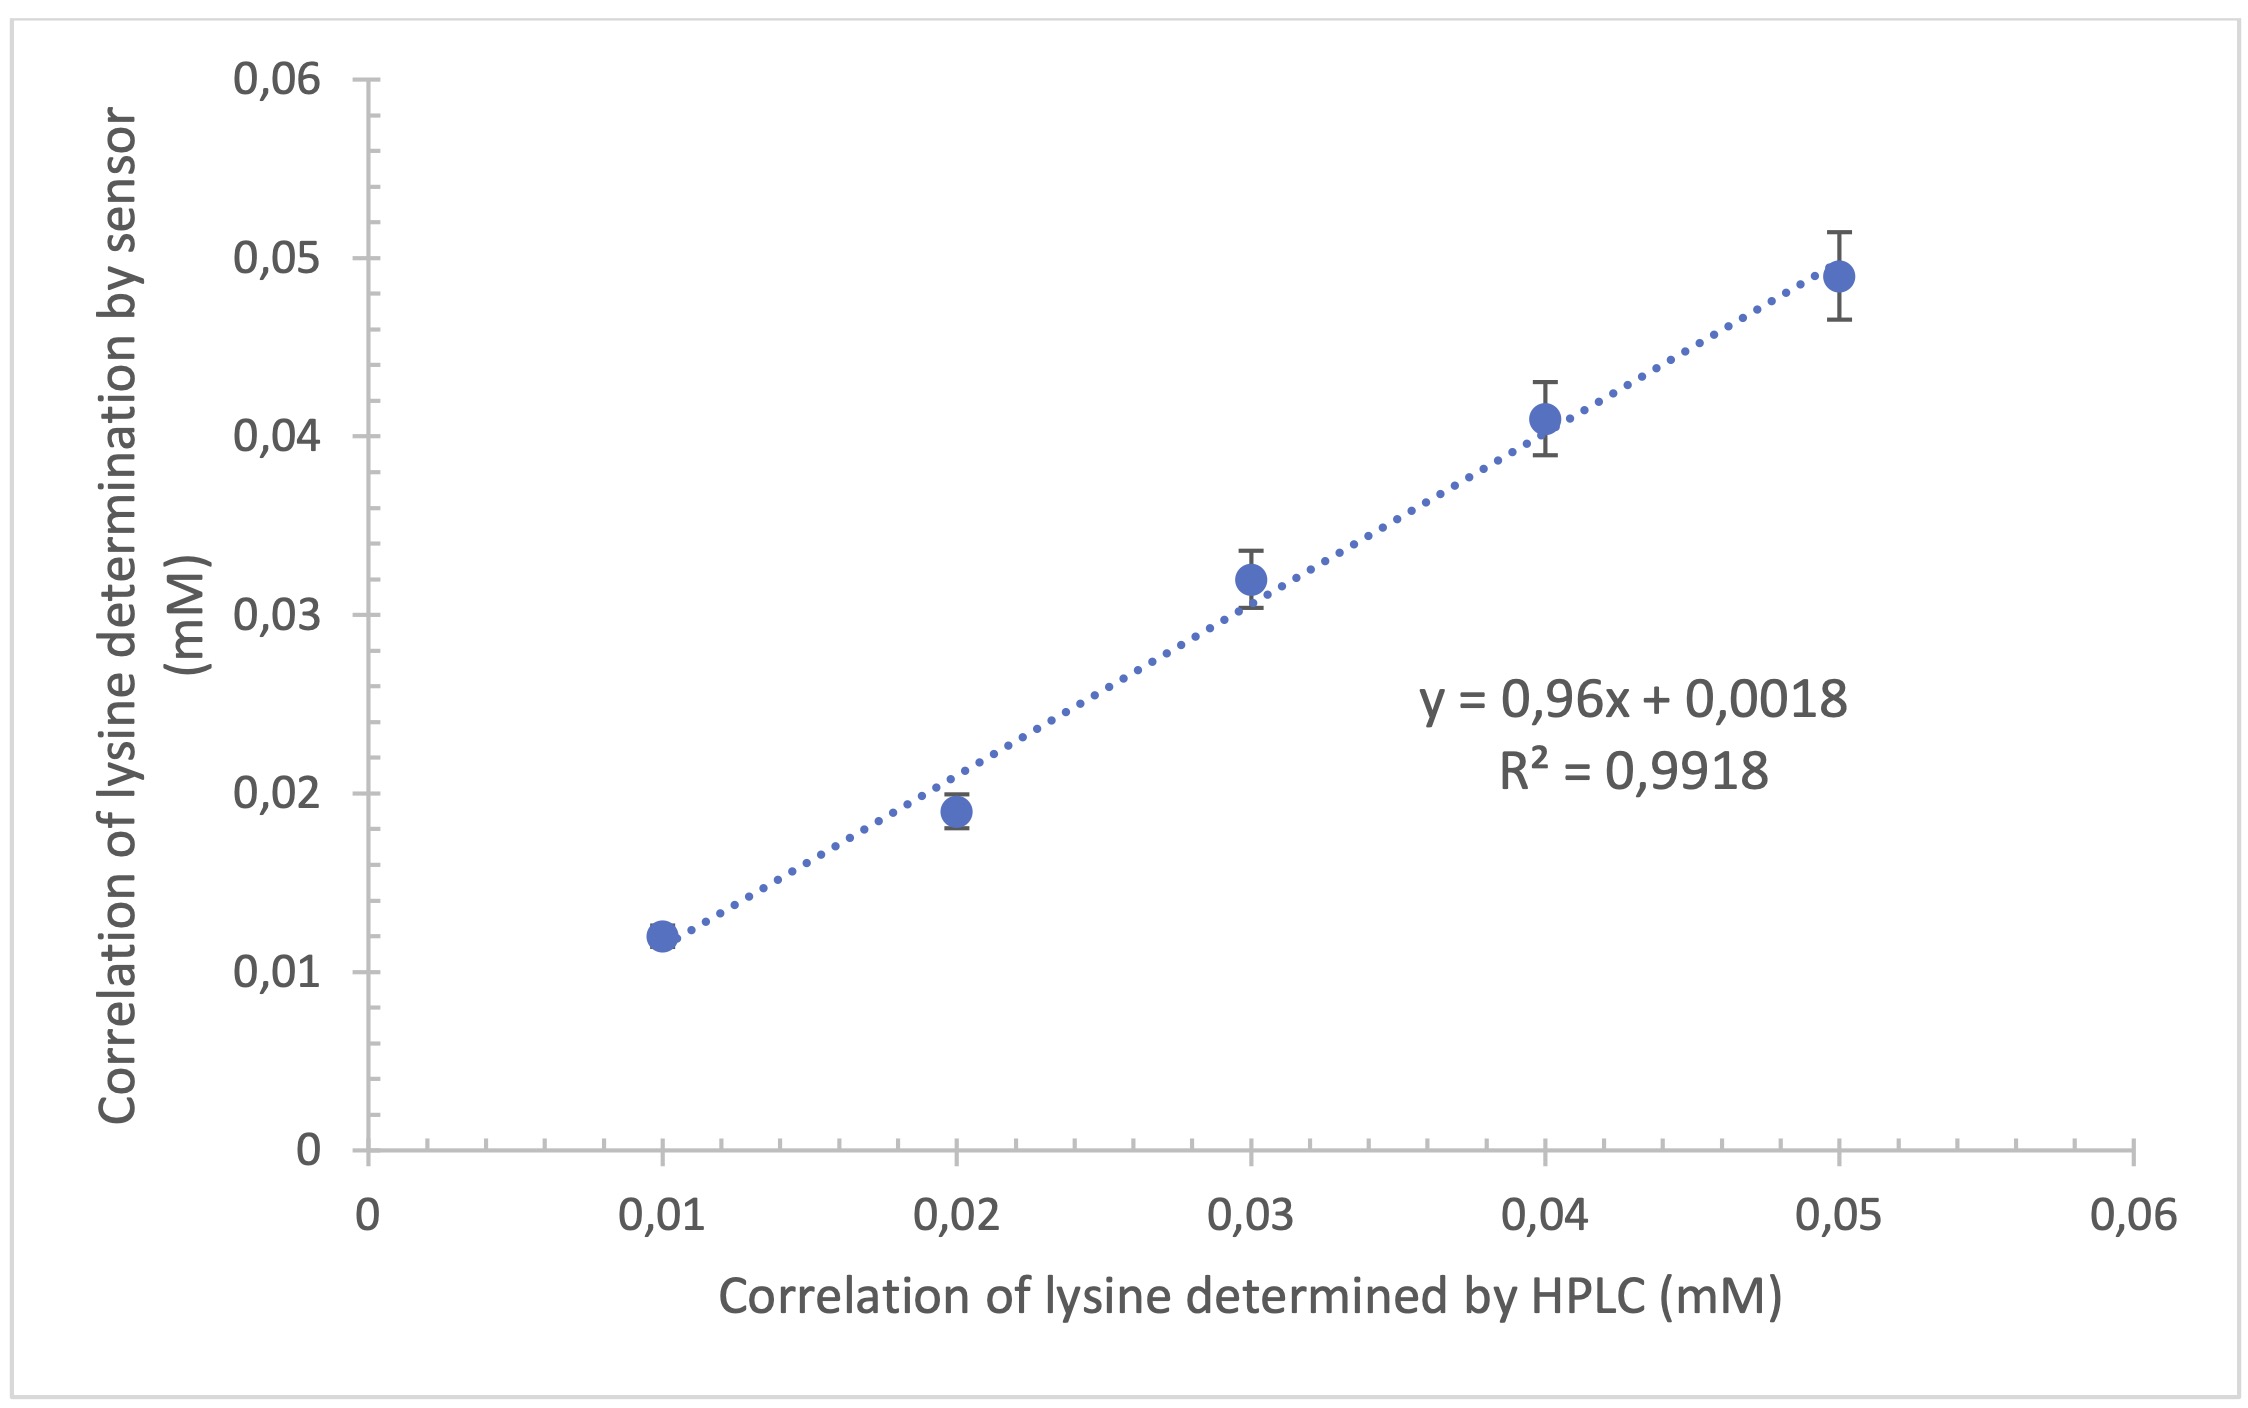
Fig. 4: Correlation between the content of lysine obtained with the enzyme sensor with the immobilized enzyme and High Performance Liquid Chromatography (n=3).
The stability of enzymes in storage
The stability of the trypsin enzyme immobilized on the nylon membrane was evaluated over a
period of 60 days at -4 °C. The test was carried out by placing the membranes on the sensor
electrode in order to study the long-term stability of the system constructed. It was observed
that the activity of the enzyme immobilized on the nylon membrane remained at 90% until the
first 35 days, allowing the membrane to be reused up to 10 times (Fig. 5). The decrease in
activity is possibly due to changes in the pH of the medium and/or the oxidation of essential
functional groups such as cysteines in enzymes with disulfide bridges. In the case of lysine
alpha oxidase, previous studies indicate that 90% of its initial activity is maintained for 10
days (Jadán et al., 2016).
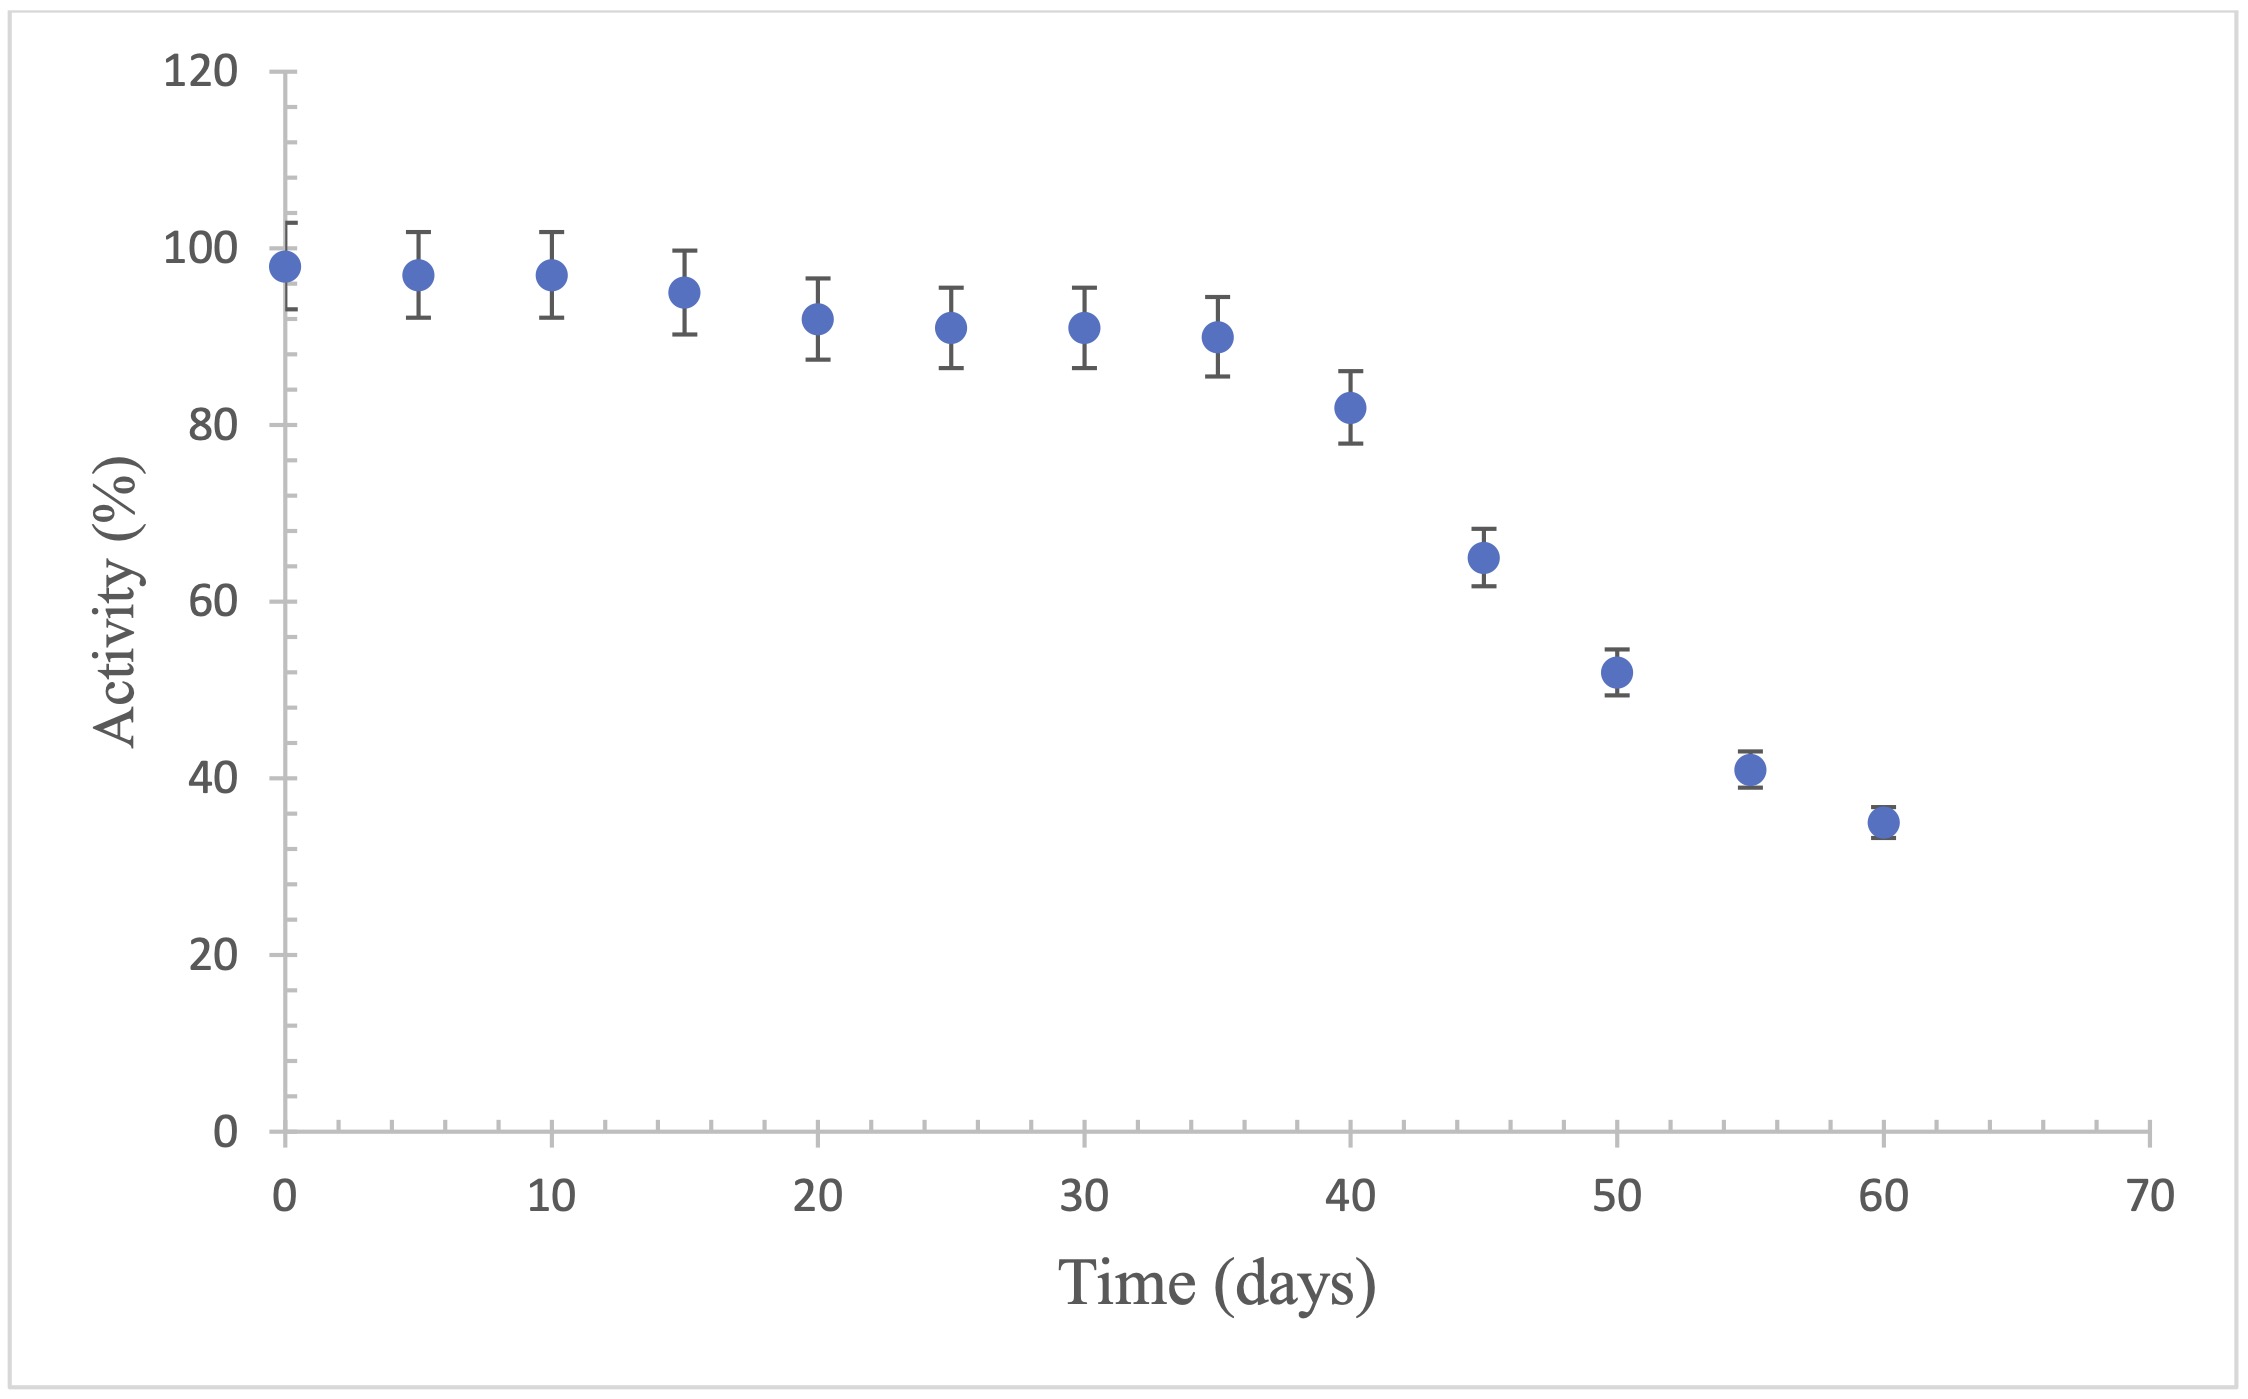
Fig. 5: Stability of trypsin in solution stored in refrigeration (4°C). n=3.
Matrix Effects and Interferences
A possible interference of compounds present in
casein hydrolysate, including individual amino acids such as histidine, tyrosine, phenylalanine,
arginine, and leucine, as well as the effect of fats (triglycerides), was evaluated using the
oxidation rate. It was observed that the least interference was caused by arginine, lysine, and
leucine, with oxidation rates of 92%, 89%, and 95%, respectively. Histidine reduced the
oxidation rate to 75%, showing moderate interference attributable to its imidazole group, which
can participate in undesirable redox reactions. Tyrosine and phenylalanine also showed moderate
interference (78% and 81%, respectively), probably due to their aromatic side chains, which can
interact with electrochemical detection systems. As for fats (milk triglycerides), they produced
a moderate reduction in the oxidation rate (80%), probably due to physical effects, such as the
formation of hydrophobic barriers that hinder trypsin access to the
substrate.
Discussion
Based on the results obtained, the biosensor demonstrated high analytical efficiency for the quantification of lysine in casein hydrolysates, with response times of less than 5 seconds. The co-immobilization of trypsin and lysine-α-oxidase on nylon and cassava biopolymer membranes allowed effective hydrolysis of the substrate and reliable amperometric detection. The KM obtained for lysine-α-oxidase (0.37 mM) showed high enzymatic affinity, while trypsin activity remained stable for 35 days, allowing the membrane to be reused up to 10 times without significant loss of activity.
Validation showed linearity (R² = 0.9917), precision (RSD ≤ 1.3%), and accuracy (recoveries between 96.5% and 102.3%), confirming the robustness of the system. The detection limit (0.0015 mM) and quantification limit (0.005 mM) were adequate for milk matrices. Comparison with HPLC showed no significant differences (p > 0.05), supporting its applicability as an alternative method.
The cassava biopolymer offered greater retention of enzymatic activity (89%), possibly due to its polysaccharide structure, which favors multiple anchorage points. Interference from amino acids such as histidine and tyrosine was moderate, without compromising specificity.
Overall, the sensor offers a sensitive, specific, economical, and low environmental impact alternative suitable for quality control in the food industry.
Conclusion
The method developed allowed low concentrations of lysine to be quantified at low cost and with minimal detection time. Trypsin showed approximate stability of 35 days, allowing the enzyme immobilized on the nylon membrane to be reused 10 times without loss of activity. The method had a low environmental impact due to the small amounts of reagents used. During the sensor‘s operating time, the enzyme studied showed high selectivity towards the substrate (KM=0.37 mM), so the synergism between the two enzymes allowed the amino acid of interest to be hydrolyzed and subsequently quantified. The results were comparable to HPLC.
Disclosure Statement
The authors declare that they have no known competing financial interests or personal relationships that could have appeared to influence the work reported in this paper.
References
| 1 | Aalaei, K; Rayner, M; Tareke, E; Sjoholm, I. 2016. Application of a dye-binding method for the
determination of available lysine in skim milk powders. Food Chemistry. Volume 196, 815-820.
https://doi.org/10.1016/j.foodchem.2015.10.004 |
| 2 | Abuknesha, R; Jeganathan, F; DeGroot, R; Wildeboer, D; Price, R. 2010. Detection of proteases
using an immunochemical method with haptenylated - gelatin as a solid -phase substrate. Analytical
Bioanalytical Chemistry. Volume 396, 2547-2558.
https://doi.org/10.1007/s00216-010-3540-z |
| 3 | Anchundia, L; Jadán, F; Macias, J; Sánchez, V; Vera, D; Giler, S; Gorozabel, W; Real, G; Loor, R;
Barzallo, O; Jadán, C. 2025. Effect of pH on the Physicochemical properties of a cassava peel starch
biopolymer. Cellular Physiology and Biochemistry. 59:21-23.
https://doi.org/10.33594/000000753 |
| 4 | Cañarte, E; Vergara, G; Intriago, F; Pérez, E; Falconi, M-A; Noriega, D; García, G; Díaz, L;
Anchundia, A; Jadán, C; Jadán F. 2025 Cereals as sources of lysine in the reformulation of meat
products. Evaluation using a biosensor. Biosensors and Bioelectronics: X. Volume 23, 100592.
https://doi.org/10.1016/j.biosx.2025.100592 |
| 5 | Ciriello, R; Cataldi, T; Crispo, F; Guerrieri, A. 2015. Quantification of L-Lysine in cheese by a
novel amperometric biosensor. Food Chemistry. Volume 169, 13-19.
https://doi.org/10.1016/j.foodchem.2014.07.141 |
| 6 | Chang, Ch; Chen, Ch; Wu, T; Yang, Ch; Lin, Ch; Chen, Ch-Y. 2019 Gold Nanoparticle-Based
Colorimetric Strategies for Chemical and Biological Sensing Applications. 2019. Gold
Nanoparticle-Based Colorimetric Strategies for Chemical and Biological Sensing Applications.
nanomaterials. 9(6),861.
https://doi.org/10.3390/nano9060861 |
| 7 | Chen, P; Selegard , R; Aili, D; Liedberg, B. 2013. Peptide functionalized gold nanoparticles for
colorimetric detection of matrilysin (MMP-7) activity. Nanoscale. Issue 19,
https://doi.org/10.1039/c3nr03006g |
| 8 | Fenelon, M; Guinee, T. 2000. Primary proteolysis and textural changes during ripening in Cheddar
cheeses manufactured to different fat contents. International Dairy Journal. Volume 10, Issue 3,
151-158.
https://doi.org/10.1016/S0958-6946(00)00040-6 |
| 9 | Gao, W; Su, J; Yang, H; Zhao, X; Liu, J; Wang, Z; Wang, Q. 2025: A novel boronic acid-based
fluorescent sensor for the selective detection of L-lysine in food samples and cells. RSC Advances.
Volume 15. Issue 13, 10453-10459.
https://doi.org/10.1039/D5RA00621J |
| 10 | Ghobadi, S; Yousefi, F; Khademi, F; Padidar, S; Mostafaie, A. 2012.An efficient method for
purification of nonspecific lipid transfer protein-1 from rice seeds using kiwifruit actinidin
proteolysis and ion exchange chromatography. Separation Science. Volume 35, Issue 21, 2827-2833.
https://doi.org/10.1002/jssc.201200383 |
| 11 | Hayat, A; Jahangir, T; Khuhawar, M; Alamgir, M; Siddiqui, A; Musharraf, S. 2014. Simultaneous HPLC
determination of gamma amino butyric acid (GABA) and lysine in selected Pakistani rice varieties by
pre-column derivatization with 2-Hydroxynaphthaldehyde. Journal of Cereal Science. Volume 60, Issue
2, 356-360.
https://doi.org/10.1016/j.jcs.2014.05.011 |
| 12 | Jadán, F; Villavicencio, Ch; Mieles, J; Cantos, M; Anchundia, A; Zambrano, M-I; Intriago, F;
Giler, S; Pérez, E; Litardo, R; Jadán, C. 2025. Quantification of lactic acid in wines using an
amperometric biosensor. Food Control. 167, 110821.
https://doi.org/10.1016/j.foodcont.2024.110821 |
| 13 | Jadán, F. 2019. Selective determination of lactic acid in dry-fermented sausages using a sensor
based on immobilized lactate oxidase. Food Biotechnology. Vol 33, N0. 3, 272-282.
https://doi.org/10.1080/08905436.2019.1618713 |
| 14 | Jadan, F; Cevallos-Mendoza, J; Vera, J-M; Sánchez, V; Laz, M; Rivadeniera, R; Dueñas, J;
Rodriguez, M; Jadán, C. 2023. Selective determination of methanol and ethanol using a sensor based
on alcohol oxidase immobilized on a cassava biopolymer. Biosensors and Bioelectronics: X. 100414.
https://doi.org/10.1016/j.biosx.2023.100414 |
| 15 | Jadan, F; Aristoy, M-C; Toldrá, F. 2016. Selective Determination of Lysine in Dry - Cured Meats
Using a Sensor Based on Lysine-α-oxidase Immobilised on a Nylon Membrane. Food. Anal. Methods. 9:
2484-2490.
https://doi.org/10.1007/s12161-016-0425-6 |
| 16 | Hu, J; Liu, F; Ju, H. 2015 Peptide Code -on-a-Microplate for Protease Activity Analysis via
MALDI-TOF Mass Spectrometric Quantitation. Analytical Chemistry, Vol 87, Issue 8.
https://doi.org/10.1021/acs.analchem.5b00230 |
| 17 | Kacar, C; Erden, P; Kilic, E. 2017 Amperometric L-Lysine biosensor based on carboxylated
multiwalled carbon nanotubes-SnO2 nanoparticles-graphene composite. Applied Surface Science. Volume
419, Pages 916-923.
https://doi.org/10.1016/j.apsusc.2017.05.120 |
| 18 | Kang, D; Zuo, X; Yang, R; Xia, F; Plaxco, K; White, R. 2009. Comparing the Properties of
Electrochemical -Based DNA Sensors Employing Different Redox Tags. Analytical Chemistry. 81 (21),
9109-9113.
https://doi.org/10.1021/ac901811n |
| 19 | Kaur, J; Singh, P. 2020 Trypsin Detection Strategies: A Review. Critical Reviews in Analytical
Chemistry. Volume 52, Issue 5.
https://doi.org/10.1080/10408347.2020.1846490 |
| 20 | Kong, Y; Toh, N-P; Wu, Y; Huang, D. 2023 Trysin-treated chickpea protein hydrolysate enhances the
cytoaffinity of microbeads for cultured meat application. Food Research International. Volume 173,
Part 2, 113299.
https://doi.org/10.1016/j.foodres.2023.113299 |
| 21 | Ling Li, Hongjie Chen, Xin Lü, Jinyan Gong, Gongnian Xiao. 2022. Effects of papain concentration,
coagulation temperature, and coagulation time on the properties of model soft cheese during
ripening. LWT. Volume 161, 113404
https://doi.org/10.1016/j.lwt.2022.113404 |
| 22 | Liu, J; Zhong Xu, J; Ming Rao, Z; Zhang, W. 2022. An enzymatic colorimetric whole-cell biosensor
for high-throughput identification of lysine overproducers. Biosensors and Bioelectronics. Volume
216, 114681.
https://doi.org/10.1016/j.bios.2022.114681 |
| 23 | Luo, B; Zhang, L; Zhang, C; Chen, W; Mo, J; Li, W; Wu, T. 2024. High-throughput DART -MS/MS for
quantification of carboxymethyl lysine and carboxyethyl lysine in beef. Journal of Food Composition
and Analysis. Volume 136, 106834
https://doi.org/10.1016/j.jfca.2024.106834 |
| 24 | Mao, Y; Krischke, M; Hengst, C; Kulozik, U. 2018. Comparision of the influence of pH on the
selectivity of free and immobilized trypsin for β-lactoglobulin hydrolysis. Food Chemistry. Volume
253, 194-202.
https://doi.org/10.1016/j.foodchem.2018.01.151 |
| 25 | Mohd, S; Kumar, P; Sharma, N; Qurni, A; Lee, S-J; Ismail, M. 2023. Application of Plant Proteases
in Meat Tenderization: Recent Trends and Future Prospects. Foods. 12, 1336
https://doi.org/10.3390/foods12061336 |
| 26 | Mótyán, J-A; Tóth, F; Tozsér, J. 2013. Research Applications of Proteolytic Enzymes in Molecular
Biology. Biomolecules. 3(4),923-942.
https://doi.org/10.3390/biom3040923 |
| 27 | Nicosia, F; Puglisi, I; Pino, A; Caggia, C; Randazzo, C. 2022. Plant Milk-Clotting Enzymes for
Cheesemaking. Foods. 11(6), 871.
https://doi.org/10.3390/foods11060871 |
| 28 | Nohwal, B; Chaudhary, R; Kumar, P; Pundir, C.S. 2020. Fabrication and application of an
amperometric lysine biosensor based on covalently immobilized lysine oxidase nanoparticles onto Au
electrode. International Journal of biological Macromolecules. Volume 146, 907-915.
https://doi.org/10.1016/j.ijbiomac.2019.09.213 |
| 29 | Ong, I-l; Yang, K. 2017 Recent developments in protease activity assays and sensors. Analyst. 142,
1867-1881.
https://doi.org/10.1039/C6AN02647H |
| 30 | Qiong, C; Tuzhi, P; Liju, Y. 1998 Silk fibroin/cellulose acetate membrane electrodes incorporating
xanthine oxidase for the determination of fish freshness. Analytica Chimica Acta, 369, 245-251.
https://doi.org/10.1016/S0003-2670(98)00213-X |
| 31 | Qiu, Ch; Huang, M; Hou, Y; Tao, H; Zhao, J; Shen, Yu, Bao, X; Qi, Q; Hou, J. 2022.
Biosensor-Coupled In vivo Mutagenesis and Omics Analysis Reveals Reduced Lysine and Arginine
Synthesis To Improve Malonyl-Coenzyme A Flux in Saccharomyces cerevisiae. mSystems. Volume 7, Issue
2.
https://doi.org/10.1128/msystems.01366-21 |
| 32 | Puiu, M; Bala, C. 2018 Peptide-based biosensors: From self-assembled interfaces to molecular
probes in electrochemical assays. Bioelectrochemistry. Volume 120, 66-75.
https://doi.org/10.1016/j.bioelechem.2017.11.009 |
| 33 | Reichard, A; Asosingh, K. 2018 Best practices for preparing a single cell suspensión from solid
Tissues for Flow Cytometry. Cytometry. Volume 95, Issue 2, 219-226.
https://doi.org/10.1002/cyto.a.23690 |
| 34 | Shin, D, Liu, Y; Gao, Y; Kwa, T; Matharu, Z; Revzin. 2012. Micropatterned Surfaces Functionalized
with Electroactive Peptides for Detecting Protease Release from Cells. Analytical Chemistry. Volume
85, Issue 1.
https://doi.org/10.1021/ac302547p |
| 35 | Slechtova, T; Gilar, M; Kalikova, K; Tesarova, E. 2015 Insigth into Trypsin Miscleavage:
Comparison of Kinetic Constants of Problematic Peptide Sequences. Analytical Chemistry. Vol 87,
Issue 15.
https://doi.org/10.1021/acs.analchem.5b00866 |
| 36 | Suhito, I; Koo, K; kim, T. 2021. Recent Advances in Electrochemical Sensors for the Detection of
Biomolecules and Whole Cells. biomedicines.9(1),15.
https://doi.org/10.3390/biomedicines9010015 |
| 37 | Tavano, O; Berenguer, A; Secundo, F; Fernandez, R. 2018. Biotechnological Applications of
Proteases in Food Technology. Comprehensive REVIEWS in Food Science and Food Safety. Volume 17,
Issue 2, 412-436.
https://doi.org/10.1111/1541-4337.12326 |
| 38 | Tigist, M; Getnet, B; Beza, K; Endalamaw, M; Lulit, M; Tamirat, D; Tinsae, M.2016 Extraction and
purification of papain enzyme from papaya leaf and the phytochemical components of the leaf.
Biotechnology International. 9 (8), 176-184.
|
| 39 | Uliana, F; Vizovisek, M; Acquasaliente, L; Ciuffa, R; Fossati, A; Frommelt, F; Goetze, S;
Wollscheid, B; Gstaiger, M; De Filippis, V; Keller, U; Aebersold, R. 2021 Mapping specificity,
cleavage entropy, allosteric changes and substrates of blood proteases in a high-throughput screen.
nature COMMUNICATIONS. 12:1693.
https://doi.org/10.1038/s41467-021-21754-8 |