HIF-O-Glcnac Axis — Implications for Breast Cancer Metastasis
bThe BioMedChem Doctoral School of the UL and Lodz Institutes of the Polish Academy of Sciences, Jana Matejki 21/23 90-237 Lodz, Poland,
cThe first Clinical Department of General and Oncological Surgery, Provincial Integrated Hospital in Plock, Medyczna 19, 09-400 Plock, Poland
Keywords
Abstract
Background/Aims:
Hypoxia-inducible factor isoforms HIF1 and HIF2 are crucial in the hypoxia response but might also support cancer progression, including breast cancer. O-GlcNAcylation, a post-translational modification regulated by the OGT enzyme, is also emerging as a contributor to breast cancer malignancy. This study aimed to elucidate the role of HIF1 and HIF2 in breast cancer progression and their relationship to O-GlcNAcylation.Methods:
We analyzed clinical breast cancer samples, assessing HIF1, HIF2, OGT, and the total O-GlcNAcylation levels by the Western Blot method and their association with clinicopathological characteristics. Additionally, we employed in vitro silencing of OGT, HIF1, and HIF2 in breast cancer cell lines (MCF-7 and MDA-MB-231) to examine their effects on genes expression and cell migration (wound healing assay). A p-value < 0.05 was considered to indicate a statistically significant difference.Results:
In breast cancer samples, both HIF isoform levels were elevated in tumors, but HIF2 was associated with lymph node metastasis. A negative correlation was found between HIF2 and O-GlcNAcylation. Silencing HIF2 slowed cell migration, increased O-GlcNAcylation, and decreased the expression of metastasis-related genes. Silencing HIF1 or OGT resulted in the increased expression of these genes, potentially due to increased levels of HIF2.Conclusion:
Our findings suggest that the HIF-O-GlcNAc axis plays a critical role in breast cancer progression and metastasis, with HIF1 and HIF2 exhibiting distinct functions.Introduction
A crucial element of the hypoxia response and adaptation is the activity of the transcriptional factor called the hypoxia-inducible factor (HIF). It contains two subunits: the oxygen-labile alpha subunit (which has three isoforms: 1α, 2α, and 3α) and the beta subunit, also called ARNT (Aryl Hydrocarbon Receptor Nuclear Translocator). Under physiological oxygenation conditions, the alpha subunits have a half-life of approximately five minutes, after which they undergo proteasomal degradation. The alpha subunit is primarily degraded by prolyl hydroxylases (PHDs) under normoxic conditions [1]. Insufficient oxygenation stabilizes the alpha subunit, creating an active alpha-beta heterodimer that regulates the expression of genes crucial in the hypoxia response.
The HIF-1α and HIF-2α isoforms (further indicated as “HIF1 and “HIF2”) show similar regulation characteristics, although they are active in different types of hypoxia. HIF1 is stabilized due to acute hypoxia occurrence but its level begins to reduce in prolonged hypoxia. In chronic hypoxia, an increased level of HIF2 is observed [2, 3]. Most normal human tissues do not contain HIF1 due to its quick degradation. Still, it can be detected in over half of cancers, including prostate cancer, breast cancer, lung cancer, pancreatic cancer, brain cancer, stomach cancer, ovarian cancer, kidney cancer, and melanomas [4]. Constitutive expression of the hypoxia-inducible factor is also observed in non-hypoxic cancer cell lines [5].
Breast cancers exhibit various mechanisms for activating the hypoxia-inducible factor, including those associated with hormone receptors. Increased activity of HIF’s isoforms plays a role in diverse processes such as glucose metabolism, immune evasion, cell survival and death, angiogenesis, invasion, metastasis, and hormone receptor activity [6]. While HIF2 isoform research is growing, its specific function in breast cancer is still unclear. Due to this lack of understanding and the frequent focus on HIF1, it can be challenging to determine which isoform is responsible for the observed effects. A comprehensive understanding of the differences between HIF1 and HIF2 isoforms is vital, as the transition from HIF1 to HIF2 has been linked to heightened aggressiveness in cancers, including growth and invasion [7]. Although this phenomenon was primarily observed in renal cancer, which is characterized by elevated HIF2 levels, and HIF1 is the predominant isoform overexpressed in breast cancer, emerging evidence suggests a role of HIF2 in breast cancer progression and metastasis, emphasizing the necessity for further investigation [8].
O-GlcNAcylation is a dynamic, reversible modification in which acetylated hexosamine sugar N-acetylglucosamine (GlcNAc) is added through a glycosyl linkage to the serine or threonine residues in amino-acid chains. Contrary to phosphorylation, the enzymes regulating O-GlcNAcylation are reduced to a few: OGT (O-linked N-acetylglucosamine (GlcNAc) transferase), which adds a sugar moiety to a protein, and OGA (O-GlcNAcase), which reverses O-GlcNAcylation [9]. O-GlcNAcylation regulates protein localization, activity, and stability. Due to its strict dependency on glucose concentration, O-GlcNAcylation is frequently referred to as a metabolic indicator or a metabolic sensor [10].
Studies using both cancer cell lines and clinical samples have shown that breast cancer exhibits higher levels of O-GlcNAcylation compared to other cancer types like colon, liver, and lung cancer [11, 12]. O-GlcNAcylation dysregulations were reported to affect various aspects of breast cancer biology, such as cell death and survival, gene expression and protein processing, metabolism, stress response, and therapy resistance, hormone receptors, invasion, and metastasis [13]. Aberrant O-GlcNAcylation is associated with alterations in gene expression in cancers [14]. It was shown to affect the activity of the hypoxia-inducible factor, yet only the HIF1 isoform has been investigated so far [15]. HIF1 was proven to be a possible target for direct O-GlcNAcylation [16]; however, this mechanism’s exact role and implications need further investigation.
Our study aims to determine the role of the HIF-O-GlcNAc axis in breast cancer, emphasizing the differences between HIF1 and HIF2 isoforms in clinical samples and breast cancer cell lines with distinct molecular contexts. Investigating the complex interplay between hypoxia-inducible factor and O-GlcNAcylation may identify a key regulator in breast cancer progression and metastasis crucial for developing effective therapies.
Materials and Methods
The study aimed to determine the role of the HIF-O-GlcNAc axis in breast cancer. The design includes two main parts: analysis of HIF1, HIF2, OGT, and total O-GlcNAcylation levels in clinical samples of breast cancer and adjacent non-tumor breast tissue and their association with clinicopathological characteristics, and in vitro experiments focused on the results of HIF1/HIF2/OGT silencing on the metastatic potential of breast cancer cells with distinct molecular characteristics.
Clinical samples
Clinical samples were obtained from the 1st Department of General and Oncological Surgery of the Marcin Kacprzak Provincial Complex Hospital in Płock, Poland. The material included 72 tumors and 52 non-tumor samples, characterized in Table 1. The research was conducted under the approval of the bioethics committee, signature number 15/KBBN-UŁ/II/2021-22, and by the ethical principles outlined in the Declaration of Helsinki. Patients were selected using a convenience sampling method based on the 2021-2022 timeframe. Beyond informed consent, no specific exclusion criteria were applied. Due to the study’s retrospective nature, clinicopathological features such as grade, tumor size etc., were not determined for all samples. Matched non-tumor breast tissue samples were available for 52 tumors while 20 tumors lacked corresponding normal tissue. Samples with missing data for a specific characteristic were excluded from analysis involving a particular variable. A full description of all the samples can be found in Supplementary Materials (Clinical Samples Data.xlsx).
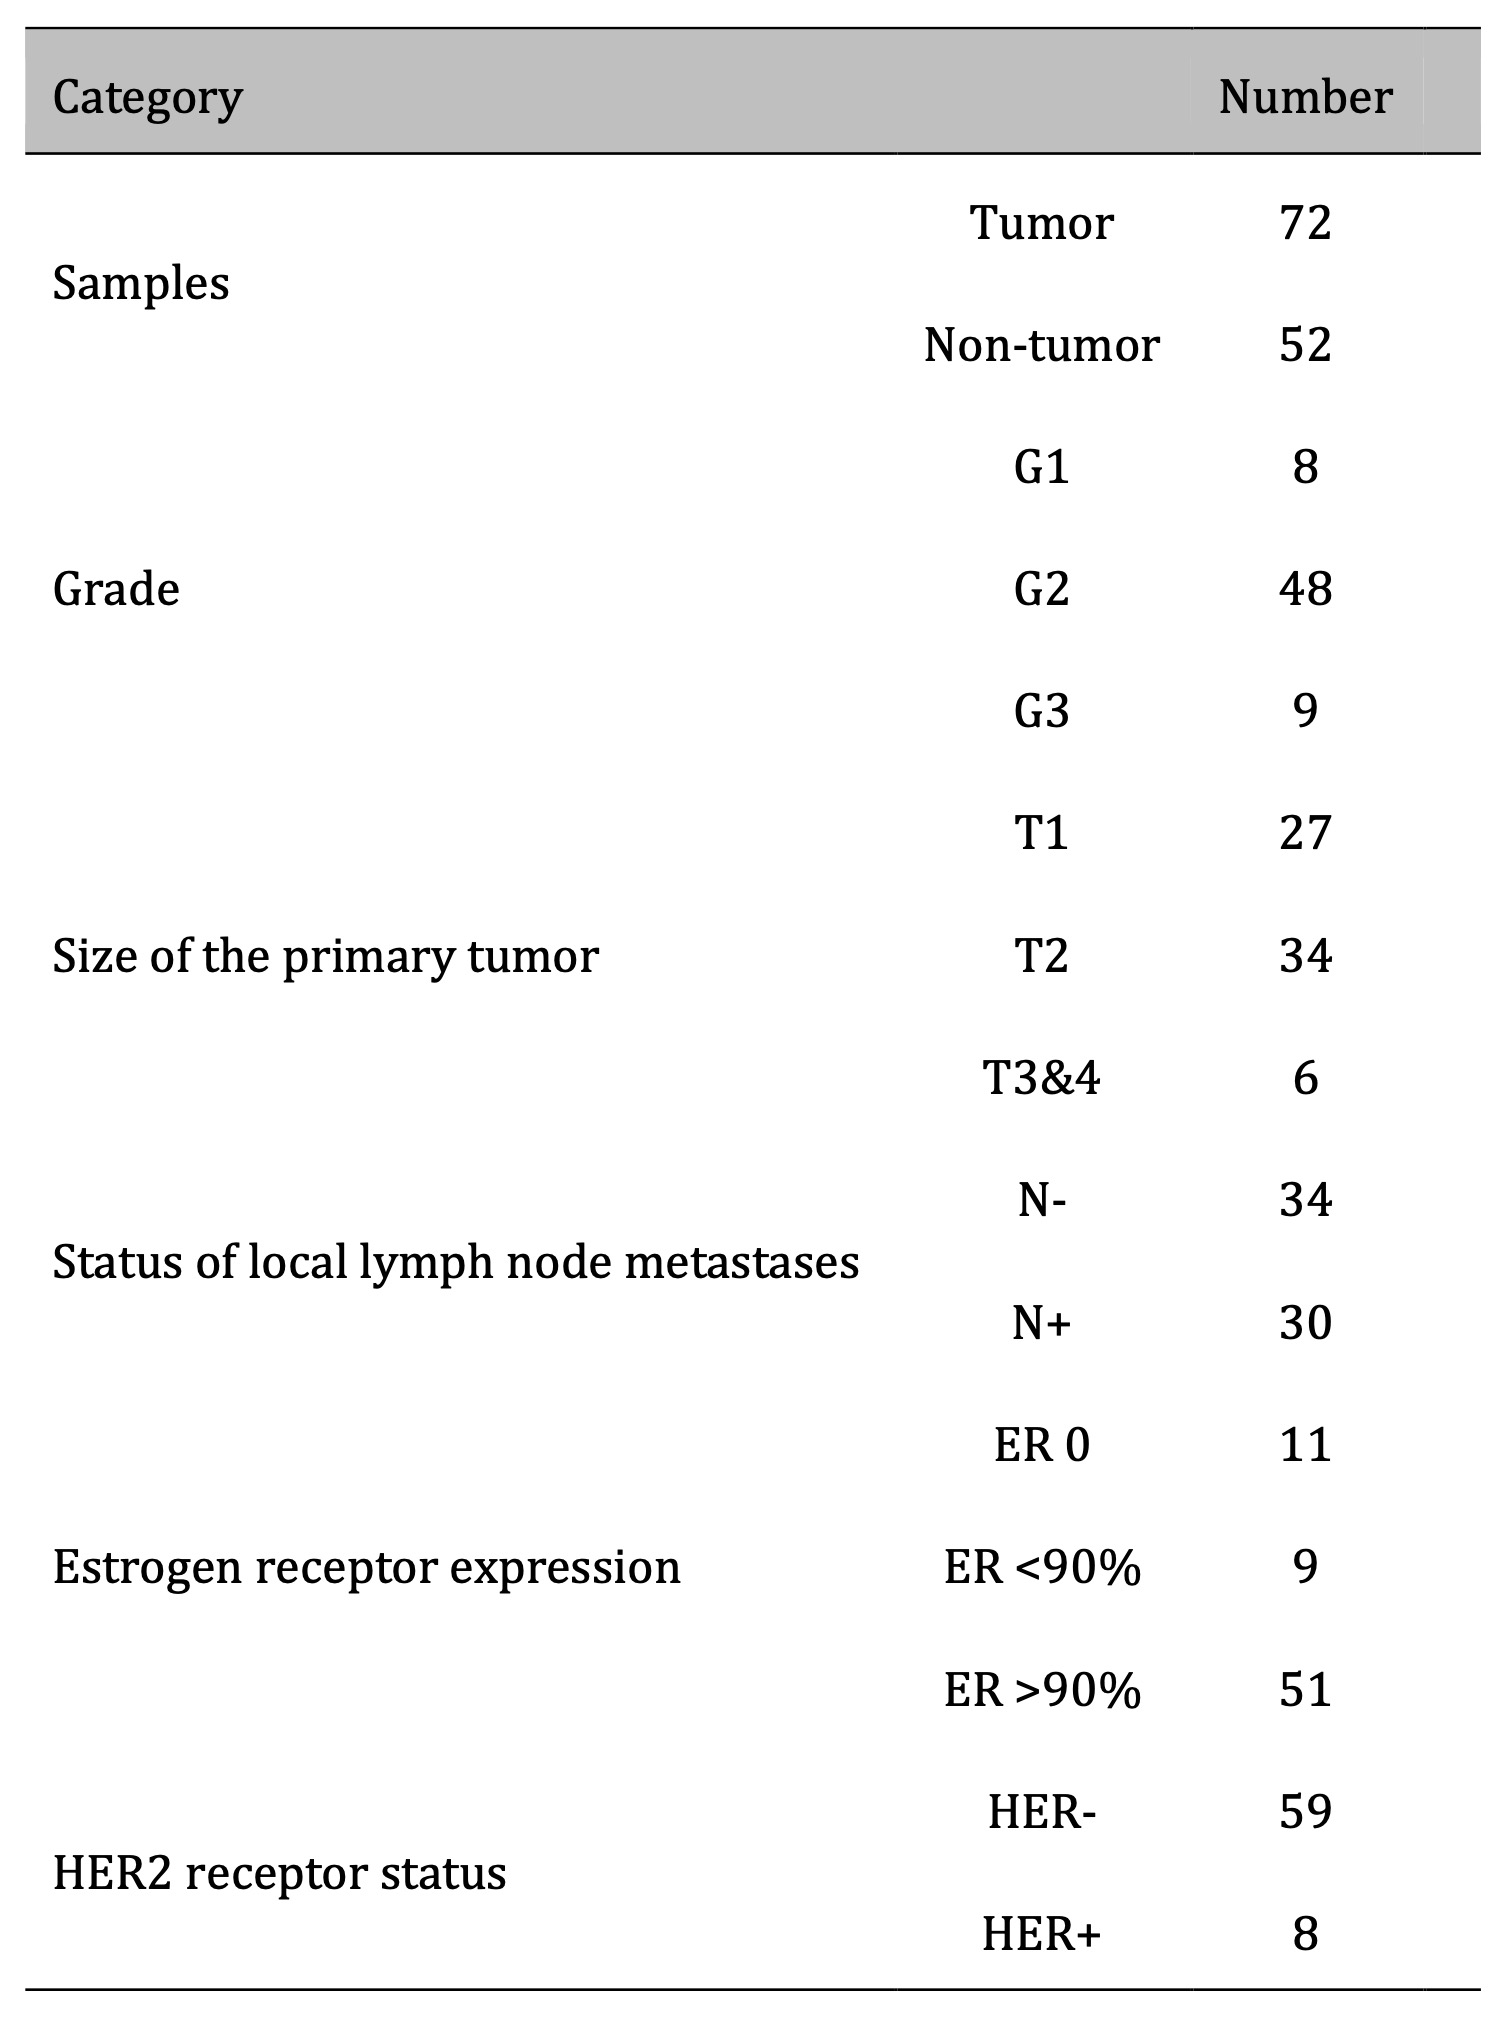
Table 1: Descriptive data of samples used in the study
Western Blotting
Clinical samples were lysed using the RIPA buffer (50 mM Tris HCl pH 8, 150 mM NaCl, 0.5% sodium deoxycholate, 1% Nonidet P-40, 0.1% SDS, 1 mM EDTA, 1 mM PMSF), homogenized in a Dounce homogenizer, and sonicated (amplitude 25% for 30 seconds). The amount of protein in the sample lysates was measured using the Lowry method. Proteins were resolved by 8% SDS-PAGE and transferred onto Immobilon-P membranes. HIF1 and HIF2 were detected on separate membranes to avoid errors due to identical molecular weight. Each membrane contained a positive control with HS578T and MDA-MB-231 breast cancer cells incubated with CoCl2 for 48 hours to induce chemical hypoxia. Pumilio 1 (PUM1) was chosen as a reference due to its relatively stable expression in breast cancers [17]. Integrated optical density was performed using ImageJ software. Results are presented as a ratio of values normalized to positive control to reference protein normalized to positive control. Blots were processed in 8 sets parallelly.
Two references, Pumilio 1 (PUM1) and tubulin beta 3 class III (TUBB3), were used for western blot analysis of cell culture samples. HIF1 and HIF2 were detected on separate membranes to avoid errors due to identical molecular weight, and blots were processed in 2 sets parallelly. The sample size for each experimental variant was at least 3. Antibodies used for immunodetection are listed in Table S1 in Supplementary Materials.
Cell Cultures and Treatment
Human breast cancer lines MCF-7 and MDA-MB-231 were obtained from the American Type Culture Collection (Manassas, VA). Cells were cultured in Dulbecco’s Modified Eagle Medium (DMEM) with 10% fetal bovine serum (FBS), 2 mM L-glutamine, and 25 mM glucose. All cells were maintained as monolayer cultures at 5% CO2 in a humidified atmosphere at 37ºC. Cells were subcultured every 3-5 days.
For the HIF stabilization experiments, 4 x 10^5 cells from each line seeded in a 6-well plate were treated with 100 µM CoCl2 and incubated for 48 hours. Cobalt chloride was used as a hypoxia-mimetic agent [18], blocking the degradation of the hypoxia-inducible factor, and the concentration was chosen based on the concentration inducing hypoxia-response genes expression and cells’ proliferation [19] validated during pilot experiments.
RNA interference
HIF1, HIF2, and OGT expression were downregulated via the RNA interference method. Predesigned siRNA was purchased from Life Technologies with the following ID numbers: HIF1 (s6539), HIF2/EPAS1 (s4699), and OGT (s16093). The small, specific siRNAs were delivered with Lipofectamine® 2000 Transfection Reagent (Invitrogen) according to the manufacturer’s instructions. The siRNA concentration was established in pilot experiments to be 30 nmol/l for all three targets which ensured sufficient silencing confirmed by detection on the protein level with the Western Blot method while avoiding an off-target effect. Control cells were treated with Silencer™ Negative Control No. 1 siRNA provided by Ambion™ in matching concentration. Cells were incubated for 48 hours with a change for siRNA-free medium after 24 hours.
Real-Time PCR
Breast cancer cells were lysed using a Fenozol reagent (A&A Biotechnology), and the total RNA was isolated following the manufacturer’s protocol. First-strand cDNAs were obtained by reverse transcription of total RNA using the High Capacity cDNA Reverse Transcription Kit following the manufacturer’s protocol. Real-time cDNA amplification was performed using specific primers. The qPCR reaction was carried out using the Mastercycler ep realplex (Eppendorf). Relative expression of genes is presented as the number of copies of mRNA of specific genes per 1000 copies of HPRT1 and PUM1 mRNA. Fold differences in genes expression in cells normalized to HPRT1 and PUM1 levels were calculated using the formula 2ΔΔCt. Results were normalized to both references and presented as an arithmetic mean. The sample size for each experimental variant was 6. Sequences of primes used for genes amplification are listed in Table S2 in Supplementary Materials.
Wound Healing Assay
MDA-MB-231 cells were seeded at 4 x 10⁵ cells per well and MCF-7 cells were seeded at a density of 5 x 10⁵ cells per well in a 12-well plate. 24 hours after seeding, a sterile 200 μL pipette tip was used to create a scratch wound in the confluent cell monolayer. Cellular debris was removed by washing with phosphate-buffered saline (PBS). Cells were then incubated under standard conditions for 48 hours and images of the scratch area were captured at 0, 24, and 48 hours at x10 magnification using a Leica light microscope and LAS X software (Leica Microsystems GmbH, Germany). Image analysis was conducted using ImageJ software and the Wound_healing_size_tool plugin based on the developer’s guidelines [20]. Wound closure was quantified and expressed as a percentage, with the initial wound width at time 0 serving as the 100% reference point. The sample size for each experimental variant was 9.
Statistical analysis
Statistical analyses were performed with STATISTICA 10 (StatSoft, Poland) and GraphPad Prism 10 (Dotmatics, USA). The data that was gathered was first cleaned from outliers using the ROUT method with Q set to 1% or Grubbs test based on the group size. A t-test was used to compare the two groups if the data was normally distributed (as assessed by the Kolmogorov-Smirnov test) and had equal variances (as evaluated by the F test). If these assumptions were not met, the non-parametric Mann-Whitney test was employed. For comparisons involving more than two groups, the Kruskal-Wallis test was used, followed by Dunn’s post-hoc test for multiple comparisons. Correlation analysis was performed using Pearson’s r test as the data was normally distributed. Results are presented graphically, with means and standard errors of the mean (SEM) for parametric tests, and medians for non-parametric tests. Linear regression was used to illustrate correlations. Samples with missing data for a specific characteristic were excluded from analysis involving a particular variable. Differences between the initial group size detailed in Table 1 and the final sample size result from missing data or the exclusion of outliers. Additional tables provided in Supplementary Materials summarize the test results (Clinical Samples Statistics.xlsx, Cell Samples Statistics.xlsx). A p-value < 0.05 was considered to indicate a statistically significant difference.
Results
HIF1, HIF2, OGT, and O-GlcNAc levels in breast cancer samples and their association with clinicopathological characteristics
Protein lysates for the Western blot analysis were extracted from 72 tumors and 52 adjacent normal tissues. Most tumors were moderately differentiated with G2 grade (75%) and T1 and T2 stages of primary tumor size (91%), with half of the samples with positive lymph node metastasis status. Most samples were estrogen receptor-positive (85%) and HER2-negative (88%). The representative images of the immunodetection of HIF1, HIF2, OGT, and total O-GlcNAcylation are shown in Fig. 1.
Densitometric analysis of tumors and adjacent non-tumor samples revealed distinct patterns of HIF1, HIF2, OGT, and O-GlcNAc level changes (Fig. 2). Tumor samples exhibited significantly higher HIF1 levels compared to non-tumor samples, while HIF2 levels showed no significant difference between the groups. OGT levels were also elevated in tumor samples (approximately 1.5x higher), but total O-GlcNAcylation remained unchanged. HIF1 levels were highest in G3 tumors, whereas HIF2 levels peaked in G2 tumors and were positively associated with tumor size, with HIF1 levels decreasing beyond T2. Lymph node metastasis was associated with significantly higher HIF2 levels and, notably, lower total O-GlcNAcylation despite a trend towards increased OGT.
ER expression showed an opposite association with HIF isoform levels: tumors lacking ER expression displayed higher HIF1 and lower HIF2 while tumors with >90% ER expression showed the reverse pattern, accompanied by reduced total O-GlcNAcylation. HER2-positive tumors exhibited lower HIF1 levels but no significant difference in HIF2 levels, although an increase in total O-GlcNAcylation was observed (Fig. 3).
Tumors with higher levels of HIF2 had significantly higher levels of HIF1 and OGT but considerably lower levels of total O-GlcNAcylation. The result was confirmed by reversed analysis, which showed a significantly lower HIF2 level in tumors with higher total O-GlcNAcylation (Fig. 4).
This inverse relationship between HIF2 and O-GlcNAcylation was confirmed by a moderate negative correlation observed in both tumor and non-tumor samples (correlation coefficients: 0.48 and 0.49, respectively) (Fig. 5). No significant correlations were found between HIF2 and OGT or HIF1 and OGT/O-GlcNAc levels.
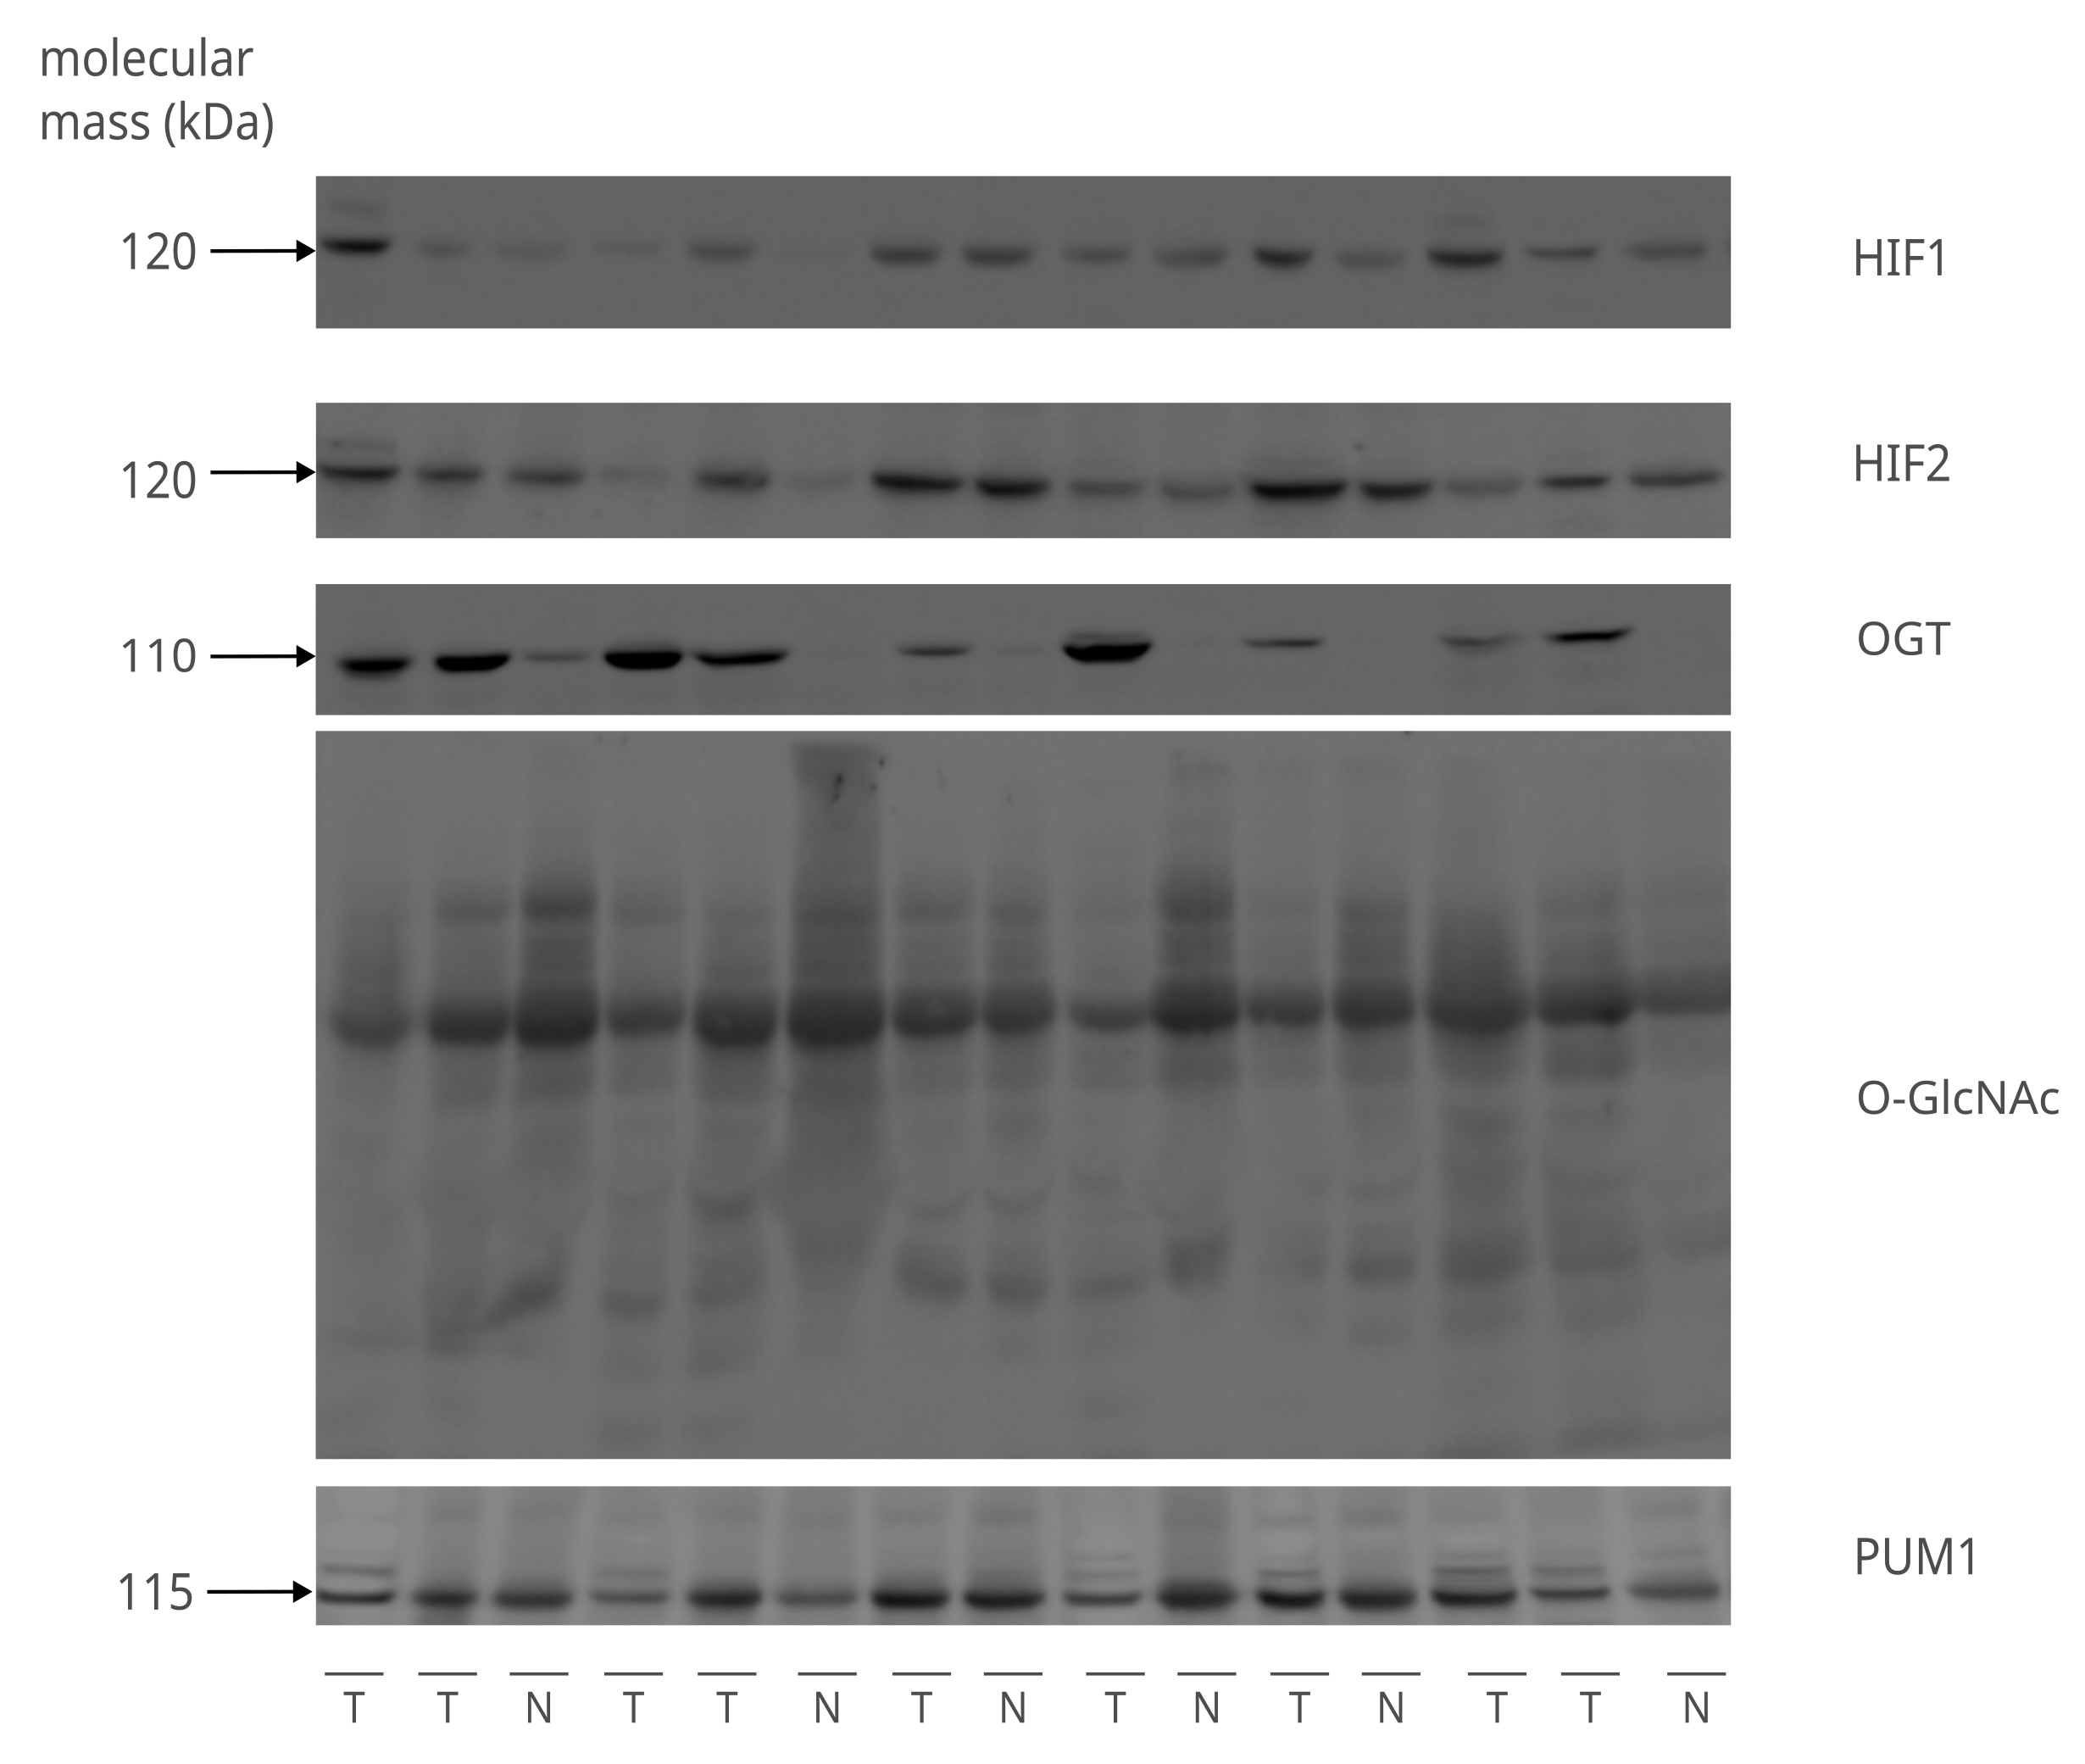
Fig. 1: Detection of HIF1, HIF2, OGT, and total O-GlcNAcylation in clinical samples. The figure shows representative images of the immunodetection of HIF1, HIF2, and OGT proteins, as well as total O-GlcNAcylation done with the 8% SDS-PAGE Western Blot. The molecular weight (kDa) of proteins is indicated on the left side of the image. The sample layout contains 9 tumor (T) and 6 non-tumor (N) various samples with distinct clinicalpathological characteristics. PUM1 was used as a loading control to equalize the comparison between samples. The remaining immunodetection images can be found in Supplementary Materials (folder: Western Blot Clinical Samples).
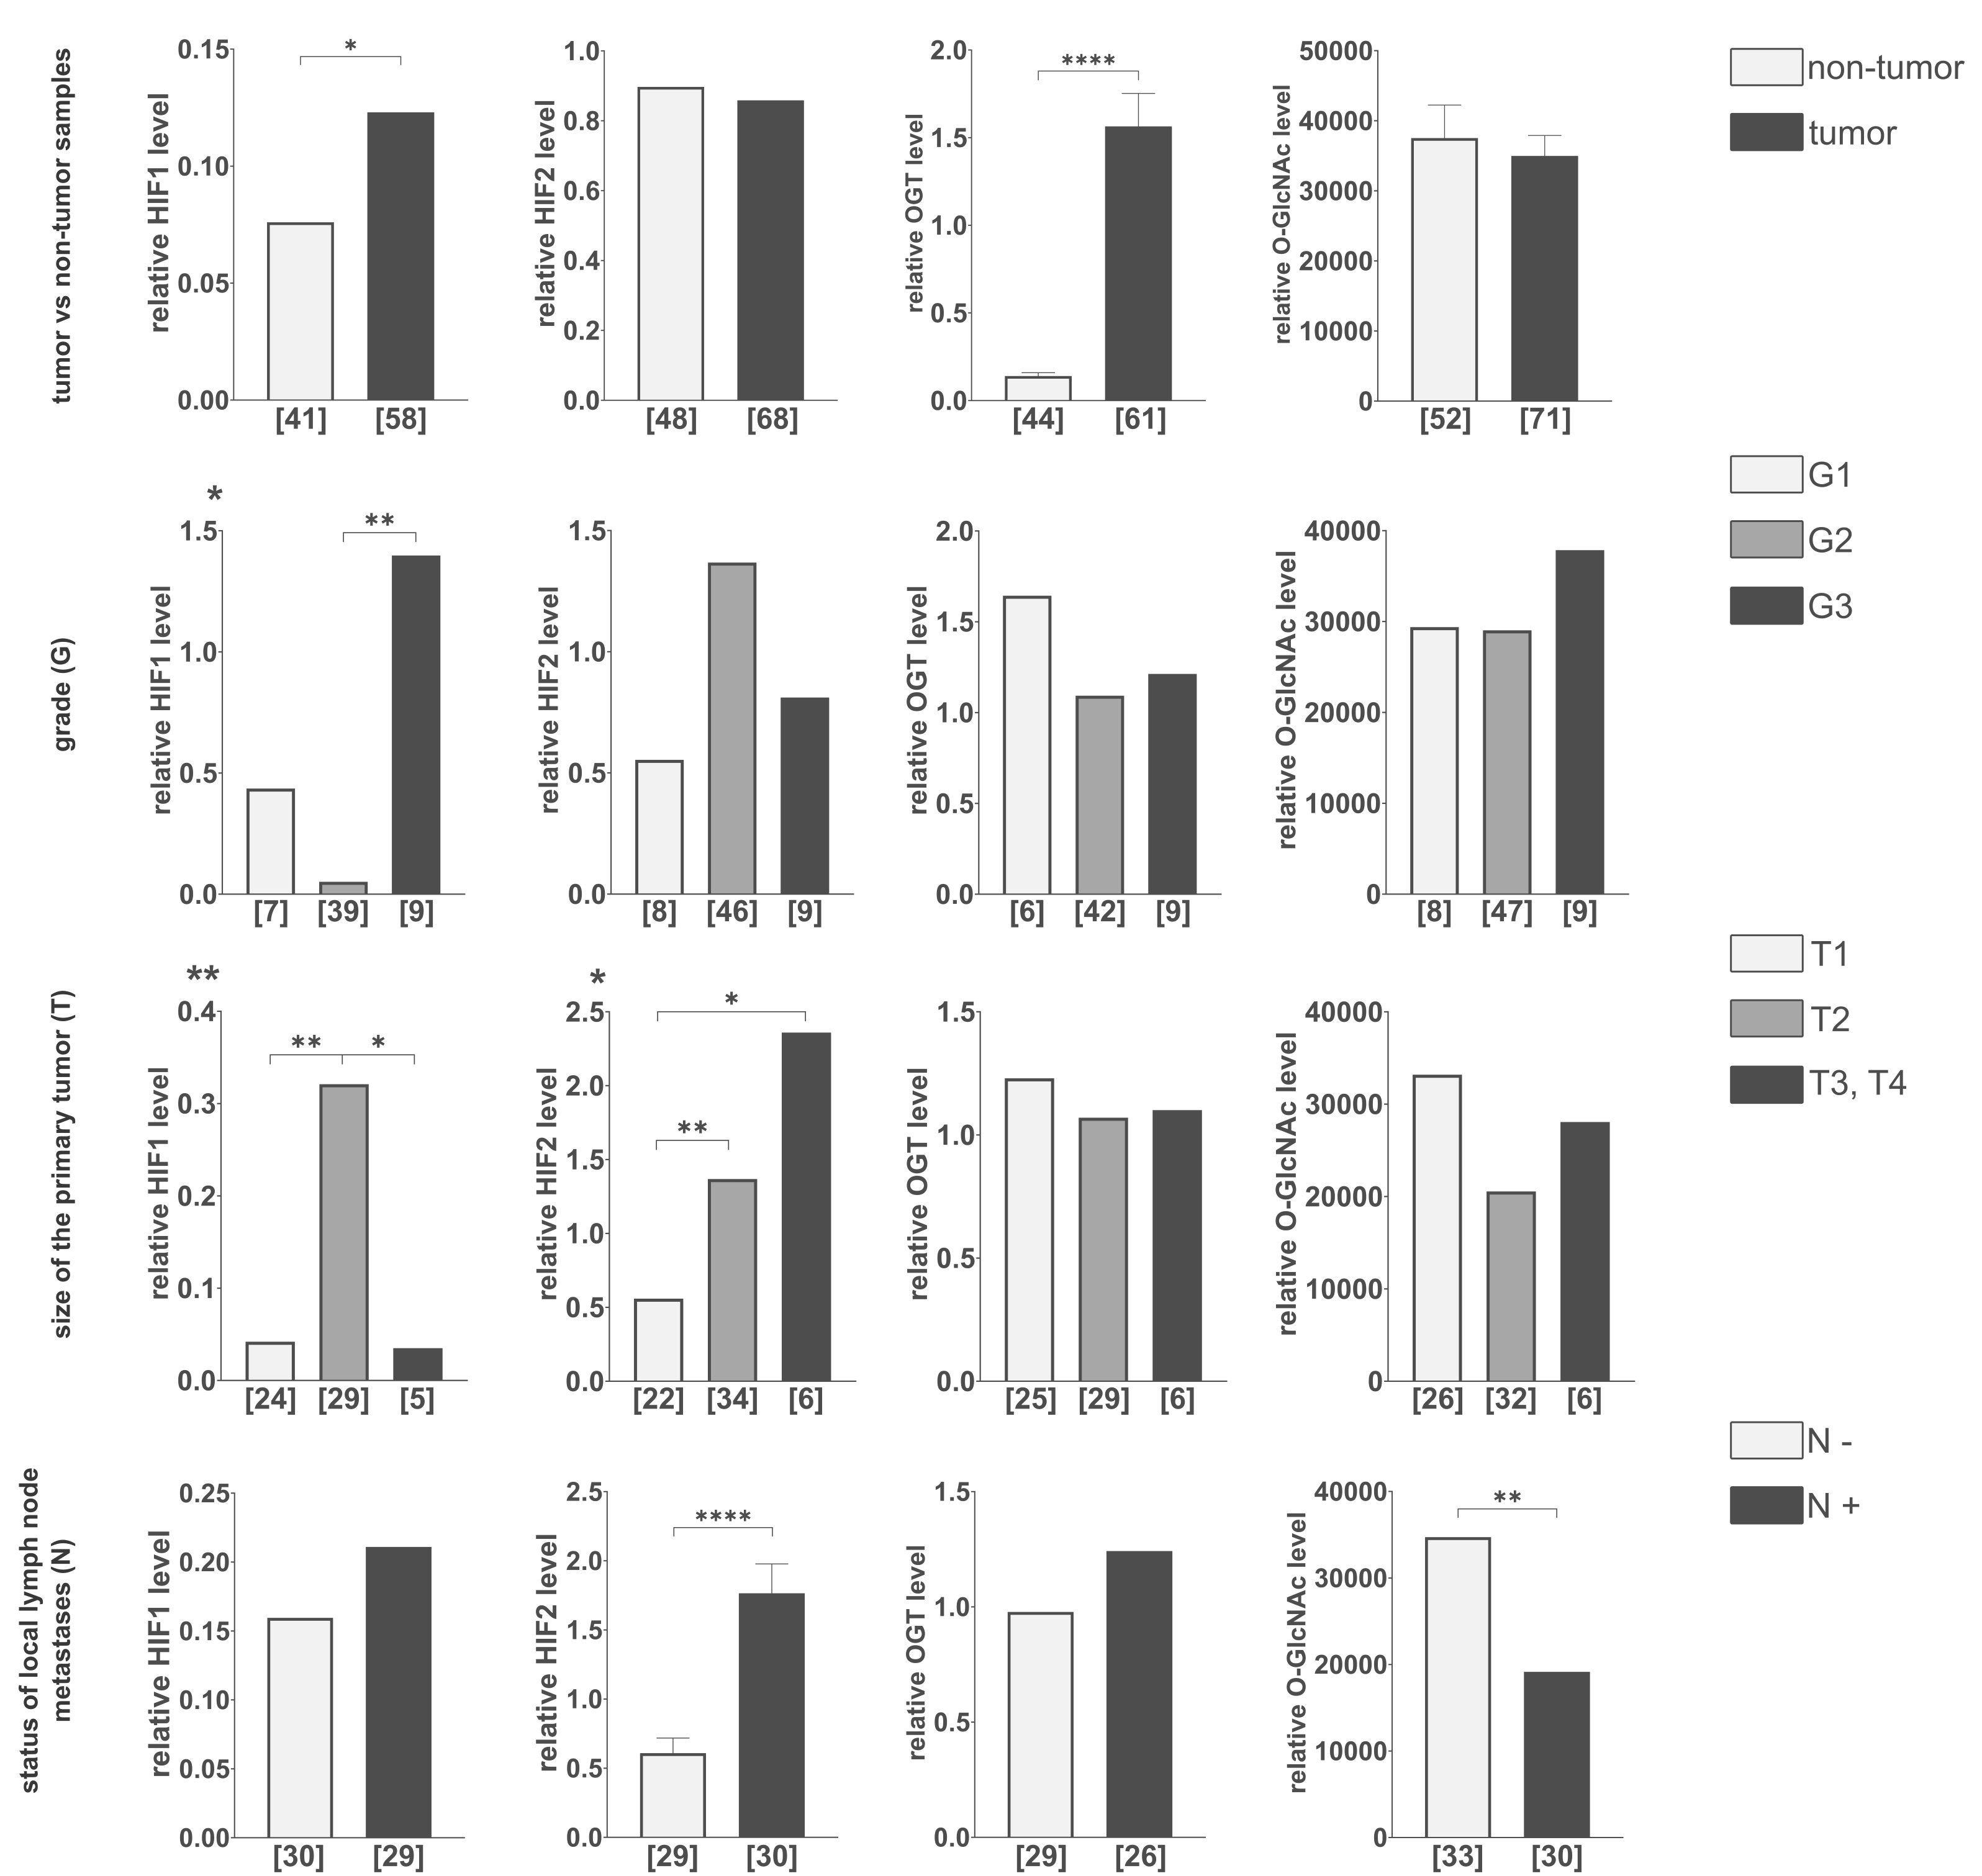
Fig. 2: Comparison of HIF1, HIF2, OGT, and total O-GlcNAcylation levels in tumor vs. non-tumor samples, various tumor grades, sizes, and lymph node metastasis statutes. The level of each protein and the modification were compared between tumor and non-tumor samples, tumor grades (G), primary tumor size (T), and the presence (N+) or absence (N-) of lymph node metastases. The presented graphs show the relative fold change of proteins and modification normalized to a positive control (made from MDA-MB-231 and HS578T cells incubated with the addition of cobalt chloride) and PUM1 expression. Data are presented as mean ± SEM for parametric tests and median for non-parametric tests. The sample size [n] for each comparison group is indicated in square brackets below the bar. Differences between the initial group size detailed in Table 1 and the final sample size result from missing data or the exclusion of outliers. Statistical significance was defined as p < 0.05 (*p ≤ 0.01, **p ≤ 0.001, ***p ≤ 0.0001). A full description of the statistical analysis, including sample sizes, normality, and variance comparisons, is provided in the Supplementary Materials (Clinical Samples Statistics.xlsx).
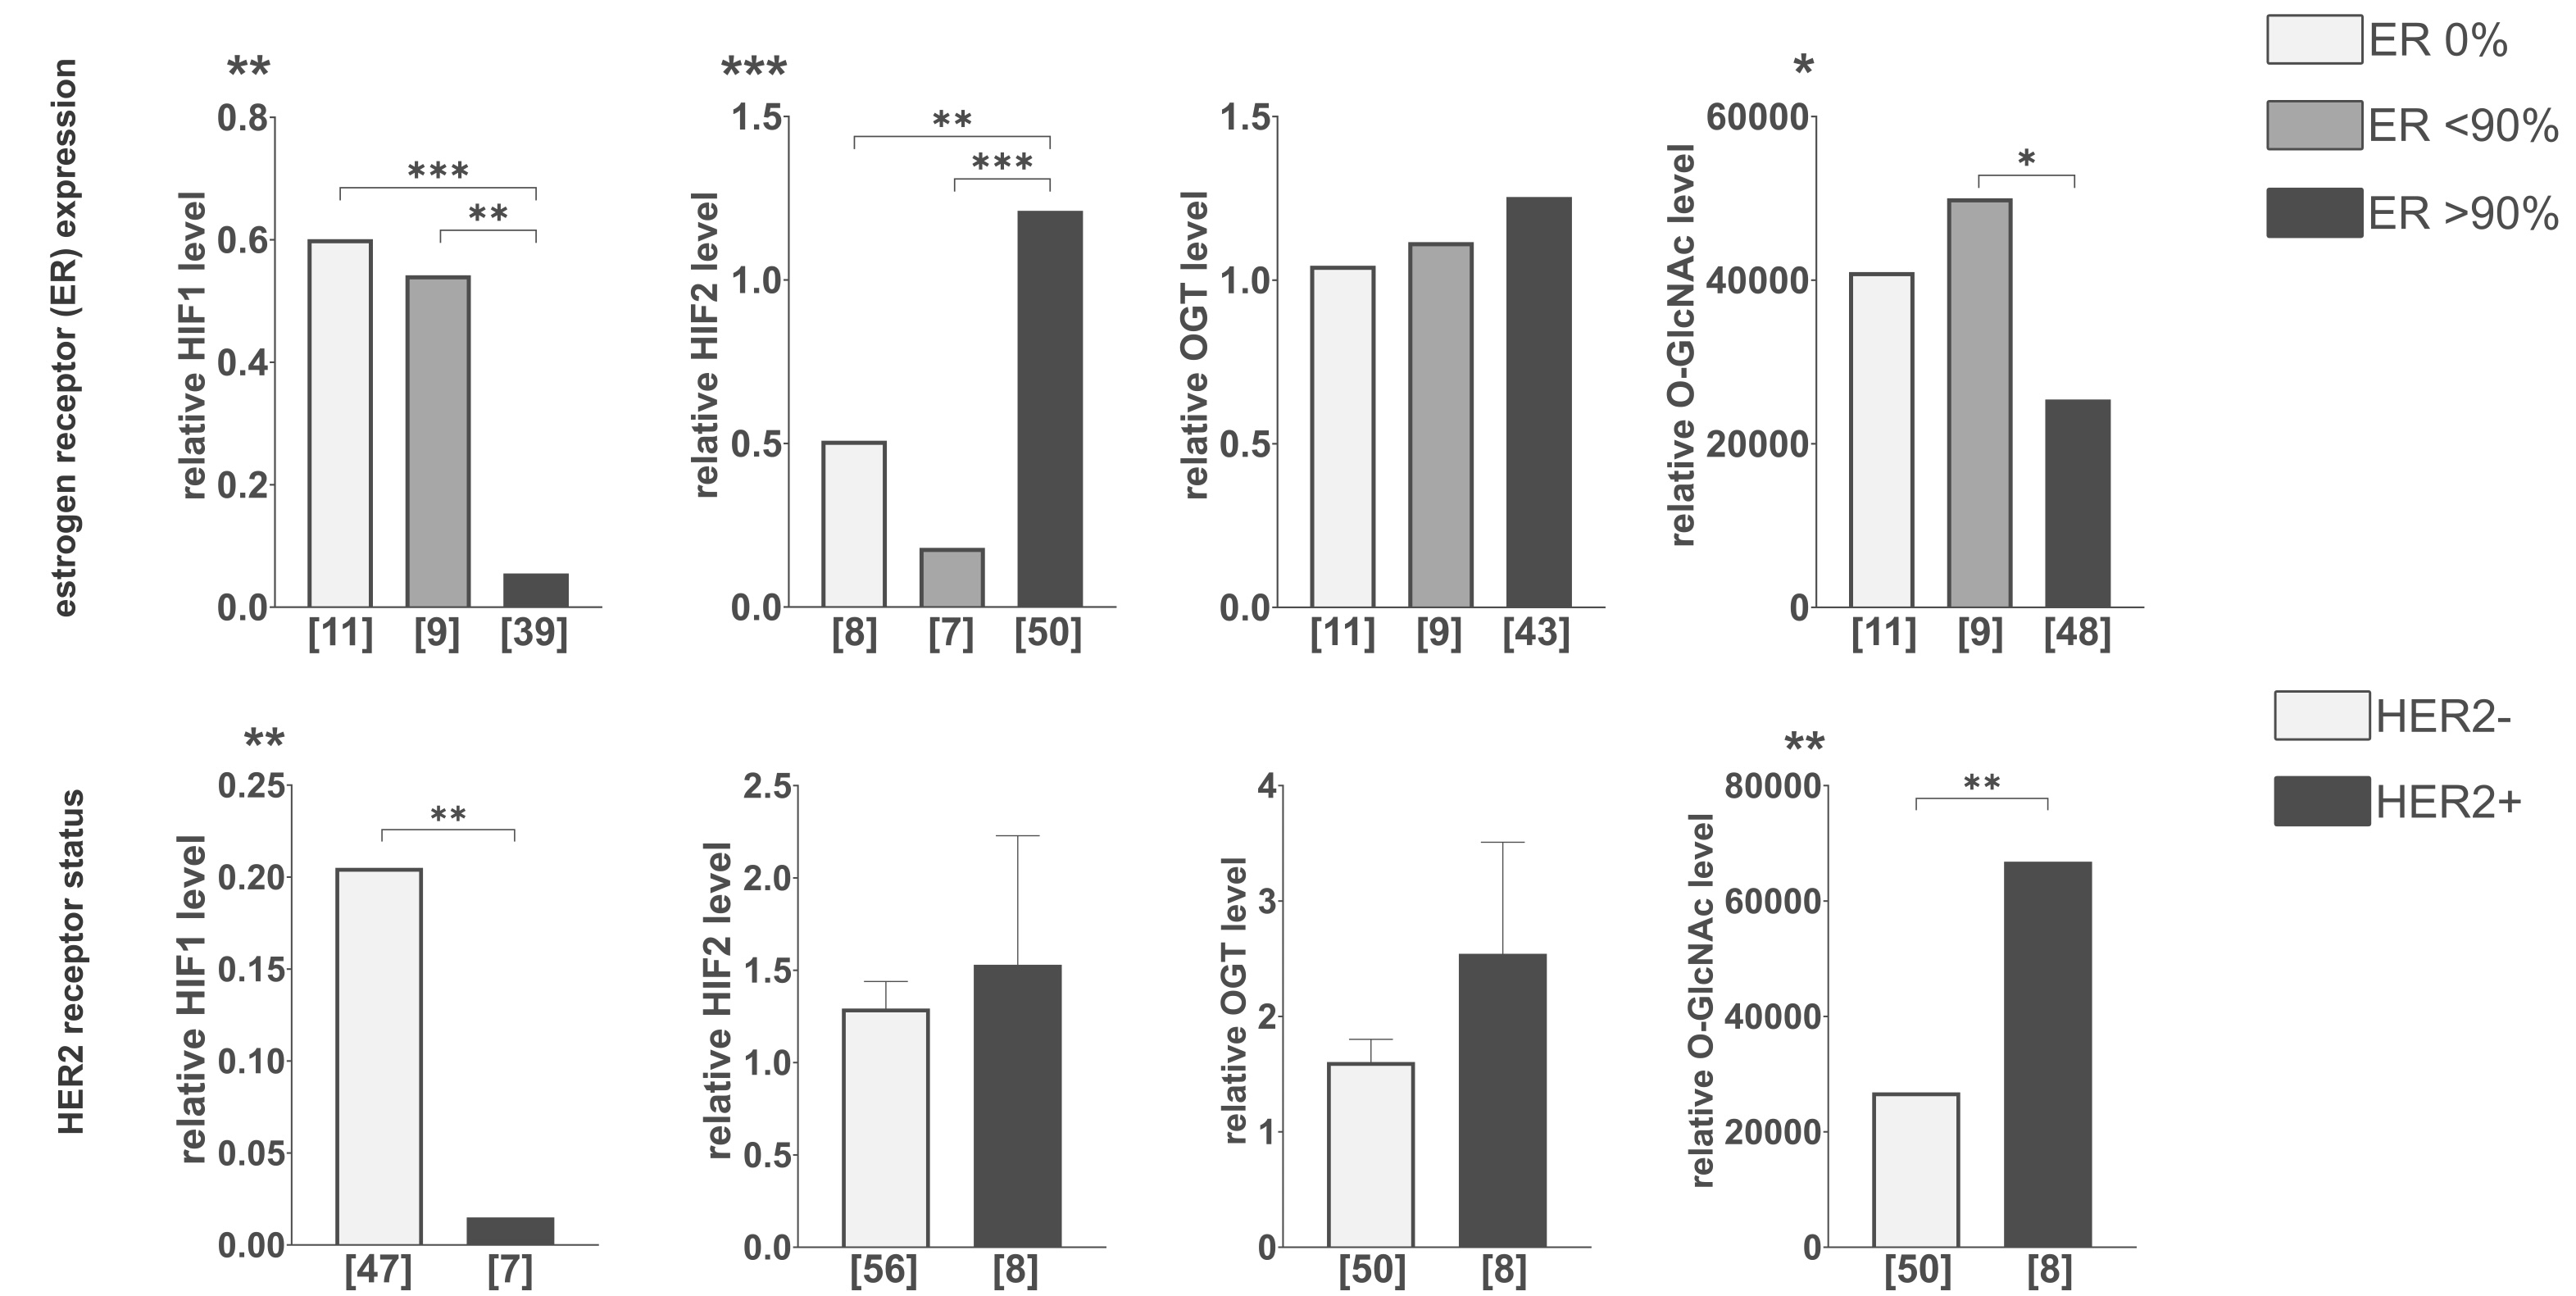
Fig. 3: Comparison of HIF1, HIF2, OGT, and total O-GlcNAcylation levels in tumors with different hormone receptors’ expression levels. The level of each protein and the modification were compared between various levels of estrogen receptor expression and HER-2 expression status. Cut-off points for estrogen receptor expression levels were determined based on the natural clusters in data distribution. The presented graphs show the relative fold change of proteins and modification normalized to positive control (made from MDA-MB-231 and HS578T cells incubated with the addition of cobalt chloride) and PUM1 expression. Data are presented as mean ± SEM for parametric tests and as medians for non-parametric tests. The sample size [n] for each comparison group is indicated in square brackets below the bar. Differences between the initial group size detailed in Table 1 and the final sample size result from missing data or the exclusion of outliers. Statistical significance was defined as p < 0.05 (*p ≤ 0.01, **p ≤ 0.001, ***p ≤ 0.0001). A full description of the statistical analysis, including sample sizes, normality, and variance comparisons, is provided in the Supplementary Materials (Clinical Samples Statistics.xlsx).
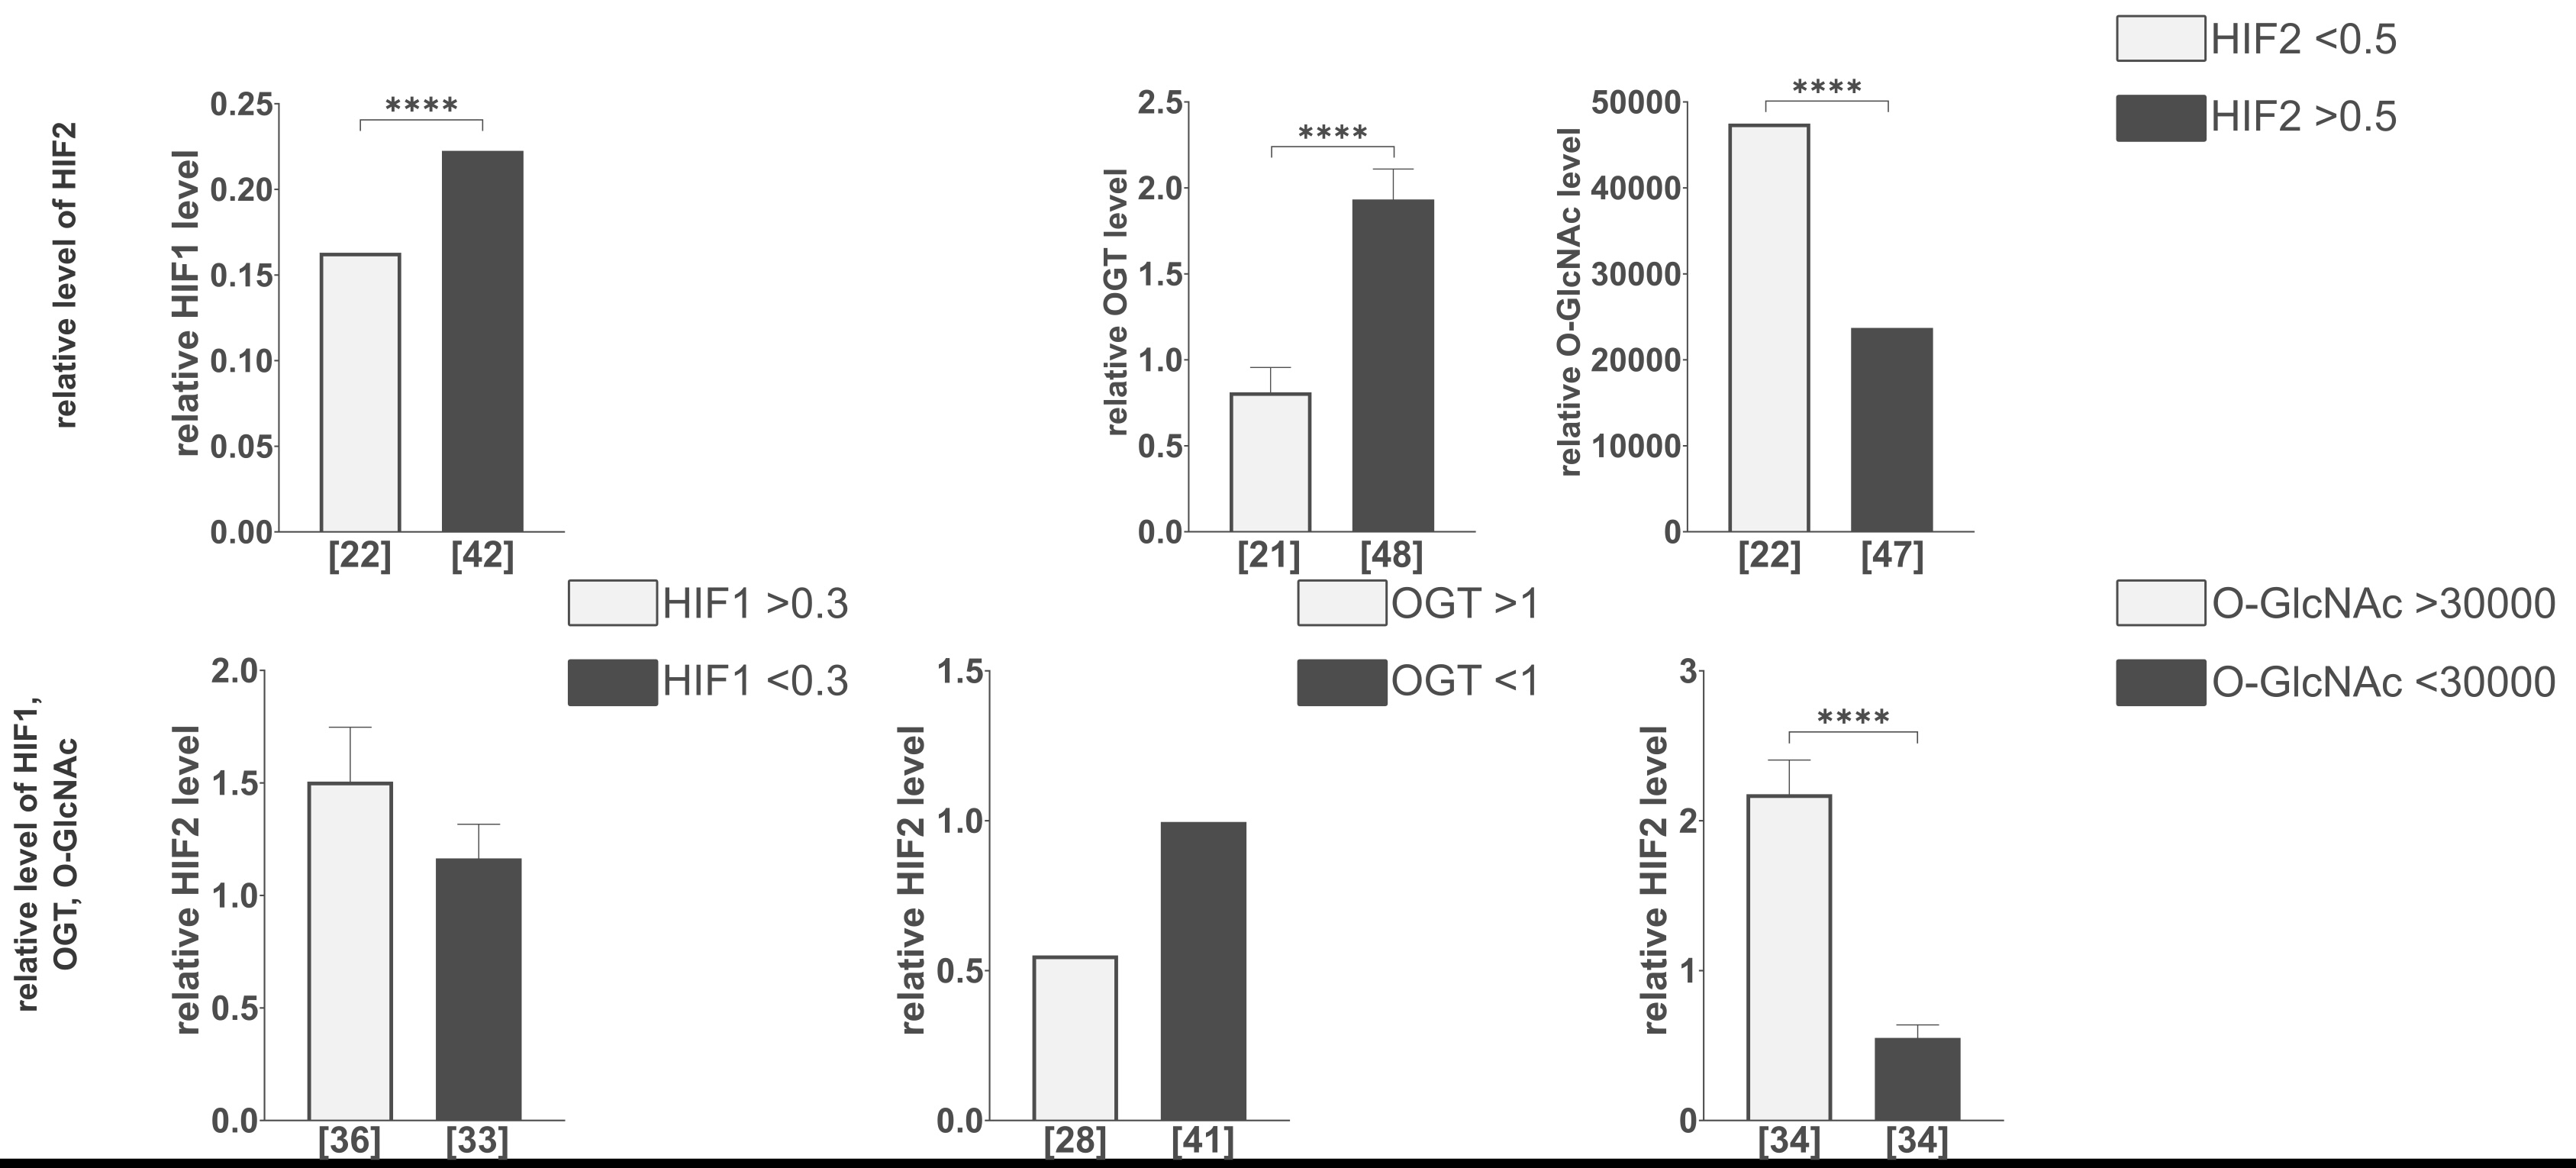
Fig. 4: Comparison of HIF1, OGT, and total O-GlcNAcylation levels in tumors with various levels of HIF2. Comparison of the relative level of HIF2 in tumors with different HIF1, OGT, and total O-GlcNAcylation levels. The levels of HIF1, OGT, and O-GlcNAcylation were compared in tumors with lower (<0.5) and higher (>0.5) relative level changes of HIF2. The HIF2 level was assessed in tumors with lower (<0.3) and higher (>0.3) relative level changes of HIF1, lower (<1) and higher (>1) relative level changes of OGT, and lower (<30000) and higher (>30000) relative level changes of total O-GlcNAcylation. Cut-off points for these parameters were determined based on the natural clusters in the data distribution. The presented graphs show the relative fold change of proteins and modification normalized to positive control (made from MDA-MB-231 and HS578T cells incubated with the addition of cobalt chloride) and PUM1 expression. Data are presented as mean ± SEM for parametric tests and as medians for non-parametric tests. The sample size [n] for each comparison group is indicated in square brackets below the bar. Differences between the initial group size detailed in Table 1 and the final sample size result from missing data or the exclusion of outliers. Statistical significance was defined as p < 0.05 (p ≤ 0.05, *p ≤ 0.01, **p ≤ 0.001, ***p ≤ 0.0001). A full description of the statistical analysis, including sample sizes, normality, and variance comparisons, is provided in the Supplementary Materials (Clinical Samples Statistics.xlsx).
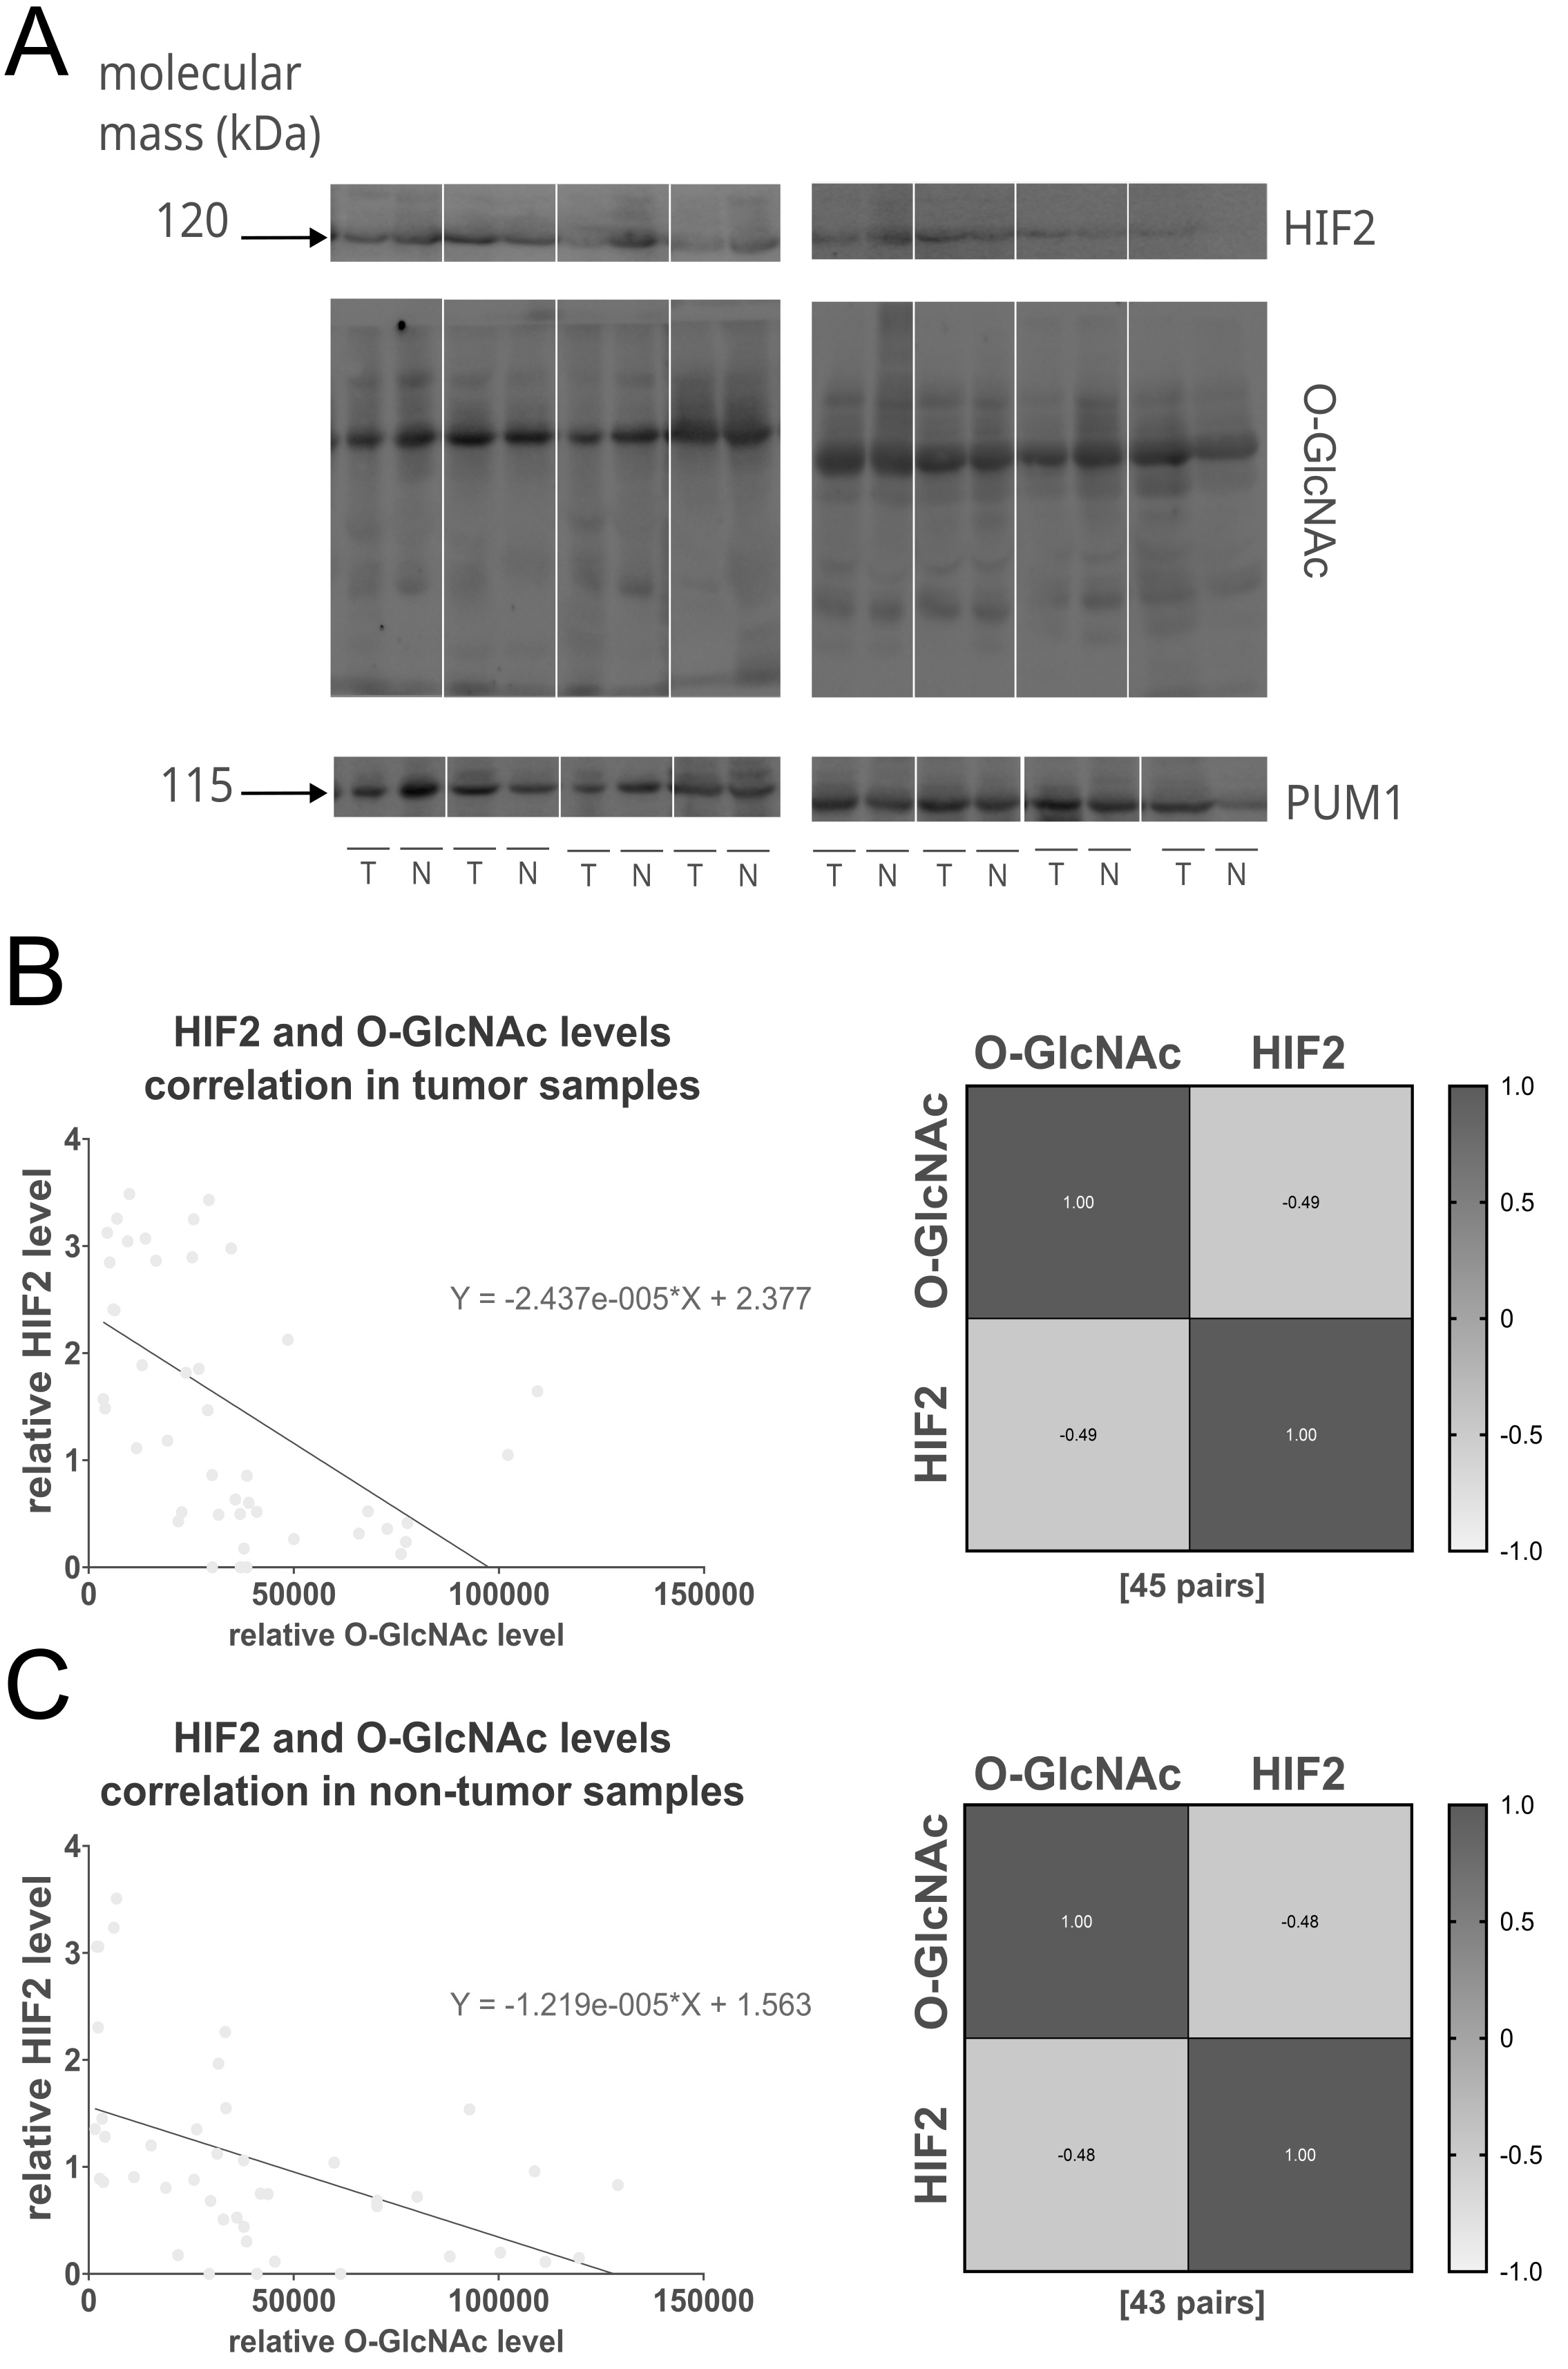
Fig. 5: Negative correlation between the relative HIF2 protein level and total O-GlcNAcylation in tumor and non-tumor samples. The figure shows the representative immunodetection of HIF2 and total O-GlcNAcylation in tumors (T) and paired adjacent non-tumor breast tissues (N) (A), as well as the correlation between HIF2 levels and total O-GlcNAcylation in tumor (B) and matched non-tumor tissue samples (C) visualized with linear regression plots and heat maps. The sample size [n] for each comparison group is indicated in square brackets below the heat map. Pearson correlation analysis revealed a significant negative correlation between HIF2 and total O-GlcNAcylation levels in both tumor (r = -0.49, p = 0.0006) and non-tumor (r = -0.48, p = 0.001) samples. Samples were processed on two parallel blots. A full description of the statistical analysis, including sample sizes and normality assessments (Clinical Samples Statistics.xlsx), and full blots (folder: Western Blot Clinical Samples) are provided in the Supplementary Materials.
HIF1, HIF2, and OGT silencing in MCF-7 and MDA-MB-231 cells
To further investigate the HIF-O-GlcNAc axis in breast cancer, we have conducted experiments with silencing HIF1, HIF2, and OGT in MCF-7 and MDA-MB-231 cells. The effects of the silencing of particular genes’ expression on protein levels in cells cultured in standard conditions or with cobalt chloride is shown in Fig. 6. Cobalt chloride was used as a hypoxia-mimetic agent to inhibit the degradation of hypoxia-inducible factors, resulting in the preservation of its levels. The results of the densitometric analysis of bands corresponding to HIF1, HIF2, OGT, and total O-GlcNAcylation are presented in Fig. 7. Silencing OGT resulted in increased levels of both HIF isoforms, with the dominant increase in the HIF1 isoform for MCF-7 cells and HIF2 for MDA-MB-231 cells. In MDA-MB-231 cells, the highest levels of both OGT and O-GlcNAcylation followed HIF1 silencing; however, even though OGT levels tend to decrease after silencing HIF2, O-GlcNAcylation was increased in MCF-7 cells.
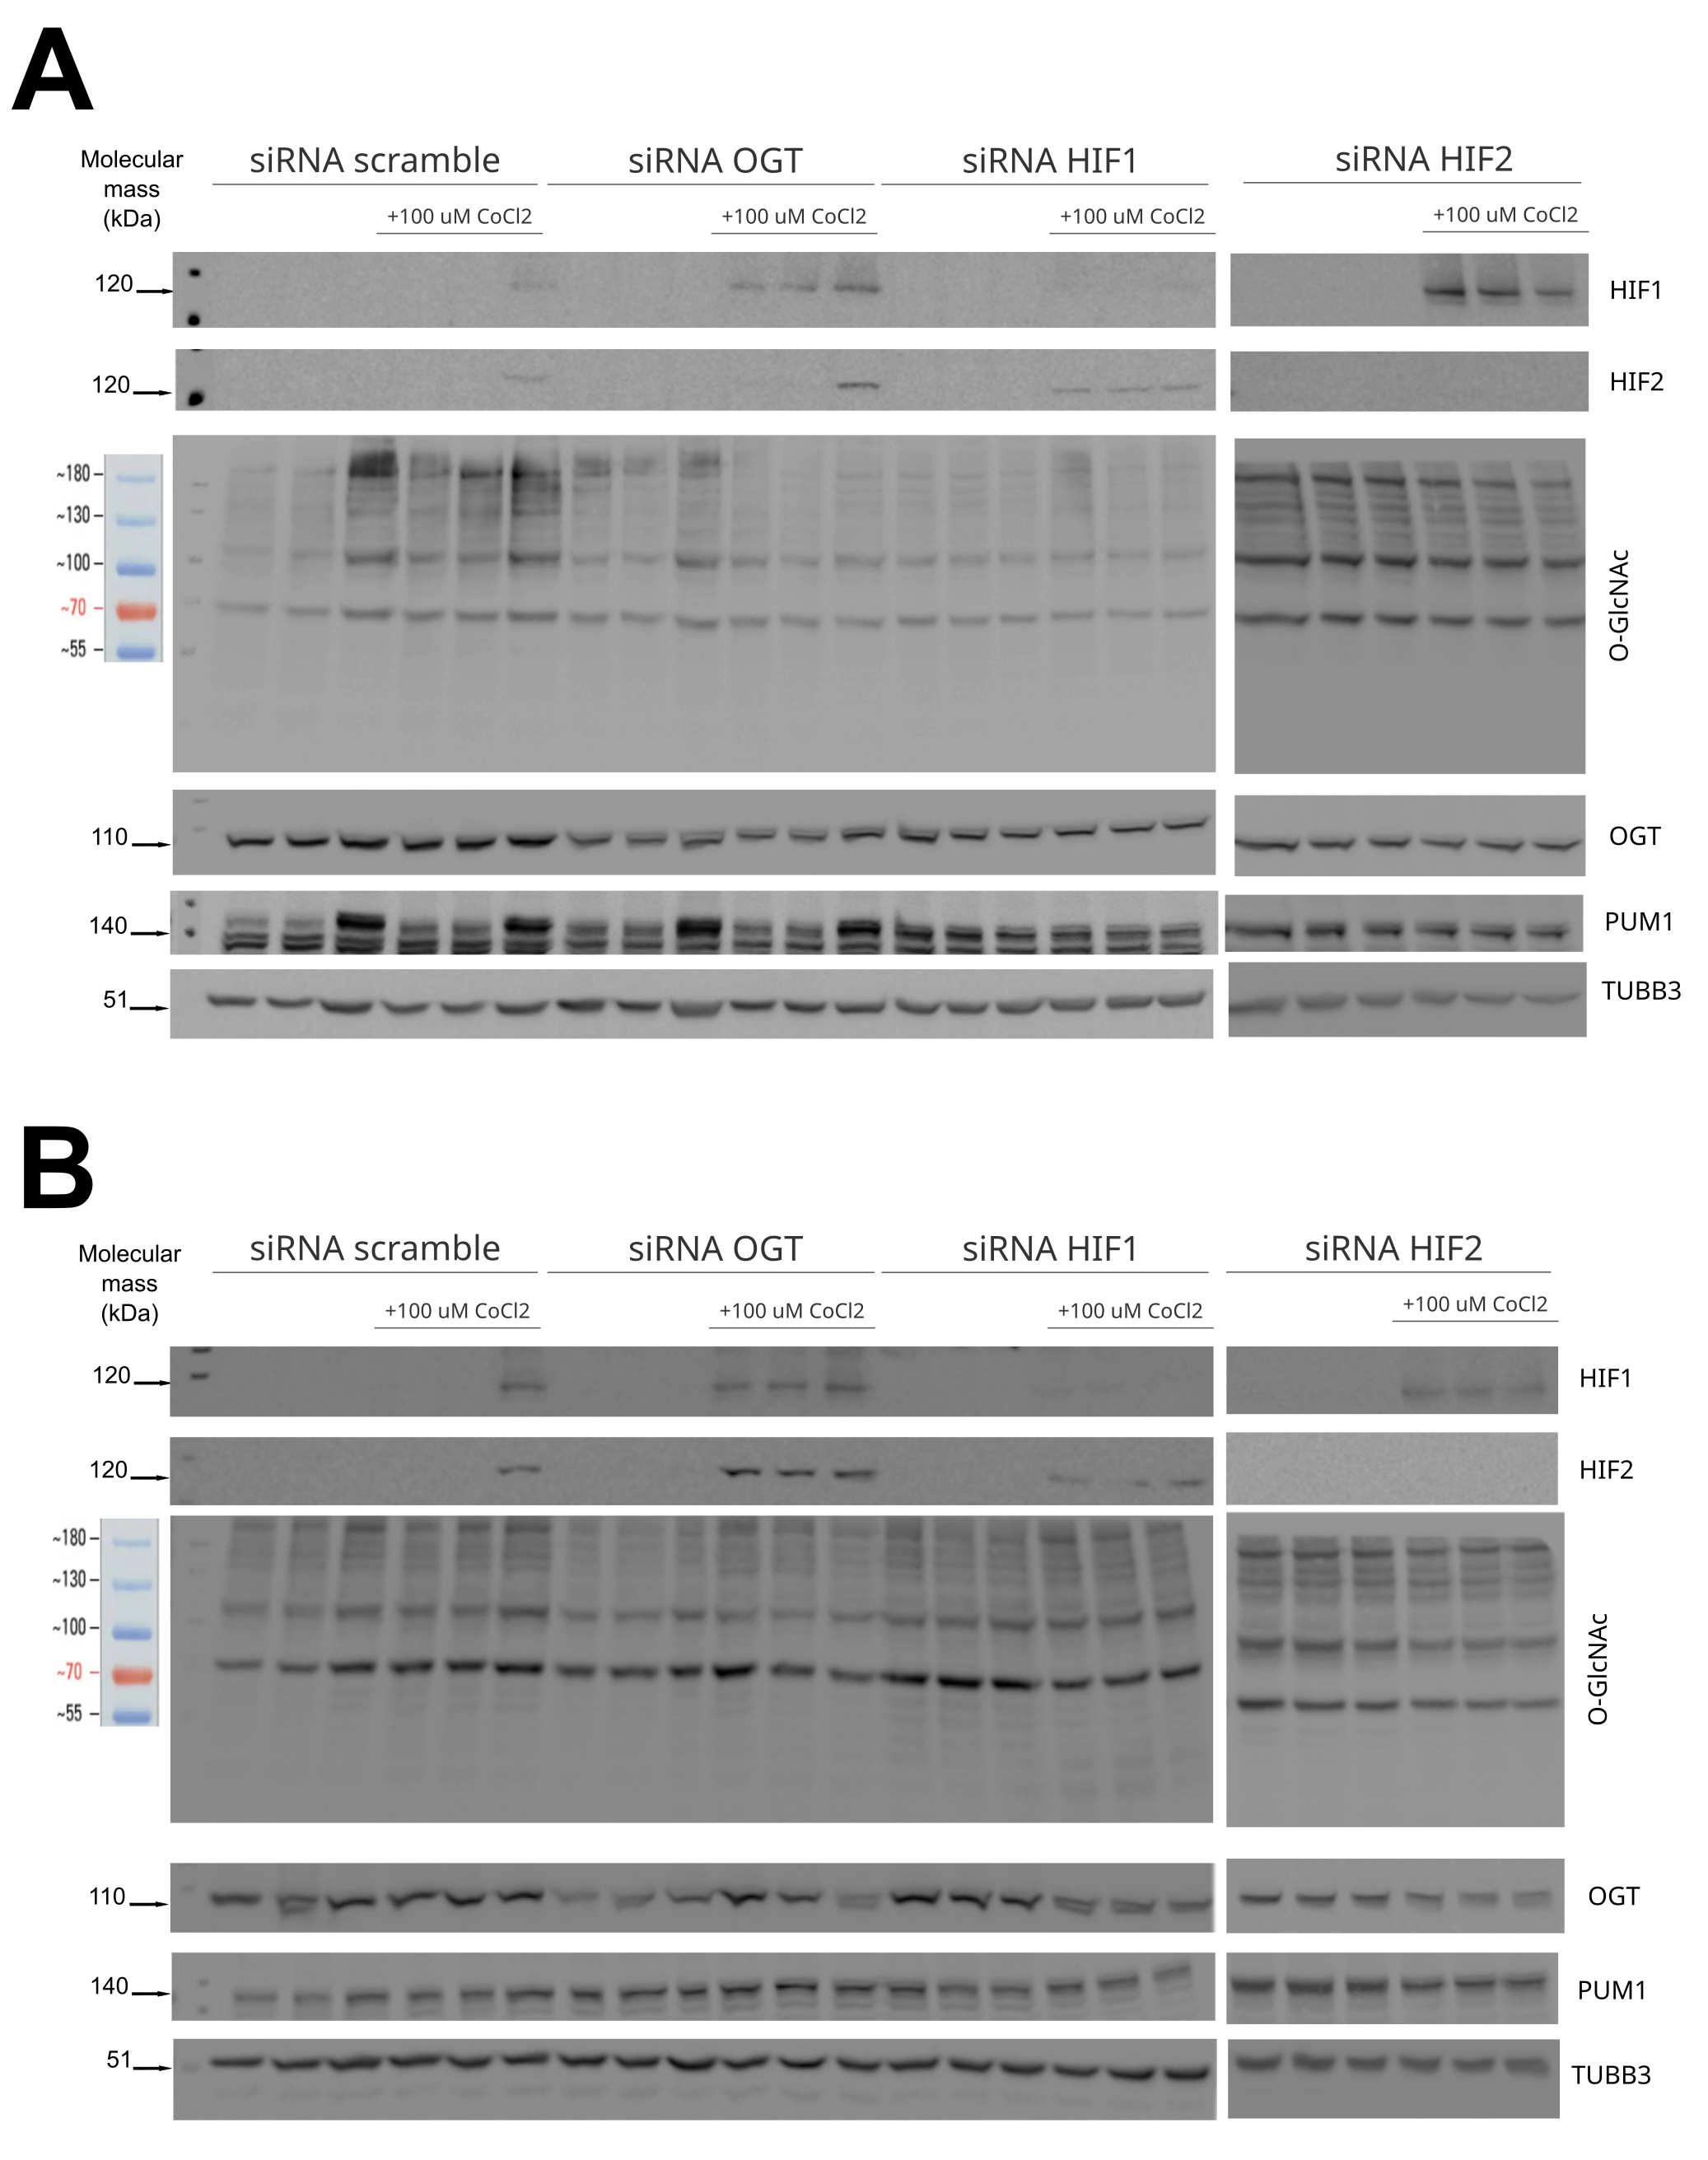
Fig. 6: Western blot analysis of OGT and HIF1/2 silencing effect on protein levels in MCF-7 and MDA-MB-231 cells. Levels of HIF1, HIF2, OGT, and total O-GlcNAcylation were compared between different silencing targets (HIF1, HIF2, OGT) in MCF-7 cells (A) and MDA-MB-231 cells (B) in standard conditions or with the addition of 100µM CoCl2 and referred to negative control done with scramble siRNA. PUM1 and TUBB3 were used as loading controls to equalize the sample comparison. The figure contains representative blots — the remaining immunodetection images are provided in the Supplementary Materials (folder: Western Blot Cells Samples).
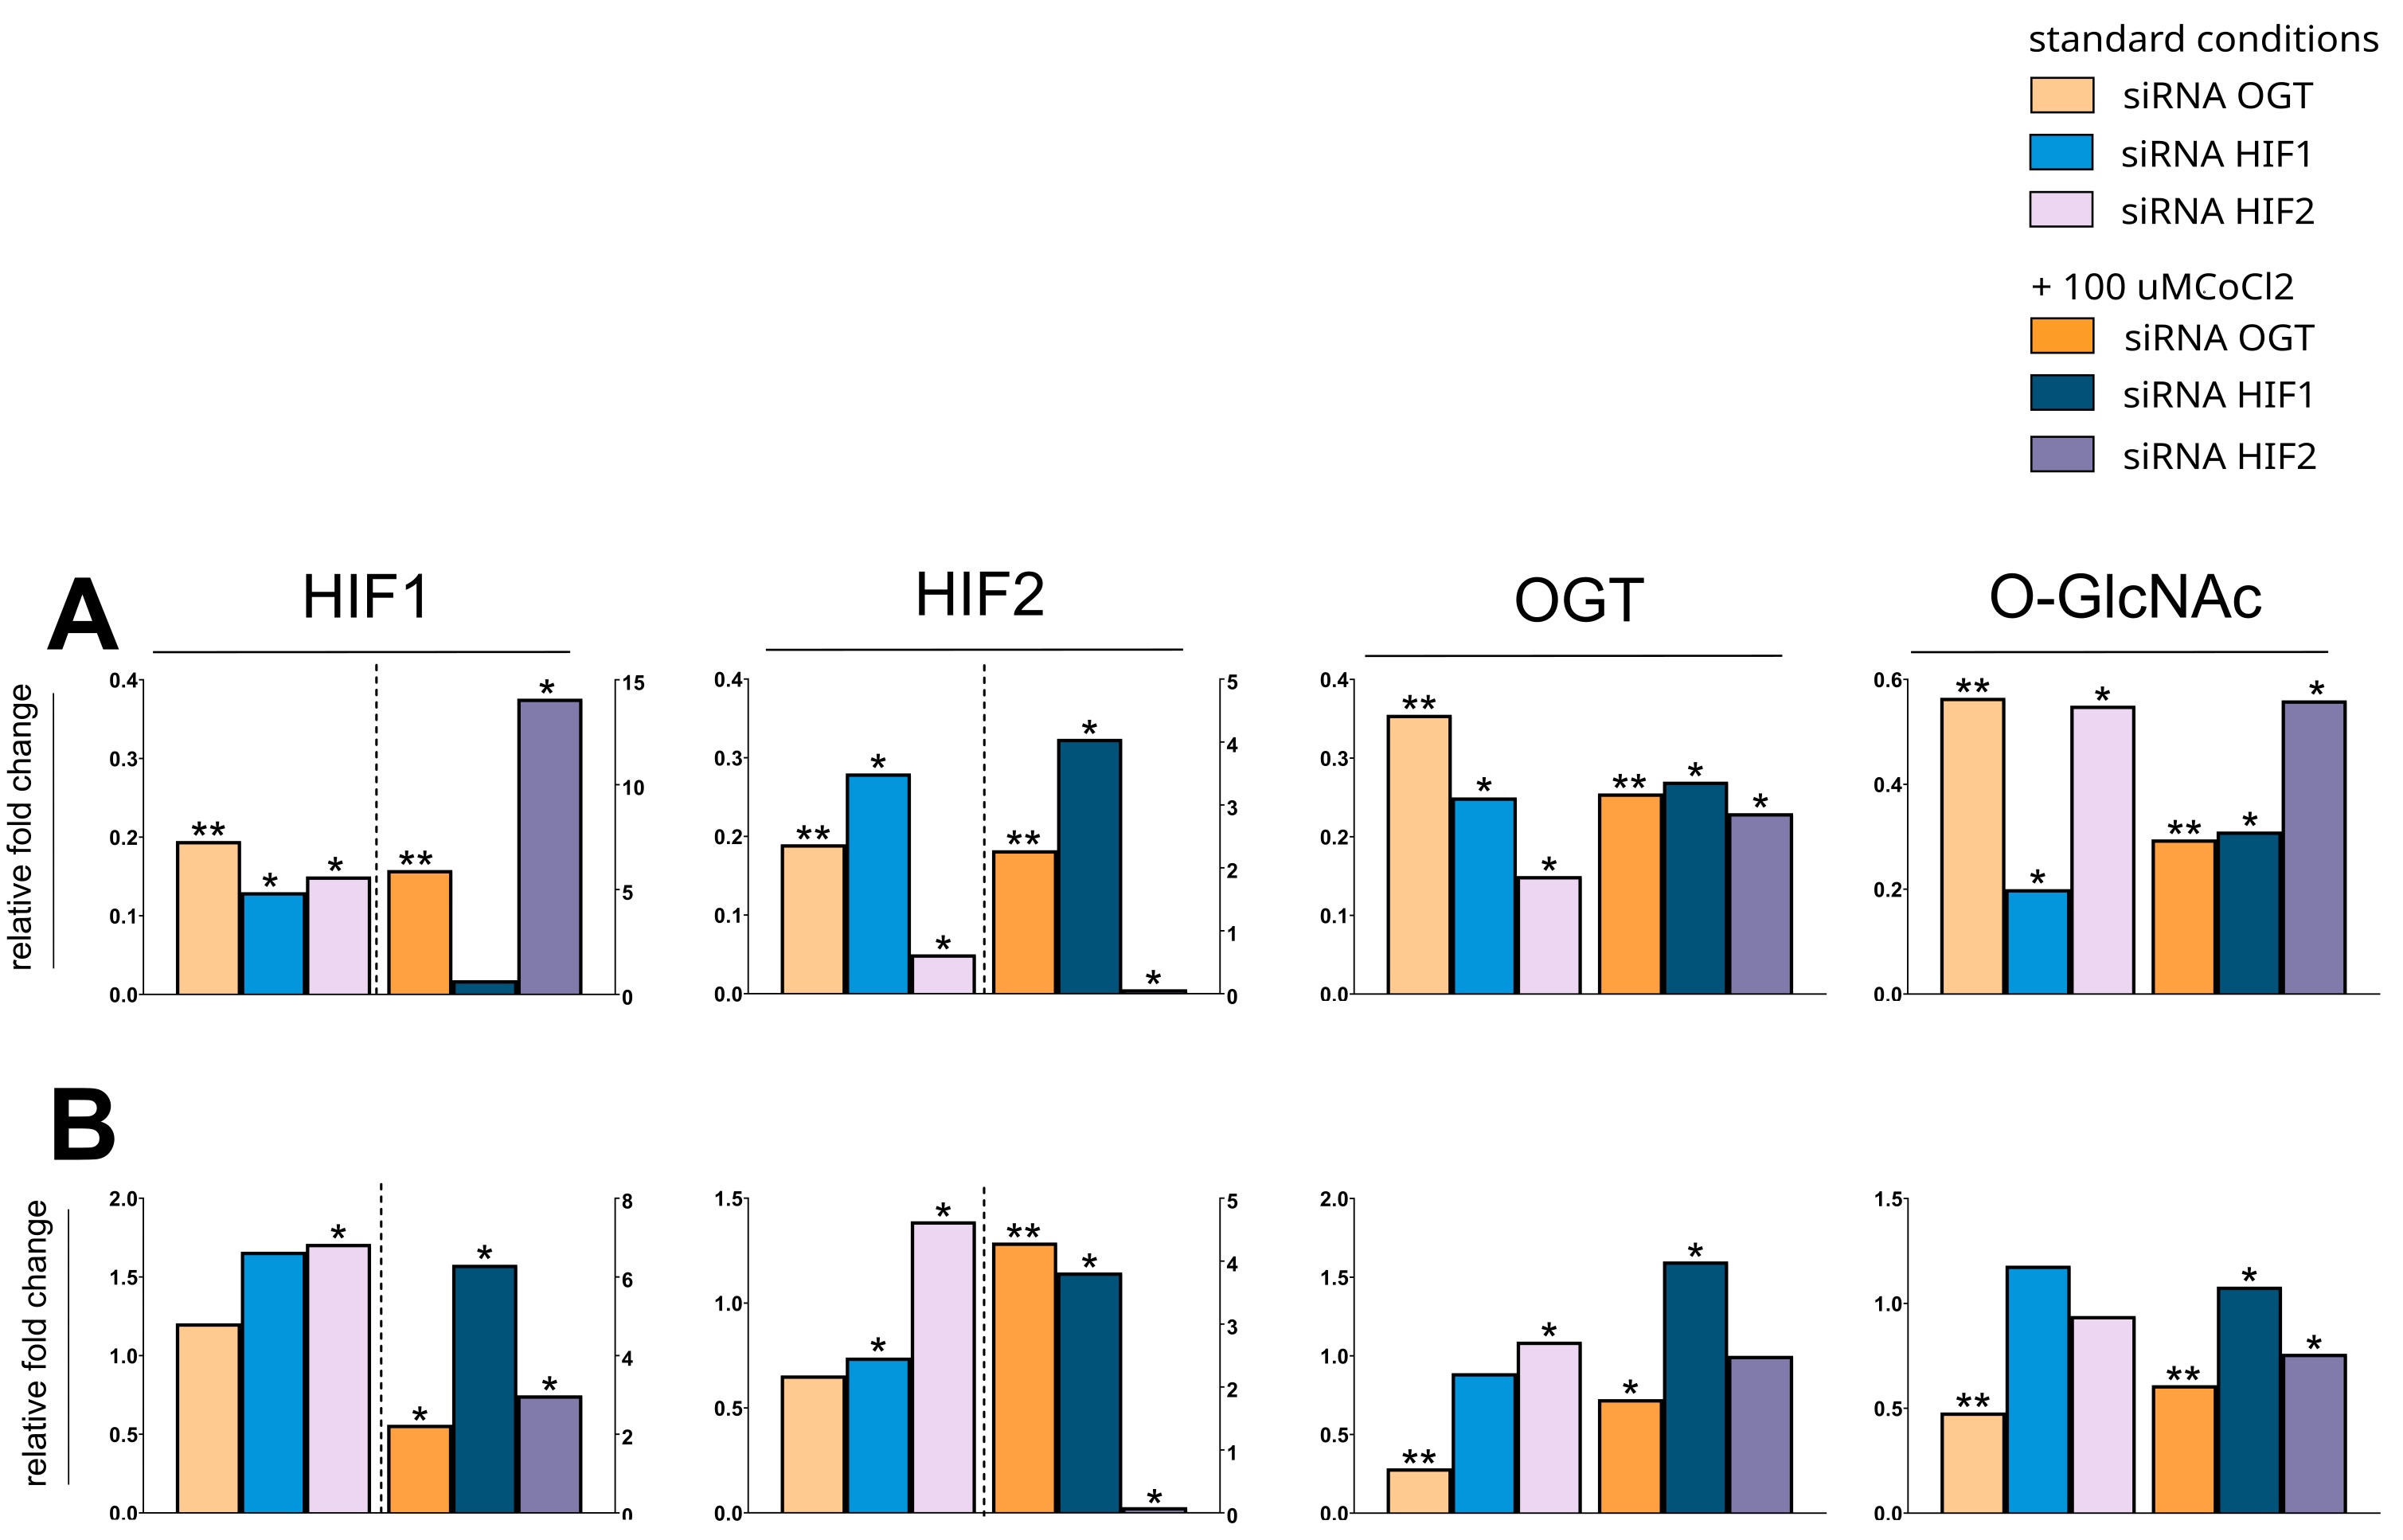
Fig. 7: Effects of OGT and HIF1/2 silencing on protein expression in MCF-7 and MDA-MB-231 cells. (A) MCF-7 and (B) MDA-MB-231 cells were transfected with siRNAs targeting OGT, HIF1, or HIF2. Protein levels were assessed by Western blot and quantified by densitometry. Bars represent the median fold change relative to cells treated with scramble siRNA, normalized to PUM1 and TUBB3. For improved clarity, the fold change of proteins displayed on the bars right to the dashed line are assigned to the right Y-axis to accommodate the significant variations in values magnitudes. The Mann-Whitney test was used to compare the effects of target silencing to scramble siRNA within each treatment condition (standard vs. cobalt chloride). Statistical significance was defined as p ≤ 0.05 (*p ≤ 0.01, **p ≤ 0.001, ***p ≤ 0.0001), displayed only for cells cultured in the same condition (standard vs. with cobalt chloride addition). A full description of the statistical analysis, including sample sizes, is provided in the Supplementary Materials (Cell Samples Statistics.xlsx).
Results of OGT, HIF1, HIF2 silencing on metastasis-related genes and migration
Due to the possibility that the HIF-O-GlcNAcylation axis may be involved in breast cancer migration and metastasis, we have analyzed the impact of HIFs and OGT on the expression of metastasis-related genes, i.e. ZEB1, SNAIL, SLUG, and TWIST1 (Fig. 8), and breast cancer cells migration (Fig. 9). In MCF-7 cells, silencing HIF1 unexpectedly increased ZEB1 expression, along with the expression of other metastasis-associated genes like TWIST1 and SLUG , a direct activator of ZEB1 . Furthermore, silencing HIF1 in MDA-MB-231 cells significantly increased the expression of SNAIL , a gene reportedly regulated by HIF2. Contrary to expectations, OGT downregulation led to an increase, rather than a decrease, in the expression of metastasis-related genes, specifically ZEB1 in MDA-MB-231 cells and TWIST1 in MCF-7 cells.
Under standard culture conditions, silencing the OGT expression in both MDA-MB-231 and MCF-7 cells resulted in more efficient wound closure compared to the control. Similarly, silencing HIF1 also accelerated wound closure in both cell lines. However, silencing HIF2 significantly slowed wound closure in both cell lines, with a more pronounced effect observed in MCF-7 cells after 48 hours. In the presence of CoCl2, the effects of silencing were less pronounced. In MDA-MB-231 cells, silencing OGT still enhanced wound closure, but neither HIF1 nor HIF2 silencing significantly altered wound closure speed. In MCF-7 cells, silencing HIF2 slowed wound closure, although the effect was less prominent than under standard conditions (Fig. 9).
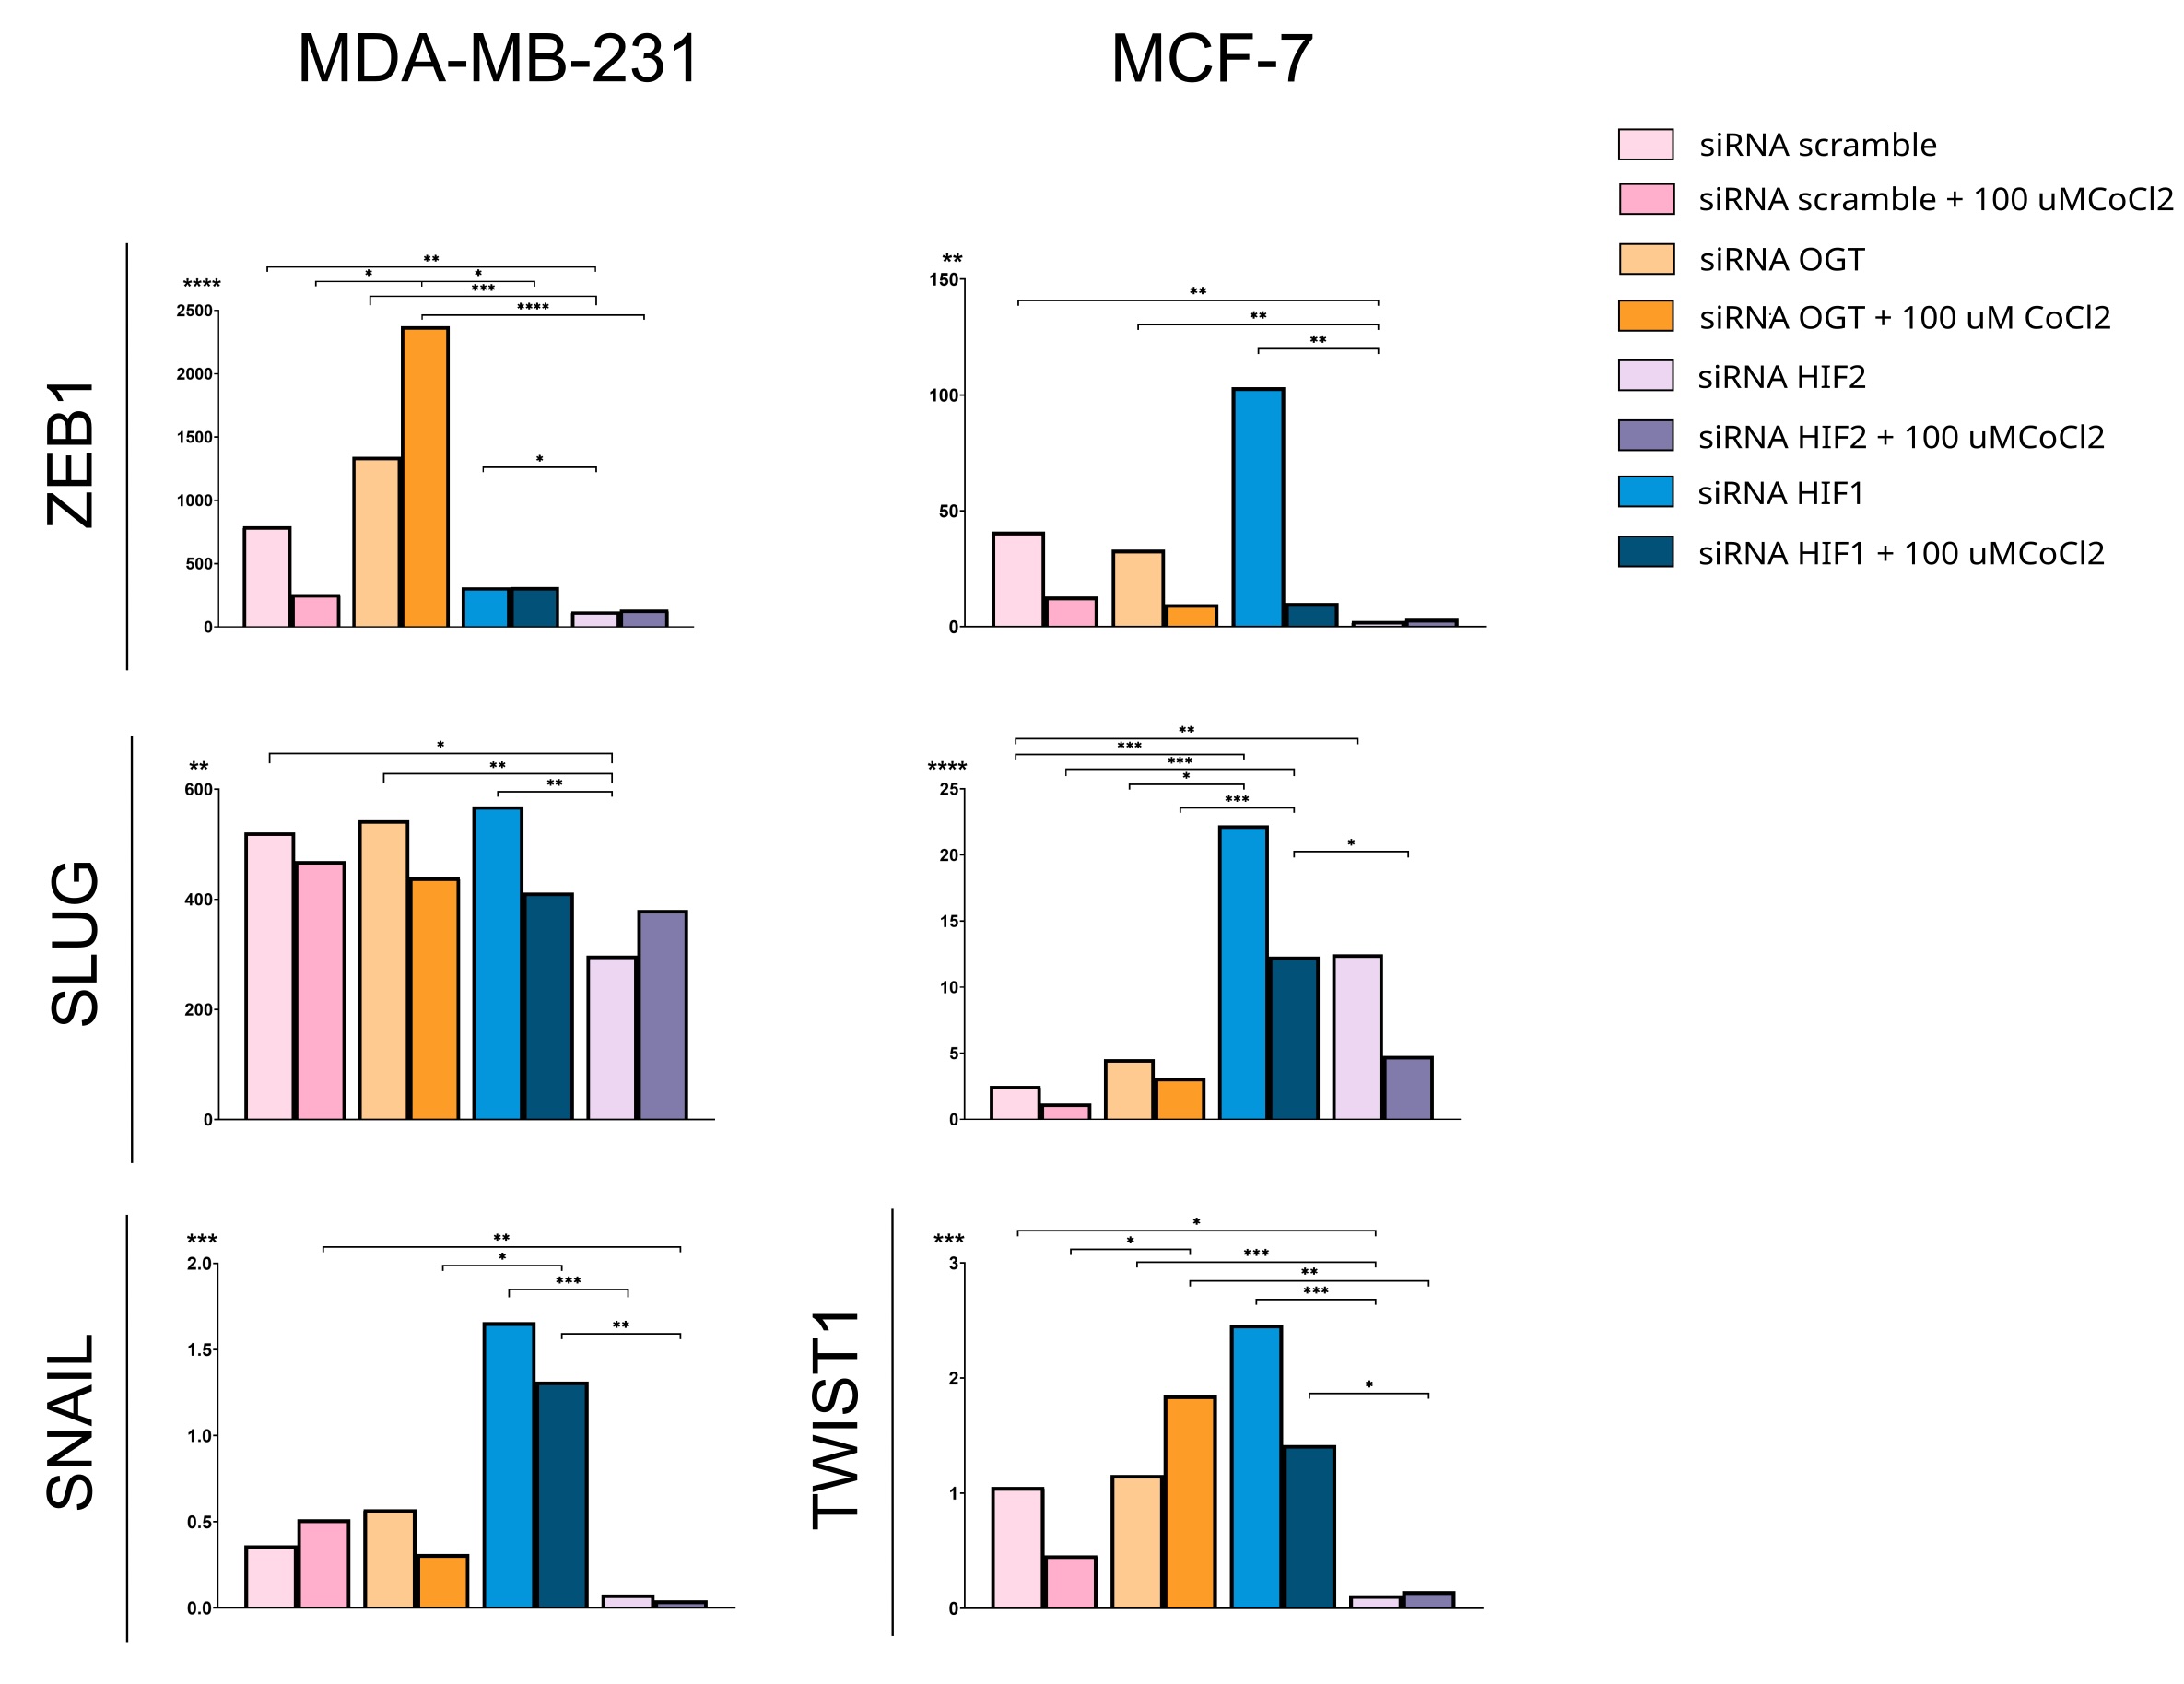
Fig. 8: Effects of OGT and HIF1/HIF2 on expression of metastasis-related genes. ZEB1, SNAIL, SLUG, and TWIST1 expression was analyzed in cells cultured in standard conditions indicated by lighter color bars or with the addition of 100µM CoCl2 displayed on the darker bars and referred to negative control done with scramble siRNA. Results on the SNAIL in MCF-7 cells and TWIST1 in MDA-MB-231 cells are missing due to insufficient amplification of the targets in the PCR. Bars show medians of the relative fold change of expression normalized to PUM1 and HPRT using the 2ΔΔCt method. Statistical significance was defined as p < 0.05 (*p ≤ 0.01, **p ≤ 0.001, ***p ≤ 0.0001), displayed only for cells cultured in the same conditions (standard vs. with cobalt chloride addition). A full description of the statistical analysis, including sample sizes, is provided in the Supplementary Materials (Cell Samples Statistics.xlsx).
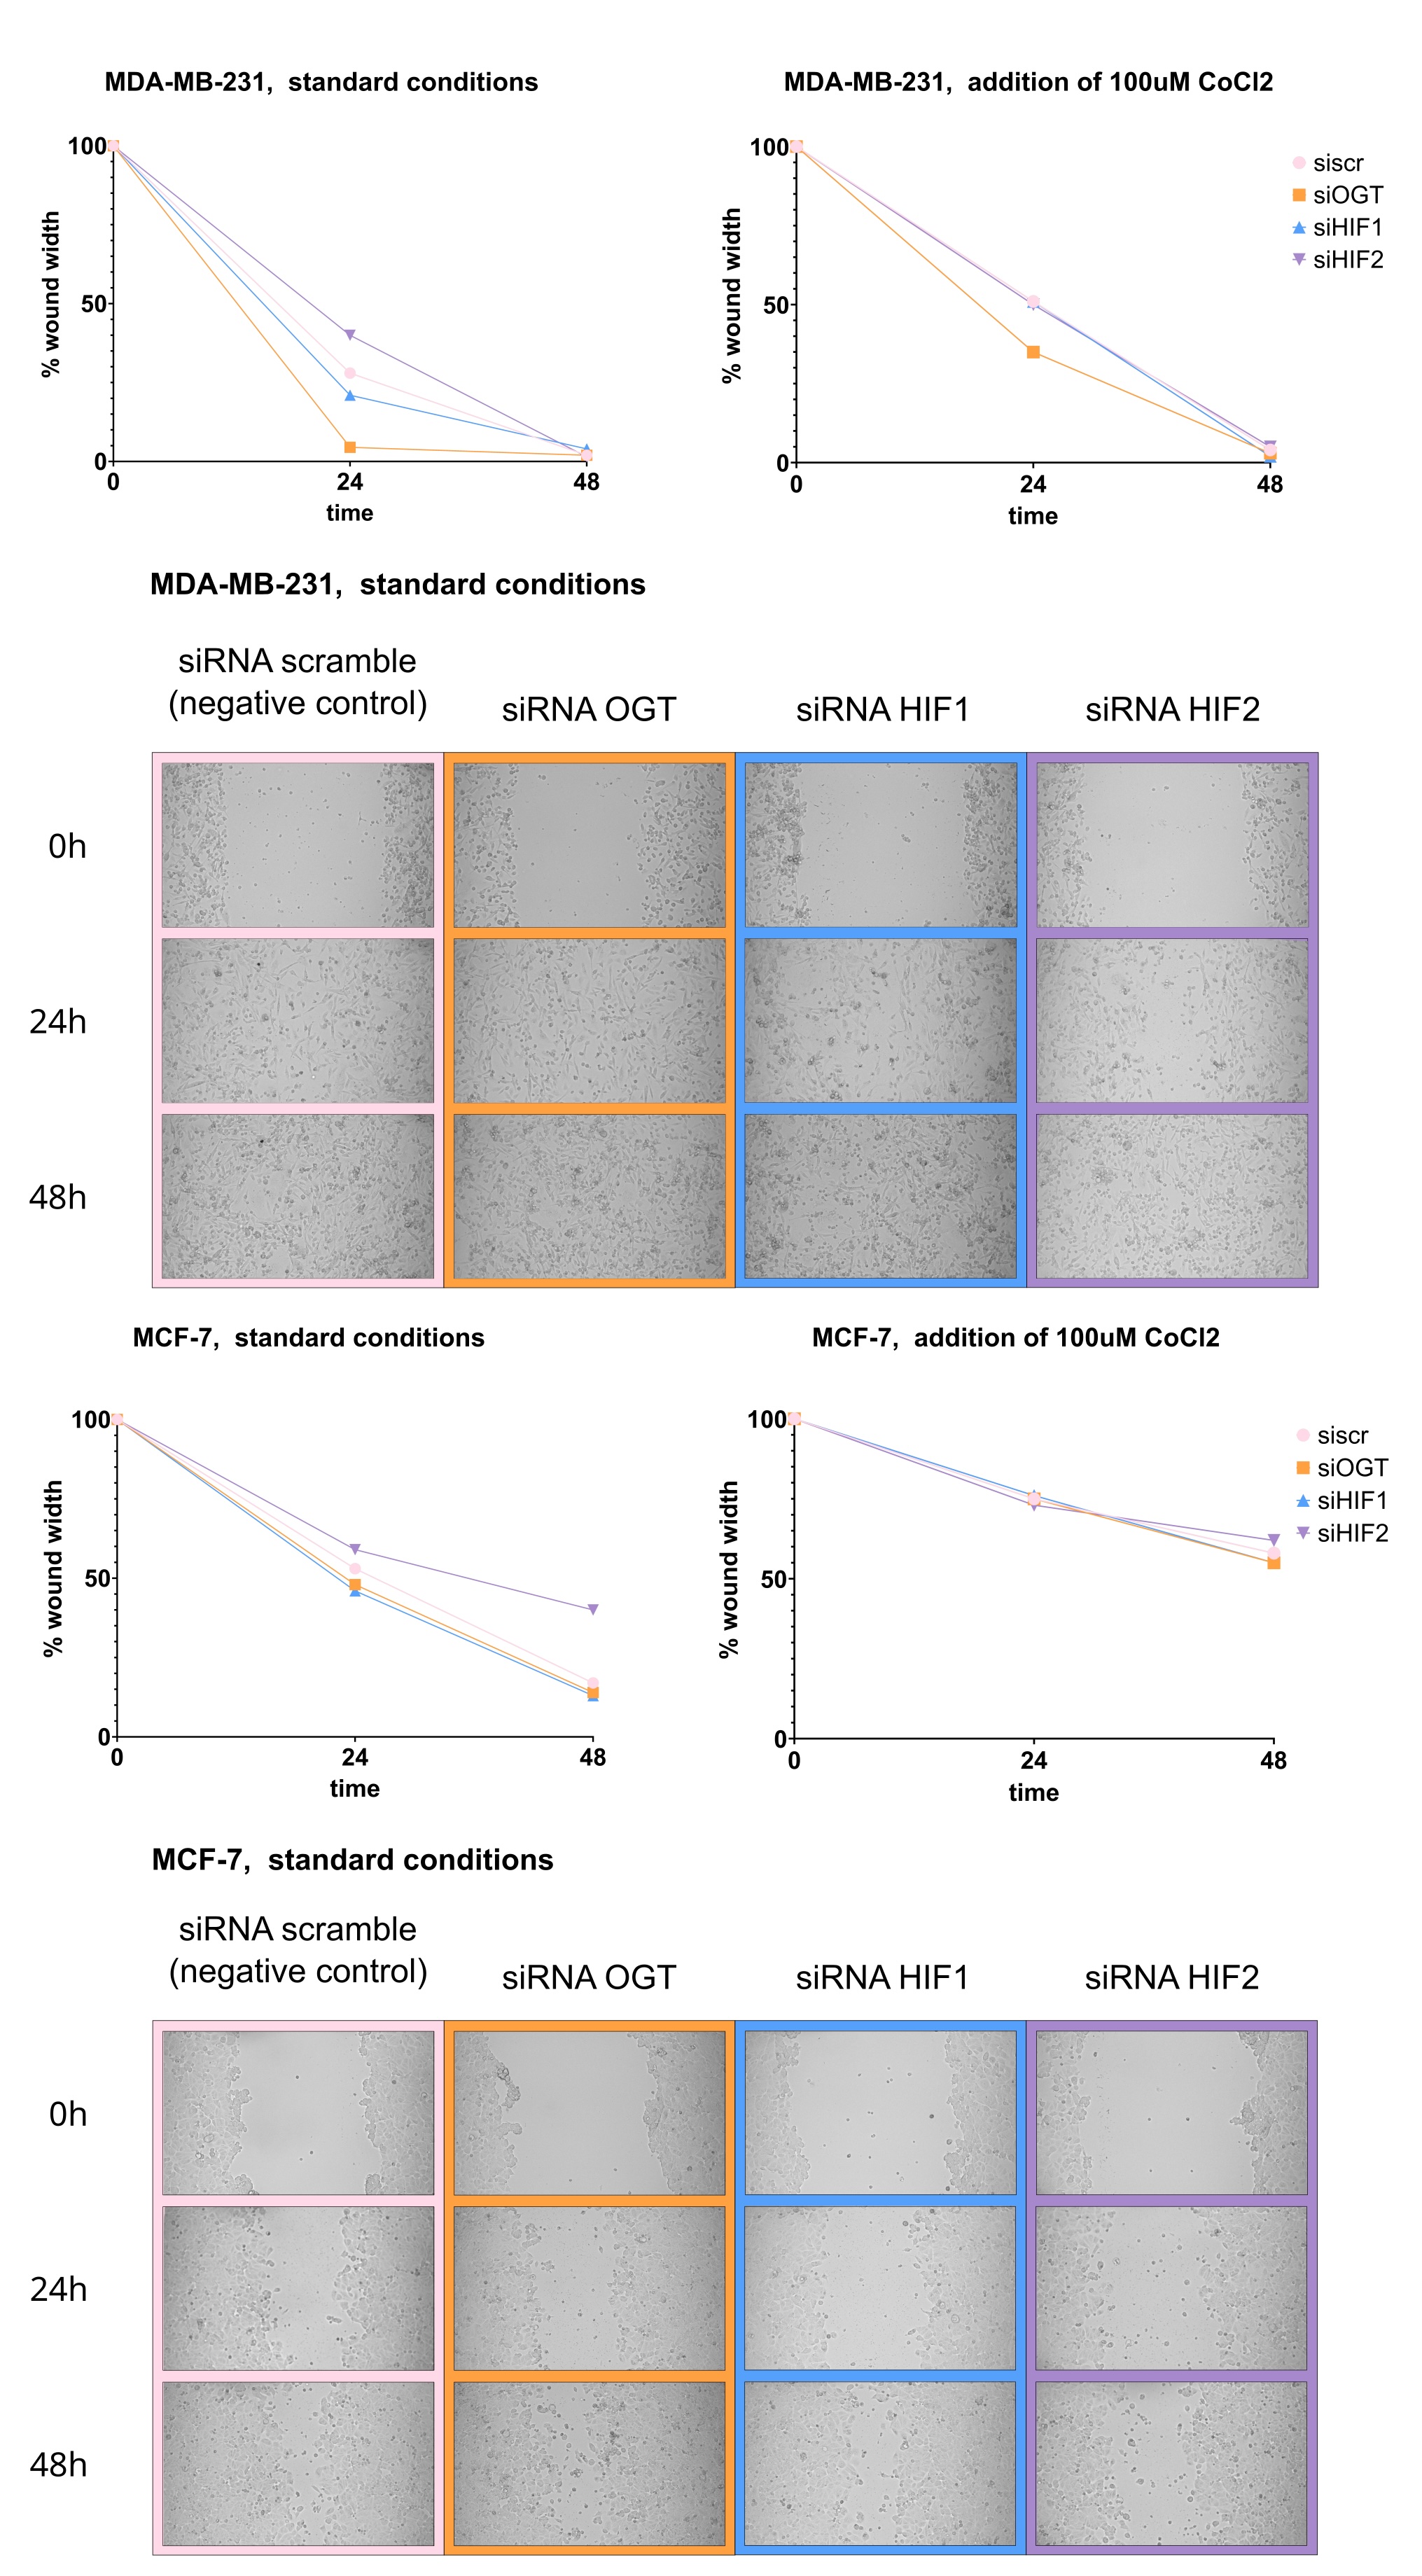
Fig. 9:Effects of OGT, HIF1, and HIF2 silencing on MDA-MB-231 and MCF-7 cells’ migration. Cells were grown to confluence in a 12-well plate. 24 hours after seeding, a sterile 200 μL pipette tip was used to create a scratch wound, then incubated under standard conditions for 48 hours. Images of the scratch area were captured at 0, 24, and 48 hours at x10 magnification. Wound closure was quantified by measuring the wound area using ImageJ. Data is presented as medians of the percentage of wound closure relative to the initial wound area. The Kruskal-Wallis test was used, followed by Dunn's post hoc test for multiple comparisons with statistical significance defined as p < 0.05. The Supplementary Materials (Cell Samples Statistics.xlsx) provide full statistical description and results. The figure includes representative images of wound healing in cells cultured in standard conditions. Exemplary photos were chosen to include wound width percentage approximate to resultant medians shown in graphs.
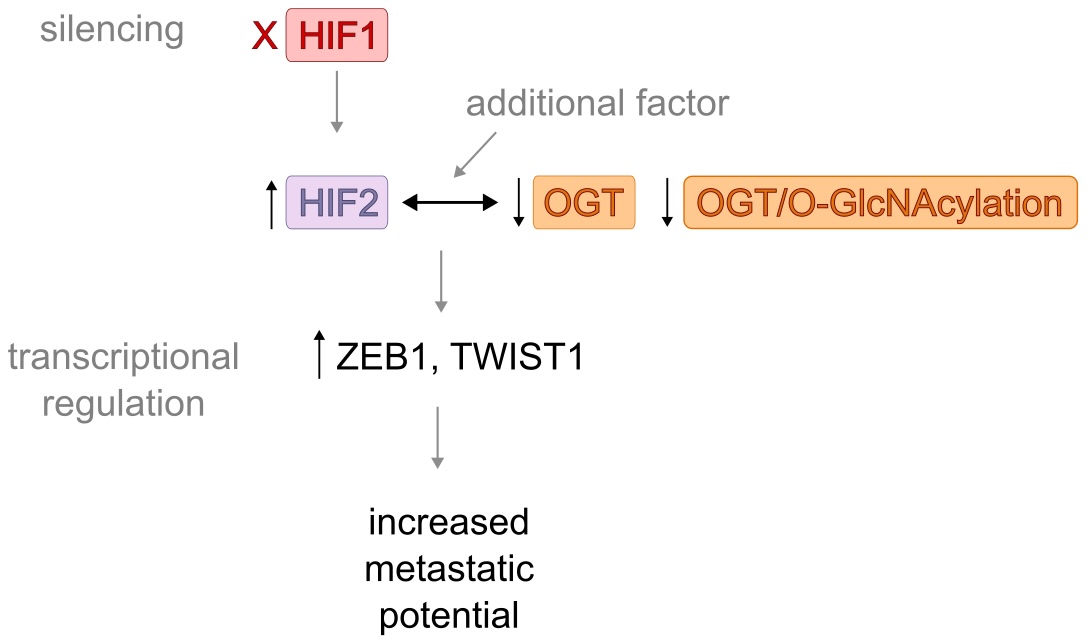
Fig. 10: A schematic summary of the effect of HIF1 silencing in MCF-7 cells. The schematic illustrates the proposed pathway of increased metastatic potential of MCF-7 cells following HIF1 silencing. Results show a significant increase in HIF2 levels and decreased levels of OGT and O-GlcNAc. As the HIF2 and total O-GlcNAcylation were negatively correlated in clinical samples, we hypothesize that changes in their levels might be linked. Results of HIF1 silencing in MCF-7 cells suggest the potential mechanism involving increased levels of HIF2 and decreased levels of OGT and O-GlcNAcylation in the increased metastatic potential of breast cancer. However, the moderate nature of the correlation suggests that additional factors not captured in our in vitro model may also influence the HIF-O-GlcNAc axis.
Discussion
Hypoxia-inducible factor and HIF-dependent angiogenesis and metabolic rewiring are key drivers of breast cancer aggressiveness, therapy resistance, and poor prognoses [8, 21, 22]. Although HIF1 and HIF2 isoforms share similar characteristics, including the ability to heterodimerize with the HIF-1β subunit, bind to hypoxia-inducible genes bearing the hypoxia-response element motif, and transcriptional activation, they differ in their expression levels in different tissues and downstream targets of these HIF isoforms only partially overlap. In breast cancer, HIF1 is the predominantly expressed isoform. Recently, HIF2 is gaining increasing interest due to its potential role in breast cancer progression [8] and metastasis [23]. However, the knowledge on the subject of discrepancies between both isoforms’ expression levels and their significance for breast cancer progression remains limited. The results of our study confirmed the presence of both isoforms in breast cancer, albeit with significant differences in the association of their expression levels with clinicopathological parameters.
Interestingly, we observed significantly higher levels of HIF2 in tumors with local lymph node metastases compared to non-metastatic tumors, which was previously reported for the HIF1 isoform [24]. This may suggest the predominant role of the HIF2 isoform in metastasis. The results of earlier immunohistochemical studies showed that HIF2 expression is associated with poor overall survival in breast cancer patients [25].
Regarding the status of hormonal receptor expression, ER-positive tumors showed lower levels of HIF1 and higher levels of HIF2, while the opposite was observed in ER-negative tumors. This confirms previously reported observations for the HIF1 isoform [26] but adds new information about HIF2. The observation suggests a potential role of the estrogen receptor in regulating the balance between HIF1 and HIF2, although HIF2 showed no significant upregulation regardless of ER status in clinical datasets [27].
To date, the number of studies investigating the relationship between the hypoxia-inducible factor and O-GlcNAcylation is limited to a few. The link between elevated levels of HIF1 and OGT/O-GlcNAcylation levels has already been described [15], the isoform was shown to be the potential target of O-GlcNAcylation [16], and a positive correlation between HIF1 and O-glycosylation-related proteins was reported for oral squamous cell carcinoma [28]. This, however, is the first study to report the correlation between HIF2 and the total O-GlcNAcylation level in breast cancer. Higher HIF2 levels were associated with increased HIF1 and OGT expression but, unexpectedly, decreased total O-GlcNAcylation. The observed reduction in modification level cannot be simply explained by increased activity of OGA (an O-GlcNAcylation reversing enzyme) because of previous observations of a negative correlation between OGT and OGA levels in breast cancers [29]. Notably, no significant correlations were observed between HIF1 and OGT/O-GlcNAc levels, highlighting the specificity of the HIF2-O-GlcNAcylation relationship. However, the correlation was found in both tumor and non-tumor breast tissue, suggesting a more fundamental mechanism. Although the exact relationship between HIF2 and O-GlcNAcylation cannot be determined based on these results, we hypothesize that either HIF2 may regulate O-GlcNAcylation in a broader cellular context or O-GlcNAcylation may influence HIF2 activity. Nevertheless, alterations in the HIF2-O-GlcNAcylation axis might contribute to tumorigenesis or affect breast cancer’s potential for metastasis.
To test the hypothesis about the HIF-O-GlcNAc axis role in breast cancer migration potential, we employed the wound healing assay involving MDA-MB-231 and MCF-7 cells with silenced OGT, HIF1, and HIF2 expression. Hypoxia-inducible factor’s role in breast cancer metastasis was already well articulated, however, mainly for the HIF1 isoform. Although the HIF2 isoform was reported to enhance pro-metastatic expression patterns [30-32], the exact mechanism enabling this behavior under various conditions remains underinvestigated. Our results showed that silencing OGT either HIF1 accelerated wound closure, while silencing HIF2 significantly slowed it, especially in MCF-7 cells. These results highlighted the importance of the HIF2 isoform in cell migration. Silencing HIF2 increased O-GlcNAcylation levels without affecting OGT, and silencing HIF1 decreased both OGT and total O-GlcNAcylation. It suggests that high HIF2 levels, in this case, may hinder OGT activity or modification. These results remain consistent with HIFs and OGlcNAc levels analyses in breast cancer tissue specimens.
Silencing HIF1 and HIF2 causes changes in the expression of genes coding for factors involved in metastasis, such as ZEB1, TWIST1, SLUG, and SNAIL . However, the reduction in expression of these genes is more prominent following HIF2 silencing rather than HIF1, emphasizing the role of the second isoform in breast cancer invasiveness. Silencing HIF1 increased the expression of these factors as the absence of the HIF1 isoform promoted the activity of the HIF2 isoform. Nonetheless, silencing OGT also resulted in a significant increase in the expression of ZEB1 and TWIST1 genes, which might be the effect of the following enhanced activity of HIF2 as that isoform directly regulates these genes [23, 33, 34]. As ZEB1, TWIST1, SLUG, and SNAIL are associated with epithelial-to-mesenchymal transition (EMT) [35], a crucial part of cancer metastasis, enhanced HIF2 activity following HIF1 or OGT silencing, may result in increased breast cancer invasiveness. Figure 10 summarizes the effect of HIF1 silencing on MCF-7 cells.
Some observations concerning the importance of the HIF-OGlcNAc axis differ for MDA-MB-231 and MCF-7 cells, suggesting the involvement of another regulatory factor, which seems to be hormone receptor expression, especially the estrogen receptor. HIF1 was reported to be a direct transcriptional target of ERα, playing an essential role and cooperating with estrogen receptors in breast cancer biology [36]. However, as shown previously [37] and confirmed in our study, while HIF1 and HIF2 sometimes compensate for their functions, their effects on breast cancer biology are not redundant. They might include the impact on O-GlcNAcylation and its cycling enzymes, further affecting the hallmarks of breast cancer.
We acknowledge our study’s limitations. The retrospective design on clinical samples limits the analysis, and the lack of clinical data on survival restricts the data’s correlation with clinical outcomes. The in vitro study was limited to two breast cancer lines in standard conditions and conducted in a 2D cell culture. However, the results from our research suggest the involvement of the HIF-O-GlcNAc axis in breast cancer metastasis. It is worth further investigation, especially given the increasing interest in using HIF or OGT inhibitors in breast cancer therapy [38, 39]. Although testing OGT inhibitors in in vitro models of breast cancer cells resulted in reduced growth, glucose metabolism and chemoresistance, they might not be sufficient for monotherapy [13]. Most clinically tested inhibitors for hypoxia-inducible factor target the HIF1 isoform, but they have an unknown effect on the HIF2 isoform. The implication is that inhibiting those elements might cause elevated HIF2 levels and subsequently increased metastatic potential, even in low-invasive breast cancer cells. Our findings suggest that effective prevention of breast cancer metastasis might require combination targeting the axis with HIF2 inhibitor. Drugs targeting HIF2 directly (PT2399, PT2385, and PT2977) are tested beyond the initial renal cancer model, however their effectiveness is still to be evaluated in the breast cancer model [6].
Conclusion
In conclusion, our findings suggest that the HIF-O-GlcNAc axis plays a critical role in breast cancer metastasis, with HIF1 and HIF2 exhibiting distinct functions. Contrary to expectations, our results show that inhibiting HIF1 or OGT might increase HIF2 levels and subsequently increase breast cancer’s invasiveness. These findings might suggest taking observed effect into account while testing inhibitors targeting OGT or HIF1, and considering drugs targeting HIF2. Further studies are required to fully elucidate the mechanisms underlying the complex relationship between HIF isoforms, O-GlcNAcylation, and breast cancer metastasis. Investigating axis in more complex models and other types of cancer could reveal potential therapeutic implications.
Acknowledgements
The authors gratefully acknowledge Aleksandra Farasiewicz’s editorial assistance in refining the manuscript.
Author Contributions
KK — research idea, study and methodology design, hypothesis formulation, data collection and management, results analysis and interpretation, manuscript preparation; MJ, AS — data collection; MM, MJ, PJ — clinical samples obtaining and processing; AK — conceptualization, data interpretation, manuscript revision. All authors read and approved the final manuscript.
Funding Sources
This study was supported by statutory funds of the University of Lodz and funds from the budget of the BioMedChem Doctoral School of the UL and Lodz Institutes of the Polish Academy of Sciences.
Statement of Ethics
The research was conducted with the approval of the University of Lodz Research Ethics Committee, with signature number 15/KBBN-UŁ/II/2021-22. All participants provided written informed consent before taking part in the study.
Disclosure Statement
The authors have no conflicts of interest to declare.
References
| 1 | Shi R, Liao C, Zhang Q. Hypoxia-Driven Effects in Cancer: Characterization, Mechanisms, and Therapeutic Implications. Cells. 2021;10(3):678.
https://doi.org/10.3390/cells10030678 |
| 2 | Carreau A, El Hafny-Rahbi B, Matejuk A, Grillon C, Kieda C. Why is the partial oxygen pressure of human tissues a crucial parameter? Small molecules and hypoxia. J Cell Mol Med. 2011;15(6):1239-1253.
https://doi.org/10.1111/j.1582-4934.2011.01258.x |
| 3 | Saxena K, Jolly MK. Acute vs. Chronic vs. Cyclic Hypoxia: Their Differential Dynamics, Molecular Mechanisms, and Effects on Tumor Progression. Biomolecules. 2019;9(8):339.
https://doi.org/10.3390/biom9080339 |
| 4 | Maxwell PH, Pugh CW, Ratcliffe PJ. Activation of the HIF pathway in cancer. Curr Opin Genet Dev. 2001;11(3):293-299.
https://doi.org/10.1016/S0959-437X(00)00193-3 |
| 5 | Courtnay R, Ngo DC, Malik N, Ververis K, Tortorella SM, Karagiannis TC. Cancer metabolism and the Warburg effect: the role of HIF-1 and PI3K. Mol Biol Rep. 2015;42(4):841-851.
https://doi.org/10.1007/s11033-015-3858-x |
| 6 | Kozal K, Krześlak A. The Role of Hypoxia-Inducible Factor Isoforms in Breast Cancer and Perspectives on Their Inhibition in Therapy. Cancers (Basel). 2022;14(18):4518.
https://doi.org/10.3390/cancers14184518 |
| 7 | Koh MY, Lemos R Jr, Liu X, Powis G. The hypoxia-associated factor switches cells from HIF-1α- to HIF-2α-dependent signaling promoting stem cell characteristics, aggressive tumor growth and invasion. Cancer Res. 2011;71(11):4015-4027.
https://doi.org/10.1158/0008-5472.CAN-10-4142 |
| 8 | de Heer EC, Jalving M, Harris AL. HIFs, angiogenesis, and metabolism: elusive enemies in breast cancer. J Clin Invest. 2020;130(10):5074-5087.
https://doi.org/10.1172/JCI137552 |
| 9 | Hart GW, Housley MP, Slawson C. Cycling of O-linked beta-N-acetylglucosamine on nucleocytoplasmic proteins. Nature. 2007;446(7139):1017-1022.
https://doi.org/10.1038/nature05815 |
| 10 | Fardini Y, Dehennaut V, Lefebvre T, Issad T. O-GlcNAcylation: A New Cancer Hallmark?. Front Endocrinol (Lausanne). 2013;4:99.
https://doi.org/10.3389/fendo.2013.00099 |
| 11 | Netsirisawan P, Chokchaichamnankit D, Saharat K, Srisomsap C, Svasti J, Champattanachai V. Quantitative proteomic analysis of the association between decreasing O‑GlcNAcylation and metastasis in MCF‑7 breast cancer cells. Int J Oncol. 2020;56(6):1387-1404.
https://doi.org/10.3892/ijo.2020.5022 |
| 12 | Singh JP, Qian K, Lee JS, et al. O-GlcNAcase targets pyruvate kinase M2 to regulate tumor growth. Oncogene. 2020;39(3):560-573.
https://doi.org/10.1038/s41388-019-0975-3 |
| 13 | Kozal K, Krześlak A. Role of O-GlcNAcylation in Breast Cancer Biology. Cell Physiol Biochem. 2023;57(3):183-197.
https://doi.org/10.33594/000000633 |
| 14 | Parker MP, Peterson KR, Slawson C. O-GlcNAcylation and O-GlcNAc Cycling Regulate Gene Transcription: Emerging Roles in Cancer. Cancers (Basel). 2021;13(7):1666.
https://doi.org/10.3390/cancers13071666 |
| 15 | Ferrer CM, Lynch TP, Sodi VL, et al. O-GlcNAcylation regulates cancer metabolism and survival stress signaling via regulation of the HIF-1 pathway. Mol Cell. 2014;54(5):820-831.
https://doi.org/10.1016/j.molcel.2014.04.026 |
| 16 | Wu ZL, Luo A, Grill A, Lao T, Zou Y, Chen Y. Fluorescent Detection of O-GlcNAc via Tandem Glycan Labeling. Bioconjug Chem. 2020;31(9):2098-2102.
https://doi.org/10.1021/acs.bioconjchem.0c00454 |
| 17 | Tilli TM, Castro Cda S, Tuszynski JA, Carels N. A strategy to identify housekeeping genes suitable for analysis in breast cancer diseases. BMC Genomics. 2016;17(1):639.
https://doi.org/10.1186/s12864-016-2946-1 |
| 18 | Fu OY, Hou MF, Yang SF, Huang SC, Lee WY. Cobalt chloride-induced hypoxia modulates the invasive potential and matrix metalloproteinases of primary and metastatic breast cancer cells. Anticancer Res. 2009;29(8):3131-3138.
|
| 19 | Rana NK, Singh P, Koch B. CoCl2 simulated hypoxia induce cell proliferation and alter the expression pattern of hypoxia associated genes involved in angiogenesis and apoptosis. Biol Res. 2019;52(1):12.
https://doi.org/10.1186/s40659-019-0221-z |
| 20 | Suarez-Arnedo A, Torres Figueroa F, Clavijo C, Arbeláez P, Cruz JC, Muñoz-Camargo C. An image J plugin for the high throughput image analysis of in vitro scratch wound healing assays. PLoS One. 2020;15(7):e0232565.
https://doi.org/10.1371/journal.pone.0232565 |
| 21 | McAleese CE, Choudhury C, Butcher NJ, Minchin RF. Hypoxia-mediated drug resistance in breast cancers. Cancer Lett. 2021;502:189-199.
https://doi.org/10.1016/j.canlet.2020.11.045 |
| 22 | Han S, Huang T, Hou F, Yao L, Wang X, Wu X. The prognostic value of hypoxia-inducible factor-1α in advanced cancer survivors: a meta-analysis with trial sequential analysis. Ther Adv Med Oncol. 2019;11:1758835919875851.
https://doi.org/10.1177/1758835919875851 |
| 23 | Yang H, Geng YH, Wang P, et al. Extracellular ATP promotes breast cancer invasion and epithelial-mesenchymal transition via hypoxia-inducible factor 2α signaling. Cancer Sci. 2019;110(8):2456-2470.
https://doi.org/10.1111/cas.14086 |
| 24 | Cui J, Jiang H. Prediction of postoperative survival of triple-negative breast cancer based on nomogram model combined with expression of HIF-1α and c-myc. Medicine (Baltimore). 2019;98(40):e17370.
https://doi.org/10.1097/MD.0000000000017370 |
| 25 | Wang HX, Qin C, Han FY, Wang XH, Li N. HIF-2α as a prognostic marker for breast cancer progression and patient survival. Genet Mol Res. 2014;13(2):2817-2826.
https://doi.org/10.4238/2014.January.22.6 |
| 26 | Jögi A, Ehinger A, Hartman L, Alkner S. Expression of HIF-1α is related to a poor prognosis and tamoxifen resistance in contralateral breast cancer. PLoS One. 2019;14(12):e0226150.
https://doi.org/10.1371/journal.pone.0226150 |
| 27 | Abu-Jamous B, Buffa FM, Harris AL, Nandi AK. In vitro downregulated hypoxia transcriptome is associated with poor prognosis in breast cancer. Mol Cancer. 2017;16(1):105.
https://doi.org/10.1186/s12943-017-0673-0 |
| 28 | Xu X, Liu H, Wu R, Zuo W, Wang T, Chen D. Analysis of the correlation of the expression level of hypoxia-inducible factor-1α with the glycosylation of oral squamous cell carcinoma. Am J Transl Res. 2021;13(6):6686-6693.
|
| 29 | Krześlak A, Forma E, Bernaciak M, Romanowicz H, Bryś M. Gene expression of O-GlcNAc cycling enzymes in human breast cancers. Clin Exp Med. 2012;12(1):61-65.
https://doi.org/10.1007/s10238-011-0138-5 |
| 30 | Chen Y, Zhang B, Bao L, et al. ZMYND8 acetylation mediates HIF-dependent breast cancer progression and metastasis. J Clin Invest. 2018;128(5):1937-1955.
https://doi.org/10.1172/JCI95089 |
| 31 | Bai J, Chen WB, Zhang XY, et al. HIF-2α regulates CD44 to promote cancer stem cell activation in triple-negative breast cancer via PI3K/AKT/mTOR signaling. World J Stem Cells. 2020;12(1):87-99.
https://doi.org/10.4252/wjsc.v12.i1.87 |
| 32 | Huang W, Liu X, Zhang Y, et al. USP5 promotes breast cancer cell proliferation and metastasis by stabilizing HIF2α. J Cell Physiol. 2022;237(4):2211-2219.
https://doi.org/10.1002/jcp.30686 |
| 33 | Lee SY, Ju MK, Jeon HM, et al. Oncogenic Metabolism Acts as a Prerequisite Step for Induction of Cancer Metastasis and Cancer Stem Cell Phenotype. Oxid Med Cell Longev. 2018;2018:1027453. doi:10.1155/2018/1027453
https://doi.org/10.1155/2018/1027453 |
| 34 | Gort EH, van Haaften G, Verlaan I, et al. The TWIST1 oncogene is a direct target of hypoxia-inducible factor-2alpha. Oncogene. 2008;27(11):1501-1510.
https://doi.org/10.1038/sj.onc.1210795 |
| 35 | Imani S, Hosseinifard H, Cheng J, Wei C, Fu J. Prognostic Value of EMT-inducing Transcription Factors (EMT-TFs) in Metastatic Breast Cancer: A Systematic Review and Meta-analysis. Sci Rep. 2016;6:28587.
https://doi.org/10.1038/srep28587 |
| 36 | Yang J, AlTahan A, Jones DT, et al. Estrogen receptor-α directly regulates the hypoxia-inducible factor 1 pathway associated with antiestrogen response in breast cancer. Proc Natl Acad Sci U S A. 2015;112(49):15172-15177.
https://doi.org/10.1073/pnas.1422015112 |
| 37 | Keith B, Johnson RS, Simon MC. HIF1α and HIF2α: sibling rivalry in hypoxic tumour growth and progression. Nat Rev Cancer. 2011;12(1):9-22.
https://doi.org/10.1038/nrc3183 |
| 38 | Luo S, Jiang Y, Anfu Zheng, et al. Targeting hypoxia-inducible factors for breast cancer therapy: A narrative review. Front Pharmacol. 2022;13:1064661.
https://doi.org/10.3389/fphar.2022.1064661 |
| 39 | Barkovskaya A, Seip K, Prasmickaite L, Mills IG, Moestue SA, Itkonen HM. Inhibition of O-GlcNAc transferase activates tumor-suppressor gene expression in tamoxifen-resistant breast cancer cells. Sci Rep. 2020;10(1):16992.
https://doi.org/10.1038/s41598-020-74083-z |